ISSN 1546-9239
© 2008 Science Publications
Corresponding Author: Mohammad Tafazzoli-Shadpour, Cardiovascular Engineering Lab., Faculty of Biomedical Engineering, Amirkabir University of Technology, P.O. Box 15875-4413, Tehran, Iran
A New System to Analyze Pulsatile Flow Characteristics in Elastic Tubes for
Hemodynamic Applications
1
Afshin Anssari-Benam,
1Mohammad Tafazzoli-Shadpour,
2Nasser Fatouraee,
2Ali
Pashaiee and
Mohammad M. Khani
1
Cardiovascular Engineering Lab., Faculty of Biomedical Engineering
2
Biological Fluid Mechanics Lab., Faculty of Biomedical Engineering
Amirkabir University of Technology, P.O. Box 15875-4413, Tehran, Iran
Abstract: In this research, we present a new designed experimental setup for study of characteristics of pulsatile flow in elastic tubes, aiming to simulate arterial blood flow. This system includes four major components: (1) a pulsatile pump producing original arterial flow, (2) an elastic element to simulate coupling of the heart with the arterial system, (3) an elastic tube with mechanical characteristics of the arterial wall and assembly of pressure transducers to monitor inlet and outlet pulsatile pressures and the resultant pulsatile pressure gradient and (4) a resistant element to simulate peripheral resistant distal the artery. The system is capable of performing under different mechanical conditions, including tubes with different elastic moduli and fluids with different viscosities. Experimental results showed a precise ability of producing original blood flow waves and recording pressure pulses and pressure gradient waves under different mechanical conditions. The resultant pressure pulses were compatible with the diastolic-systolic pressure pulses of typical arteries. The system showed an accurate sensitivity to variations of fluid viscosity and elasticity of tube wall. Experimental results showed that stiffening of the wall resulted in decrease of mean pressure gradient pulse. Results also showed that an elevated fluid viscosity led to a higher mean value of pressure gradient and less fluctuation of pressure gradient pulse. Results are in good agreement with theoretical considerations of higher energy dissipation and consequent pressure drop by increased fluid viscosity. The designed experimental setup might be used in evaluation of hemodynamic parameters in patho-physiological situations such as stenotic arteries and age related stiffening.
Key words: Pulsatile flow, hemodynamics, pressure gradient
INTRODUCTION
Hemodynamics plays an important role in understanding the nature of blood flow through the cardiovascular system. The study of the hemodynamic parameters, such as the pulsatile blood pressure and flow and resistance to the blood flow[1], allows a better understanding of blood circulation[2].
Since initiation and development of many cardiovascular diseases have been attributed to hemodynamic parameters, such studies have become of particular importance during the past few years[3-4]. Cardiovascular diseases are one of the major causes of world mortality[5].
Various hemodynamic parameters have been implicated in the development of cardiovascular diseases. Such parameters include disturbed flow patterns[6,7], low shear stress[8-10], low and oscillating
shear stress[11,12], temporal variation of the shear stress[13], spatial wall shear stress gradient[14,15] and wall tension[16,17]. In addition, blood vessels are constantly exposed to pulsatile arterial blood pressure. The oscillatory pattern and magnitude are indicators of development of cardiovascular diseases such as atherosclerosis[18].
A considerable number of studies have investigated effects of hemodynamic parameters on blood flow and development of arterial diseases[22]. These investigations are mainly divided in two categories: numerical and computational modeling and Experimental investigations[23]. Due to the experimental limitations, many studies have used computational modeling to simulate blood flow under different hemodynamic conditions[18].
A number of experimental setups have been developed during the past recent years. Most of these experiments have studied velocity profiles in different scales of stenosis without consideration of wall elasticity[24,25]. Other proposed setups provide the ability of studying both velocity profile and the magnitude of pressure, along with coupling the numerical models with fluid-structure interaction (FSI) analysis to consider the effect of wall elasticity. However, the scope of this field has not been extended to simulation of pulsatile flow[26].
In this research, we present a new experimental system which is specially designed and developed to produce original pulsatile blood flow and to detect and measure arterial blood pressure and pressure gradient waves for differing hemodynamic and geometric parameters, including fluid viscosity, wall stiffness, wall dimension and luminal stenosis. Since this setup is capable of performing under varying viscosity of working fluid along with differing wall stiffness, the resultant data can be used in FSI modeling of circulating fluid with pulsatile flow. With respect to the described characteristics, the proposed experimental setup provides a useful mean to study the hemodynamic parameters, in normal and stenotic conditions.
MATERIALS AND METHODS
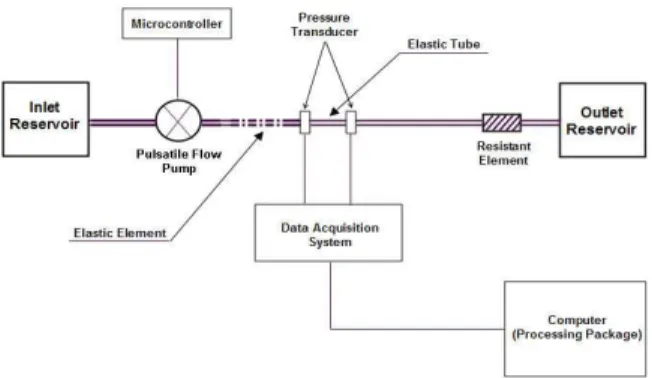
A schematic representation of the designed setup is presented in Fig. 1. The system consists of three major components: Fluidal pivot and fittings, programmable pulsatile flow pump and data acquisition and processing system.
Fluidal pivot and fittings: To study effects of wall elasticity on flow patterns, an elastic tube with defined stiffness modulus is used. For biological applications, medical grade silicon tubes are used with differing dimensions and mechanical properties. The dimensions and mechanical properties are chosen to comply with arterial characteristics[23]. In this study, a silicon tube (D-34209, B.Braun Infusomat®, Switzerland) is used similar to dimensions and elasticity of brachial artery[27], as presented in Table 1.
Fig. 1: Schematic representation of the experimental setup
Table 1: Characteristics of the elastic tube.
Inside Diameter* Length* Thickness* Elastic Modulus**
(mm) (mm) (mm) (KPa)
4.7 105 0.9 560
* The dimensions aremeasured at zero stress condition ** At 0 to 10% of strain
Elastic properties of the tube are measured using a tensile test unit (HCT 25/400, Zwick-Roell, Germany). After evaluation of non-linear load-displacement curve, the stress-strain relationship is calculated based on dimensions of tube under test and large deformation theory. The elastic modulus is chosen as the slope of the curve in the strain range applied in this study, i.e. 0-10% complied with arterial strain pulse. The stiffness modulus of the tube is considered as the slope of the curve in 0-10% strain range (Fig. 2).
The elastic tube is assembled in the set up as shown in Fig. 3. In cardiovascular system the coupling of the heart with arterial tree is of great importance. The highly distensible aortic root and ascending aorta play an essential role in this coupling. Such effect is described in Windkessel model as the elastic [28]. To simulate such effect an elastic element is placed before the elastic tube as described in schematic diagram of Fig. 1.
After the elastic tube, the remaining part of the set up contains an assembly of tubes. Such assembly is designed with a resistance to flow equivalent to total peripheral resistance of the typical human circulation. Such resistance is designed to vary for simulation of different hemodynamic situations. The elastic element shown in Fig. 1 stands for the elastic property of aorta and the resisting element in the setup represents the existing hemodynamic peripheral resistance of human circulation.
a
b
b
Fig. 2: The stress-strain curve of the silicone elastic tube: a) overall curve, b) curve within the 0-10% of strain interval
Elastic tube Pressure Transducer
Fig. 3: Assembly of elastic tube and pressure transducers within the setup
-50 to 300 mmHg and sensitivity of ±1 mmHg, to measure and detect pressure waves at both ends of the elastic tube. The assembly of transducers enables detection and measurement of pressure gradient wave. The pressure gradient wave is measured by subtracting the outlet (P2) and inlet (P1) pressures measured by pressure transducers simultaneously. Figure 3 shows assembly of pressure transducers.
Programmable pulsatile flow pump: A specifically designed pulsatile pump is manufactured to generate pulsatile flow in a wide range of physiological applications. The device comprises mechanical and electrical units. The mechanical unit is composed of four components: A servo-motor, a planetary gearbox, a ball screw and a cylinder tank. The servo-motor (MDFKS 056-23 190, LENZE, Germany) is connected to the ball screw (SFI2005, COMTOP, Taiwan) by a planetary gearbox (MPRN 01, VOGEL, Germany), making the screw to rotate in clockwise or anti-clockwise directions. The ball is placed inside the piston head and therefore, rotation of screw makes the piston to slide forward or backward within the cylinder
Servo-Motor Gearbox
Ball-Screw Piston
Fig 4: Schematic view of the pump and its mechanical sections
tank. The gearbox eliminates any probable loosening between the rotating shaft of the motor and the screw[28]. Figure 4 shows a schematic representation of the pump components.
The piston exerts force to the working fluid inside the filled cylindrical tank and pushes it to flow out of the tank towards the circuit. The ejection of working fluid out of tank is proportional to the moving pattern of the piston. This implies that by a pulsatile movement of the piston, a pulstaile flow pattern is generated[29].
The electronic unit of the pump contains a microcontroller which controls the rotational pattern and speed of the servo-motor[28]. The programmable microcontroller (ATMega128, Atmel AVR®, USA) is programmed by a designed code in C programming language to produce the desired arterial flow pattern. Because of the frequency response of the servo-motor and the sampling time of the microcontroller, there are no limitations for this pump to produce original pulsatile flow pulse of the arteries in body[29].
Pressure gradient w ave 2
P Wave 1 P W ave
Fig. 5: The result window
(ML117 BP Amp, ADINSTRUMENTS™, Australia), for amplification of output signals of the pressure transducers before being processed. The amplifiers are connected to the main data processing unit (Powerlab/4SP, ADINSTRUMENTS, Australia) by MLAC05 cables. This unit is a hardware connected to a computer processing the amplified output signals of the two transducers. The processed data are being converted to numerical graphs by the 'Chart for Windows™ v5.0.1' software. The software is set to display the graph of three waves (P1,P2 and ∆P)
simultaneously. The output window showing the results of measurement and pressure gradient wave is shown in Fig. 5.
Experimental protocol: The elastic tube and pressure transducers are assembled, as represented in Fig. 1. The inlet reservoir is filled with the working fluid. The transducers and connected tubes are discharged of any remaining bubbles.
The transducers are discharged while the setup is working and the working fluid is running within the circuit. When the working fluid reaches the transducer, the discharge valve is open, making the fluid within the transducer flow outwards and the remaining air bubbles come out of the transducer. After discharging, the pump is stopped and ready for final calibration.
Because of the effect of electronical hysteresis on the measuring units (transducers and the processing unit), the initial values of pressures displayed are not a zero value and therefore calibration is required. This is performed through the 'Chart for Windows™ v5.0.1' software. After the calibration is done, the system is ready to run and recording the results. The overall view of the experimental setup is shown in Fig. 6.
Three sets of experiments are performed. In the first set, the setup runs with a viscosity of working fluid of 1 cP to simulate the physiological conditions of arterial blood flow in body. In the second set, the
Fig. 6: Overall view of experimental setup
Fig. 7: The flow pattern of brachial artery[30]
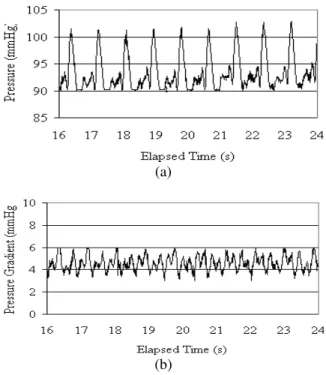
Table 2: Mechanical characteristics of sets of experiments
Elastic modulus of
Experiment tube wall (MPa) Fluid viscosity (cP)
1 0.56 1 cP
2 0.56 16 cP
3 120000 16 cP
viscosity is elevated to 16 cP to study effects of fluid viscosity. The third set includes use of a rigid tube with the same dimensions to investigate effects of wall elasticity. Table 2 presents the characteristics of each experiment.
The input flow rate of all experiments is set as the physiological pulsatile flow of the brachial artery (Fig. 7) as reported by available data[29].
RESULTS AND DISSCUSION
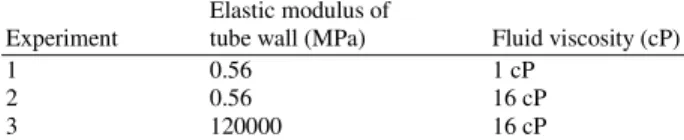
Figure 8 shows the average values of recorded pressure (P1) and pressure gradient waves of the first set
of experiments.
The pressure wave ranges from 78 mmHg to 121 mmHg, with a pressure gradient wave oscillating between 1 to 4 mmHg (Table 3). These data Comply with brachial blood flow characteristics[27,30].
Figure 9 shows results of effect of change in viscosity on pressure and pressure gradient pulses. By elevation of viscosity to 16 cP the fluctuation of P1
(a)
(b)
Fig. 8: Resultant pressure wave (a) and pressure gradient wave (b) for experiments with viscosity of 1 cP and wall elasticity of 0.56 MPa
(a)
(b)
Fig. 9: The pressure wave (a) and pressure gradient wave (b) for viscosity of 16 cP and wall elasticity of 0.56 MPa
(a)
(b)
Fig 10: The pressure wave (a) and pressure gradient wave (b) in experiment No. 2
Table 3: Results of the three sets of experiments.
Pressure (P1) pulse Pressure gradient pulse
Experiment MmHg mmHg
1 78-121 1-4
2 90-104 11-16
3 90-104 3-6
The third set of experiments is conducted to study effect of wall stiffness on pressure and pressure gradient waves Fig. 10. Results show that by stiffening wall to the stiffness of a rigid tube, the P1 wave remains
unchanged, with its systolic and diastolic values being 104 and 90 mmHg respectively. The mean value of pressure gradient wave in this case is reduced to 4.5 mmHg fluctuating between 3 to 6 mmHg (Table 3).
resistance changes due to altered metabolic alterations in exercise. The precision of design and accuracy of assembly allow a better understanding of arterial hemodynamics. The resultant parameters obtained from experiments are in good agreements with published biofluid mechanical data.
Results show that by increase of fluid viscosity, the pressure drop increases. This is shown by elevated mean value of pressure gradient wave in experiments with high viscosity. This is well compatible with theoretical results of flow in cylindrical tubes. By increase of viscosity, the resistance to flow increases and a higher pressure gradient is required for maintaining constant flow. Although the mean value of the pressure gradient increases by elevation of viscosity, the amplitude of the inlet pressure pulse is reduced. While the pressure fluctuation (systole-diastole) is equal to 43 mmHg for the viscosity of 1 cP, the amplitude is reduced to 14 mmHg for the viscosity of 16 cP. Te energy dissipation due to viscous effects causes damping of the pressure fluctuation and this effect is elevated by increase of viscosity. It can be seen that elevation of viscosity leads to increased pressure drop across the tube length and decrease of pressure pulse amplitude.
Comparative results of distensible and rigid tubes show that stiffening of the tube wall causes reduced mean pressure gradient and pressure gradient amplitude for an identical fluid. Since the viscosity of the fluid is constant, the inlet pressure pulse remains constant. However, there is a less pressure drop across a rigid tube. For the distensible tube due to wall displacement, the energy dissipation due to viscous effects of the fluid and inherent visco-elasticity of the tube wall leads to a higher pressure drop.
CONCLUSION
A new experimental system is designed to analyze the pulsatile flow in elastic tubes for hemodynamic applications. The system simulates physiological arterial blood flow and results are well complied with published data.
The system is capable of studying the effects of changes in elasticity of wall and the viscosity of fluid. The results can be used in fluid-structure interaction (FSI) modeling as the input data and boundary conditions.
REFERENCES
1. Liepsch, D., 2002. An introduction to biofluid mechanics-basic models and applications. J. Biomechanics, 35: 415-435.
2. Pontrelli, G., 1998. Pulsatile blood flow in a pipe. Computers and Fluids,27: 367-380.
3. Nerem, R.M., 1992. Vascular fluid mechanics, the arterial wall and atherosclerosis. ASME. J. Biomech. Eng., 114: 274-282.
4. Friedman, M.H. et al., 1992. Effects of arterial compliance and non-newtonian rheology on correlations between intimal thickness and wall shear. ASME. J. Biomech. Eng., 114: 317-320. 5. Woottonl, D.M. and D.N. Ku, 1999. Fluid
Mechanics of Vascular Systems, Diseases and Thrombosis, Annual Rev. Biomedical Eng., 01: 299-329.
6. Hughes, P.E. and T.V. How, 1995. Flow structures at the proximal side-to-end anastomosis: Influence of geometry and flow division. J. Biomech. Eng., 117: 224-236.
7. Staalsen, N.H., M. Vlrich, J. Winther, E.M. Pederson, T. How and H. Nygaard, 1995. The anastomosis angle does change the flow fields at vascular end-to-side anastomoses in vivo. J. Vascular Surgery, 21: 460-471.
8. Dobrin, P.B., F.N. Littooy and E.D. Endean, 1989. Mechanical factors predisposing to intimal hyperplasia and medial thickening in autogenous vein grafts. Surgery, 105: 393-400.
9. White, S.S., C.K. Zarins, D.P. Giddens, H. Bassiouny, F. Loth, S.A. Jones and S. Glagov, 1993. Hemodynamic patterns in two models of end-to-side vascular graft anastomoses: Effects of pulsatility, flow division, Reynolds number and hood length. J. Biomech. Eng., 115: 104-111. 10. Delfino, A., N. Stergiopulos, J.E. Moore Jr. and
J.J. Meister, 1997. Residual strain effects on the field in a thick wall finite element model of the human carotid bifurcation. J. Biomech., 30: 777-786.
11. Bassiouny, H.S., S. White, S. Glagov, E. Choi, D.P. Giddens and C.K. Zarins, 1992. Anastomotic intimal hyperplasia: Mechanical injury or flow induced. J. Vascular Surgery, 15: 708-717.
12. Taylor, C.A., T.J.R. Hughes and C.K. Zarins, 1999. Effect of exercise on hemodynamic conditions in the abdominal aorta. J. Vascular Surgery, 29: 1077-1089.
13. Ojha, M., 1994. Wall shear stress temporal gradient and anastomotic intimal hyperplasia. Circulation Res., 74: 1227-1231.
15. Lei, M., J.P. Archie and C. Kleinstreuer, 1997. Computational design of a bypass graft that minimizes wall shear stress gradients in the region of the distal anastomosis. J. Vascular Surgery, 25: 637-646.
16. Schwartz, L.B., M.K. O’Donohoe, C.M. Purut, E.M. Mikat, P.O. Hagen and R.L. McCann, 1992. Myointimal thickening in experimental vein grafts is dependent on wall tension. J. Vascular Surgery, 15: 176-186.
17. Hofer, M., G. Rappitsch, K. Perktold, W. Turbel and H. Schima, 1996. Numerical study of wall mechanics and fluid dynamics in end-toside anastomoses and correlation to intimal hyperplasia. J. Biomech., 29: 1297-1308.
18. Chen, J. and X.Y. Lu, 2006. Numerical investigation of the non-Newtonian pulsatile blood flow in a bifurcation model with a non-planar branch. J. Biomech., 39: 818-832.
19. Niroomand Oscuii, H., M. Tafazzoli Shadpour and F. Ghalichi, 2007. Flow Characteristics in Elastic Arteries Using a Fluid-Structure Interaction Model. Am. J. Applied Sci., 4: 516-524.
20. O' Brien, T. and T. McGloughlin, 2001. The effects of wall compliance on blood flow patterns through vascular grafts. Proceedings of ASME. Bioengineering Conference.
21. Qiu, Y. and J.M. Tarbell, 2000. Numerical simulation of pulsatile flow in a compliant curved tube model of a coronary artery. J. Biomech. Eng., 122: 77-85.
22. Caro, C.G., 2001. Vascular fluid dynamics and vascular biology and disease. Math. Methods Applied Sci., 24: 1311-1324.
23. Wang, J.J. and K.H. Parker, 2004. Wave propagation in a model of the arterial circulation. J. Biomech., 37: 457-470.
24. Deplano, V. and M. Siouffi, 1999. Experimental and numerical study of pulsatile flows through stenosis: Wall shear stress analysis. J. Biomech., 32: 1081-90.
25. Tang, D., C. Yang and D.N. Ku, 1999. A 3D thin model for blood flow in carotid arteries with symmetric and asymmetric stenosis, Computers and Structures, 72: 357-377.
26. Tang, D., C. Yang, Kobayashi, Sh. and D.N. Ku, 2002. Steady flow and wall compression in stenotic arteries: A three dimentional thick-wall model with fluid-wall interactions. J. Biomech. Eng., 123: 548-557.
27. Heijden Spek, J.J., J.A. Staessen, R.H. Fagard, A.P. Hoeks, H.A. Struiker Boudier and L.M. Van Bortel, 2000. Effect of age on brachial artery wall properties differs from the aorta and is gender dependent: A population study. Hypertension, 35: 637-642.
28. Fung Y.C., 1997, Biomechanics: Circulation. 2nd Edn., Springer-Verlag New York Inc., New York, pp: 23-25.
29. Fatouraee, N., A. Pashaee and M.H. Mousavi, 2005. Design and manufacturing a programmable physiological flow pump. Proceedings of the 12th Iranian Conference on Biomedical Engineering, Tabriz, Iran.