Repeating or advancing?
An analysis of school failure in
public schools of Minas Gerais
Juliana de Lucena Ruas Riani
Foundação João Pinheiro
Vania Candida da Silva
Secretaria de Estado de Educação de Minas Gerais
Tufi Machado Soares
Universidade Federal de Juiz de Fora
Abstract
The objective of this work is to evaluate if retaining pupils of the third year of fundamental education in 2009 brought benefits to their learning in comparison to pupils that advanced to the fourth year. We seek thereby to contribute to the debate about the impact of school failure in pupils’ learning. In Brazil, due to the absence of longitudinal data that would allow a more accurate comparison between those pupils who failed and those that advanced, considering their performance before and after the school failure, the majority of studies focus primarily on the impact of the policies of cycles on the performance of the pupil. Using data from the Literacy Assessment Program (an external assessment conducted every year in public schools of the State of Minas Gerais), it was possible to set up a longitudinal database to identify pupils that had repeated and those who had not. To try to explain the performance of students who had failed and those who had not, we tried to use as a guiding line the approach based on the Educational Production Function, having as a methodological basis the hierarchical models. The results indicate that both categories of students – those who had failed and those who had not – displayed very important growth in proficiency average rates. However, the hierarchical models constructed demonstrated that, between two pupils with the same proficiency in 2008, one of them having failed and the other not, the pupil that did not fail tended to present the better proficiency level in 2009. Another important finding refers to the fact that the result of the pupil is very much influenced by the general result of the school.
Keywords
School failure – Performance – Hierarchical models.
Contact:
Repetir ou progredir?
Uma análise da repetência nas escolas
públicas de Minas Gerais
Juliana de Lucena Ruas Riani
Fundação João Pinheiro
Vania Candida da Silva
Secretaria de Estado de Educação de Minas Gerias
Tufi Machado Soares
Universidade Federal de Juiz de Fora
Resumo
O objetivo deste trabalho é avaliar se a retenção dos alunos do 3º ano do ensino fundamental em 2009 trouxe maiores benefícios no aprendizado de tais alunos em relação àqueles que progrediram para o 4º ano. Procura-se, dessa forma, contribuir para o debate sobre o impacto da repetência no aprendizado do aluno. No Brasil, devido à carência de dados longitudinais que possibilitem uma comparação mais apurada entre os repetentes e os promovidos, considerando seus desempenhos antes e depois do evento da repetência, a maio-ria dos estudos enfoca principalmente o impacto das políticas de ciclos no desempenho do aluno. Por meio dos dados do Programa de Avaliação da Alfabetização (avaliação externa realizada anualmen-te nas escolas públicas de Minas Gerais), foi possível constituir uma base de dados longidudinal que identificasse os alunos repetentes e os não repetentes. Para tentar explicar o desempenho dos alunos repetentes e não repetentes, utilizou-se como marco norteador a abordagem da Função de Produção Educacional e como base meto-dológica, os modelos hierárquicos. Os resultados indicam que tanto os alunos que repetiram quanto os que não repetiram apresentaram crescimentos bastante importantes nas médias de proficiência. No entanto, os modelos hierárquicos construídos demonstram que, den-tre dois alunos com mesma proficiência em 2008, tendo um deles repetido e o outro não, aquele que não repetiu tende a apresen-tar maior nível de proficiência em 2009. Outro achado importante refere-se ao fato de que o resultado do aluno é muito influenciado pelo resultado geral da escola.
Palavras-chave
Repetência – Desempenho – Modelos hierárquicos.
Correspondência:
The debate about failing a student when he or she does not display the necessary abilities to carry on with his or her studies has still to reach a consensus. The defenders of non-failing argue that, in addition to the fact that failing a student does not guarantee better learning, it is detrimental to the student in behavioral and emotional terms (JIMERSON et al., 1997). However, it has been emphasized that there are studies showing that school failure causes less emotional damage when it happens at the initial series of school (MEISELS; LIAW, 1993). Besides, retaining pupils can be an important factor to school dropout.
The studies that point to the positive effect of school failure argue that it is beneficial to the pupils that show abilities and emotional development inadequate to their age (ALEXANDER et al., 1999). Still, it is beneficial only when conducted in a correct, objective way, that is to say, when it really selects the students with underdeveloped abilities.
Despite all the controversy about the efficiency of school failure in pupils’ learning,
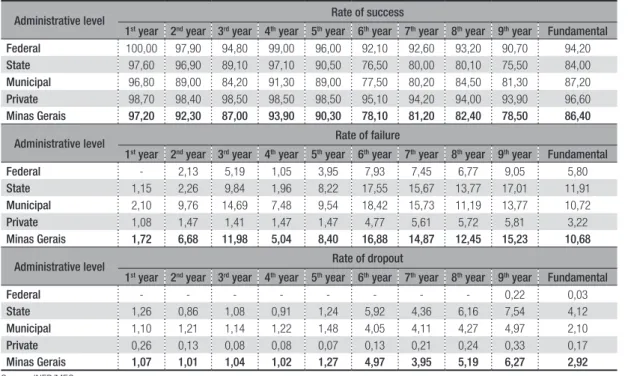
the truth is that schools is still fail their pupils. The data in Table 1 shows the performance rates (success, failure and dropout) of fundamental education in Minas Gerais in 2008. It can be seen that rates of failure are higher towards the final years of fundamental education. At the initial series, it is to be noted the high rate of failure of the 3rd year in the state and municipal
networks, respectively 9.84% and 14.69%. In the case of the state school system, the organization of the initial series of fundamental education (1st to 5th years) may
be inducing a higher failure rate at the 3rd
year. The initial years are comprised of two literacy cycles. The first cycle (Initial Literacy Cycle) lasts for three years, and the second (Complementary Literacy Cycle) lasts for two years. In each cycle there is continued promotion, in which pupils displaying inadequate learning are not failed, being instead supported by pedagogical strategies of special care to guarantee the continuity of the learning process.
Table 1 – Performance rates in fundamental education by administrative level and year of schooling (Minas Gerais, 2008)
Administrative level Rate of success
1st year 2nd year 3rd year 4th year 5th year 6th year 7th year 8th year 9th year Fundamental
Federal 100,00 97,90 94,80 99,00 96,00 92,10 92,60 93,20 90,70 94,20
State 97,60 96,90 89,10 97,10 90,50 76,50 80,00 80,10 75,50 84,00
Municipal 96,80 89,00 84,20 91,30 89,00 77,50 80,20 84,50 81,30 87,20
Private 98,70 98,40 98,50 98,50 98,50 95,10 94,20 94,00 93,90 96,60
Minas Gerais 97,20 92,30 87,00 93,90 90,30 78,10 81,20 82,40 78,50 86,40
Administrative level Rate of failure
1st year 2nd year 3rd year 4th year 5th year 6th year 7th year 8th year 9th year Fundamental
Federal - 2,13 5,19 1,05 3,95 7,93 7,45 6,77 9,05 5,80
State 1,15 2,26 9,84 1,96 8,22 17,55 15,67 13,77 17,01 11,91
Municipal 2,10 9,76 14,69 7,48 9,54 18,42 15,73 11,19 13,77 10,72
Private 1,08 1,47 1,41 1,47 1,47 4,77 5,61 5,72 5,81 3,22
Minas Gerais 1,72 6,68 11,98 5,04 8,40 16,88 14,87 12,45 15,23 10,68
Administrative level Rate of dropout
1st year 2nd year 3rd year 4th year 5th year 6th year 7th year 8th year 9th year Fundamental
Federal - - - 0,22 0,03
State 1,26 0,86 1,08 0,91 1,24 5,92 4,36 6,16 7,54 4,12
Municipal 1,10 1,21 1,14 1,22 1,48 4,05 4,11 4,27 4,97 2,10
Private 0,26 0,13 0,08 0,08 0,07 0,13 0,21 0,24 0,33 0,17
Minas Gerais 1,07 1,01 1,04 1,02 1,27 4,97 3,95 5,19 6,27 2,92
With respect to the municipal systems, each municipality has autonomy to organize its school system, as long as it follows the LDB (the Law of Guidelines and Bases), thereby creating a diversity of situations regarding the number and duration of cycles. At the final years of fundamental education the higher rates of failure occur between the 6th and 9th years. At this stage
of teaching, in the state system, partial promotion is adopted. This is a regime that allows the pupil that does not display satisfactory performance
in up to two disciplines to move forward within the same level of education. It is then up to the school to promote recovery strategies for these disciplines.
Table 2 presents the performance rates in secondary education in Minas Gerais for the year 2008. It can be seen that, at this level of education, school failure and dropout are higher than at fundamental education. It is also observed that both school failure and dropout are higher at the first years of secondary education.
Table 2 – performance rates in secondary education by administrative level and year of schooling (Minas Gerais, 2008)
Administrative level
Rate of success
1st year 2nd year 3rd year Secondary education
State 69,6 77,0 80,3 74,9
Federal 75,4 85,4 93,3 82,8
Municipal 64,6 74,1 81,3 72,9
Private 89,0 93,8 96,5 93,0
Total 71,4 78,8 82,4 76,9
Administrative level
Rate of failure
1st year 2nd year 3rd year Secondary education
State 15,6 10,8 10,1 12,5
Federal 22,0 13,7 6,4 15,7
Municipal 24,9 17,6 13,7 19,0
Private 10,4 5,8 3,2 6,6
Total 15,4 10,5 9,3 12,1
Administrative level
Rate of dropout
1st year 2nd year 3rd year Secondary education
State 14,8 12,2 9,6 12,5
Federal 2,7 0,9 0,4 1,5
Municipal 10,5 8,3 5,0 8,1
Private 0,6 0,4 0,3 0,4
Total 13,2 10,7 8,2 11,0
Source: INEP/MEC
Graph 1 shows the enrolment per year of schooling at fundamental and secondary education in Minas Gerais in 2008. It can be seen that the high rates of school failure
between the 3rd and 6th grades of fundamental
education and at the 1st grade of secondary
Graph 1 – Enrolment per year of schooling (Minas Gerais, 2008)
build up a longitudinal database identifying failing and non-failing pupils. In doing so, the objective of the present work is to analyze the impact of school failure to the learning of pupils from public schools of Minas Gerais.
The article is structured in five sections, including this introduction. In the next section, a brief survey of some of the studies that analyze the impact of school failure in Brazil we will be conducted. In the third section we shall make comments about the database used here. In the fourth section, the results of the analysis of the impact of failing and non-failing pupils upon the proficiency in the Proalfa will be discussed. Lastly, conclusions will be drawn.
Evidences of the impact of school failure in Brazil
In Brazil, as already commented above, due mainly to the limitation of data, the majority of studies do not focus on the 3rd year SE
2nd year SE 1st year SE 9th year FE 8th year FE 7th year FE 6th year FE 5th year FE 4th year FE 3rd year FE 2nd year FE 1st year FE
Enrolment
0 50.000 100.000 150.000 200.000 250.000 300.000 350.000 400.000 450.000
Year of sc
hooling
Source: INEP/MEC
The data above make it clear that schools are still failing their pupils. Therefore, the debate about the impact of school failure to the learning of pupils is still far from over. In Brazil, however, most studies focus primarily on the impact of the policies of cycles on the performance of the pupil. This happens mainly due to the lack of longitudinal data that would allow a more careful comparison between failing and non-failing students, taking into account their performance before and after the occurrence of failure.
Using data from the Proalfa – Literacy Assessment Program, which is an external assessment conducted yearly in the public schools of Minas Gerais1, it was possible to
i
mpact of school failure to the learning, but on the impact of the policy of cycles upon the performance of pupils. Within this context, Ferrão, Beltrão and Santos (2002) analyze the impact of non-failing policies (automatic promotion) on the school performance of pupils from the 4th grade of fundamental education inSão Paulo and Minas Gerais. The authors apply hierarchical models to the data from SAEB and from the 1999 School Census considering, at a first level, the variables related to pupils and, on the second level, the variables related to the school. In order to analyze the impact of the non-failing policy, they used the existence in schools of policies automatic promotion. Apart from school failure, they also analyze the impact of the age-series distortion upon the performance of pupils.
Their results indicate that there is no statistically significant difference between the performance of pupils in public schools with and without automatic promotion. On the other hand, delayed pupils display diminished proficiency when compared to pupils at the expected grade for their age. Therefore, the authors conclude that the regime of automatic promotion can contribute to correct the age-series gap without loss of quality in education.
Gomes-Neto and Hanushek (1996) make use of the database of the EDURURAL project, conducted with rural schools in the states of Ceará, Pernambuco and Piauí between 1981 and 1985 to investigate the causes and effects of school failure through a cross-section analysis. Their studies offer two important results. Firstly, there is an important effect of the proficiency of pupils in standardized tests (mathematics and Portuguese language) upon the probability of a pupil failing, that is to say, the lower their scores in Portuguese language and mathematics, the higher the probability of failure. Secondly, the authors found a positive effect of failure upon the proficiency of the pupil. Their results show that, after controlling for individual and family characteristics, students that repeat a grade perform worse
than the other students before the failure; however, after failing, they show above-average performance.
It should be noted that the works mentioned above share an important limitation: the lack of longitudinal data. Thus, the fact of school failure may be contaminated by other factors not present in the analysis. Overcoming this limitation, Luz (2008) employed a longitudinal database to analyze the impact of school failure on the school proficiency of pupils. The author worked with the database of the Fatores Associados ao Desempenho Escolar research (Factors Associated to School Performance) (INEP/ MEC), which included public schools from the metropolitan areas around the capitals of the state of Pará, Rondônia, Sergipe, Pernambuco and Mato Grosso do Sul. The study collected data from pupils in the 4th grade of fundamental
education in 1999 up to the 8th grade in 2003.
At the last year of the research, data were also collected from pupils that were at the 7th grade,
which made possible to identify those that had failed the 7th grade from those that progressed
to the 8th grade in 2003. The comparison of
school results between failing and non-failing pupils was carried out through the matching of pupils based on the propensity score technique2. With this method it was possible
to define the treatment group (failing pupils) and the control group (promoted pupils), minimizing the differences in the composition of these two groups as to the individual, school, and community characteristics.
Luz (2008) found evidences that the gain to pupils’ from failing is small and inferior to the gain to promoted pupils under the same conditions. Besides, failing pupils display performance similar to that of new pupils of the same grade.
The Proalfa database
The Proalfa is an annual assessment that began in 2005, and it consists of four evaluations. Two of them involve sampling and are applied in the 2nd and 4th years
of fundamental education. The censual evaluations are applied in the 3rd year of
fundamental education and on pupils that in the previous year were on the 3rd year and
displayed low performance, that is, reached proficiency below 450. Chart 1 summarizes the evaluations of the Proalfa program. The censual evaluations are nominal and allow the identification of the level at which each pupil is; therefore, they allow intervening in the learning in a localized and individualized way.
In order to gauge the performance of pupils the assessment employed the same methodology applied in the Ministry of Education exams (SAEB and Prova Brasil), and in the Public Basic Education System Assessment Program –PROEB (carried out by the Minas Gerais State Secretariat for Education –SEEMG), which is based on Item Response Theory (IRT). However, its scale of proficiency is not in the same metric as being those evaluations. The Proalfa scale goes from 0 to 1000, and contains the performance results of the three school years evaluated distributed in the same metric. This scale presents in a growing and continuous way the abilities that are already consolidated and those that are still under development. Apart from the average proficiency, the results are also given by levels of proficiency: low, intermediate, and recommended.
Chart 1 – Summary of Proalfa evaluations
2nd year of fundamental
education
3rd year of fundamental
education
4th year of fundamental
education Low performance students
Sampling Censual Sampling Censual
Objective: To assess acquired knowledge in reading and writing after one year of schooling.
Objective: To assess acquired knowledge in reading and writing after two years of schooling.
Objective: To assess acquired knowledge in reading and writing after three years of schooling.
Objective: To assess if pupils with literacy levels below the expected in the 3rd year have improved.
Source: SEE/Boletim Pedagógico – Proalfa 2007.
The assessment of pupils with low performance was applied to all pupils that were in the 3rd grade in the previous year and which
displayed unsatisfactory results (below 450), regardless of the school grade which they attend in the current year. It is observed that the majority of these pupils were promoted to the 4th grade;
however, some of them were retained in the 3rd
grade of fundamental education. The children that were retained in the 3rd grade did both the
low-performance exam and the 3rd grade exam.
In this way, joining the databases from these two assessments (low-performance and 3rd grade), it was possible to identify pupils that
in 2008 displayed inadequate proficiency and failed the 3rd grade in 2009, in other words,
studies, and in some cases it is necessary to be careful about the possibility that the selection bias of the sampling may affect the results. In the present study, in particular, which compares the evolution in proficiency of the group of failing and non-failing pupils, it is not expected a priori that one will find different behavior between failing pupils that remained in the same school and the failing pupils that changed schools; on the other hand, pupils that abandoned the school system must have had their future proficiency compromised even further. Thus, it is not expected that the loss, albeit considerable, will affect significantly the conclusions of this study.
From a total of 41,635 pupils that took part in the low-performance assessment – hen-ceforth denominated LP Exam – in 2009, 5483 pupils were on the 3rd grade of fundamental
education; they were, therefore, pupils regarded as failing. The remaining pupils on the 4th grade
of fundamental education are the non-failing. The comparative analysis of the perfor-mance of failing and non-failing pupils allows inspecting to what extent retaining pupils in the 3rd grade guaranteed better learning with respect
to pupils that were promoted to the 4th grade.
Table 3 – Pupils taking part in Proalfa (LP Exam, 2009)
Pupil situation in 2009
School system
State Municipal Public
Total 11.807 29.828 41.635
Non-failing 10.394 25.758 36.152
Failing 1.413 4.070 5.483
Source: Proalfa/SIMAVE, 2009.
Analysis of failing and non-failing pupils
Table 4 shows a comparison of the results of the LP Exam in 2009 between failing pupils and those who were promoted to the 4th grade.
The average proficiency of pupils promoted in 2008 is significantly higher than that of failing pupils, both in the state and in the municipal school systems. However, despite the fact that the proficiency of failing students is lower than the proficiency of non-failing pupils, it cannot be said that the policy of retaining pupils generates negative results. To reach such a conclusion, a more accurate analysis of these pupils is necessary.
Table 4 – Pupils performing the LP Exam 2009 (State and municipal school systems)
Pupil situation in 2009 Proficiency Low Intermediate Recommended Number of
pupils
State school system
Overall 507.97 47.46% 34.62% 17.92% 11,807
Non-failing 511.96 45.86% 35.29% 18.85% 10,394
Failing 478.65 59.24% 29.65% 11.11% 1,413
Municipal school system
Overall 478.66 61.98% 29.18% 8.85% 29,828
Non-failing 481.76 60.44% 30.41% 9.14% 25,758
Failing 459.03 71.67% 21.35% 6.98% 4,070
Source: Proalfa/SIMAVE, 2009.
It was possible to identify part of the failing and non-failing pupils in the Proalfa assessment at the 3rd year in 2008, thereby
identifying their proficiency at the time. The
Table 5 – Proficiency in Proalfa, 2008 (3rd grade of fundamental education)
Pupil situation in 2009 State Municipal
Proficiency Pupils Proficiency Pupils
Overall 396.50 10,480 393.23 26,526
Non-failing 398.44 9,169 395.88 22,746
Failing 382.95 1,311 377.31 3,780
Source: Proalfa/SIMAVE, 2008.
Table 6 shows the proficiencies of failing pupils in the 3rd year assessment and in the LP
Exam applied in 2009 at the state and municipal school systems. In the state school system, it can be seen that the performance of these pupils in the LP Exam (478.65) is below that of the 3rd year
assessment (489.21), with more than half of the pupils (59.2%) still within the low performance bracket in this assessment. The same result can be observed for the municipal school system. In the state school system, the average
proficiency at Proalfa in 2008 of those who failed the year was 382.95 (Table 5). By repeating the exam of the 3rd year in 2009, the
average proficiency reached by these pupils was 489.21 (Table 6), that is, it increased by 27.75% (Table 7). In the municipal school system, failing students showed an increase of 23.96% between the assessment in the 3rd year in 2008
and that of the 3rd year in 2009.
Table 6 – Proficiency of failing pupils in the assessment conducted in 2009 (State and municipal school systems)
Assessment Proficiency Low Intermediate Recommended Number of pupils
State school system
Third year Exam 489.21 29.65% 27.18% 43.17% 1,413
LP Exam 478.65 59.24% 29.65% 11.11% 1,413
Municipal school system
Third year Exam 467.72 39.53% 28.97% 31.50% 4,070
LP exam 459.03 71.67% 21.35% 6.98% 4,070
Source: Proalfa/SIMAVE, 2009.
When comparing the growth in proficiency in the 3rd year Proalfa in 2008 with the proficiency
in the LP Exam in 2009 (Table 7), it is observed that for the state school system the non-failing
pupils showed higher growth (28.49%) than the failing pupils (24.99%). For the municipal school system, the difference between failing and non-failing pupils was not significant.
Table 7 – Percentage variation in the proficiency of failing and non-failing pupils between 2008 and 2009 by school system
Pupil situation in 2009
Variation Variation
Third year Exam 2008/third year Exam 2009 Third year Exam 2008/LP exam 2009
State Municipal State Municipal
Overall - - 28.11 21.72
Non-failing - - 28.49 21.69
Failing 27.75 23.96 24.99 21.66
In the Proalfa exams, pupil also inform their current age, the age at which they enrolled at school, how many times they have failed a school year, and whether or not they attended preschool or daycare centers. Table 8 displays the descriptive analysis of these variables according to the failing or non-failing situation. The most significant points are: i) there are more male pupils in both categories, but boys are more representative among the failing pupils; several studies show that men are more likely to fail the school year then women (GOMES-NETO; HANUSHEK, 1996; RIANI, 2005; MEISELS; LIAW, 1993); ii) most pupils did not attend preschool and the percentage distribution of this variable is similar among failing and non-failing pupils; iii) the percentage distribution of age is similar between the two categories and concentrates around the ages of 9 and 10, as expected; iv) the same behavior is observed with respect to the age at which pupils enrolled at school, and the ages with higher concentration are 5, 6, and 7; v) as expected, the number of times that pupils failed a year is the variable that shows a marked difference between failing and non-failing pupils. In the case of non-failing pupils, there is a higher concentration of pupils who failed once or twice; among the non-failing, the majority never failed a year.
It is worth pointing out that these questions are answered by the pupils themselves which, in their majority, are less than 10 years old, which results in a significant fraction of missing cases, and of inconsistent answers. In the first case, the missing data do not differ significantly between failing and non-failing pupils. With respect to inconsistent answers, the bigger problems occur in the how many times you have failed item, in which 8.26% of failing pupils answer that they have never failed, and in the age item, in which children with lasting eight years of age occasionally show up in the answers.
Table 8 – Distribution of frequency of individual variables of
failing and non-failing pupils (Proalfa, 2009)
Individual variables Failing Non-failing
Absolute % Absolute %
Gender
Male 3,129 57.07 18,602 51.45
Female 1,603 29.24 12,971 35.88
Missing 751 13.70 4,579 12.67
Attended preschool
Yes 1,243 22.67 7,628 21.10
No 2,796 50.99 18,431 50.98
Missing 1,444 26.34 10,093 27.92
How man
y times ha
ve
failed
None 453 8.26 17,140 47.41
Once 2,786 50.81 6,819 18.86
Tries 929 16.94 3,106 8.59
3 or more times 232 4.23 1,030 2.85
Missing 1,083 19.75 8,057 22.29
Age
6 2 0.04 40 0.11
7 6 0.11 30 0.08
8 136 2.48 1,072 2.97
9 2,513 45.83 16,839 46.58
10 1,261 23.00 7,884 21.81
11 394 7.19 2,487 6.88
12 or older 277 5.05 1,958 5.42
Missing 894 16.30 5,842 16.16
Age a
t which enrolled a
t
school
Younger than 5 174 3.17 1,628 4.50
5 605 11.03 4,367 12.08
6 2,603 47,47 16,268 45,00
7 760 13,86 4,538 12,55
8 or older 88 1,60 647 1,79
Missing 1,253 22,85 8,704 24,08
Source: Proalfa/SIMAVE, 2009.
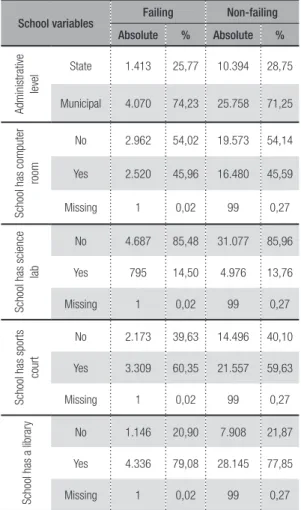
Table 9 – Distribution of frequency of school variables among failing and non-failing pupils (Proalfa, 2009)
School variables Failing Non-failing
Absolute % Absolute %
Administra
tive
level
State 1.413 25,77 10.394 28,75
Municipal 4.070 74,23 25.758 71,25
School has computer
room
No 2.962 54,02 19.573 54,14
Yes 2.520 45,96 16.480 45,59
Missing 1 0,02 99 0,27
School has science
la
b
No 4.687 85,48 31.077 85,96
Yes 795 14,50 4.976 13,76
Missing 1 0,02 99 0,27
School has sports
court
No 2.173 39,63 14.496 40,10
Yes 3.309 60,35 21.557 59,63
Missing 1 0,02 99 0,27
School has a librar
y
No 1.146 20,90 7.908 21,87
Yes 4.336 79,08 28.145 77,85
Missing 1 0,02 99 0,27
Source: Proalfa/SIMAVE, 2009 and School Senses – INEP/MEC
Another important School variable is the average proficiency of the school in which the pupil is studying. In Table 10 it can be seen that, generally speaking, non-failing pupils attend schools with an average proficiency slightly higher than that of the schools which failing pupils attend.
Table 10 – Average proficiency at the 3rd grade according to
the failure situation of the pupils (Proalfa, 2009)
Situation of pupil in 2009 Average Standard deviation
Failing 506.29 46.7606
Non-failing 509.03 50.8937
Source: Proalfa/SIMAVE, 2009.
In attempting to explain the performance of failing and non-failing pupils, we have used as a guiding line the Educational Production Function (EPF) approach, and as a methodological basis the hierarchical models. The EPF is a branch of the literature that draws an analogy between the human process of acquiring knowledge and the productive process, guiding the choice of variables and a coherent interpretation of their effects (TODD; WOLPIN, 2003). The educational result of the child is a consequence of a production process in which present and past inputs are combined with the genetic characteristics of the individuals to produce cognitive result.
EPF can be described in the following way:
A
it= f(F
i t
, S
t
, O
t, e
t),
where: At is educational result of individual i cumulative in time t; Ft is the vector of characteristics e family background of the pupil cumulative in time t; St is to vector of school and teacher inputs, cumulative in time t; Ot is the vector of other relevant inputs, such as community and class factors, cumulative in time t; and et is the random error term that reflects non-measured factors that contribute to the educational result at time t. If the non-included factors are not correlated with those that entered the analysis there is no problem, since the estimated parameters will be unbiased. On the other hand, if they are correlated, the coefficients of the analysis will be biased (HANUSHEK, 2002).
Therefore, the ideal in estimating the EPF is to have family and school inputs, past and present, as well as information about the cognitive ability of the child. Most of the times, however, such data are not available. To overcome these problems, we resort to proxy assumptions and/or variables.
1) The contemporary specification model: considers that the performance of the pupil is associated only to contemporary measures. In this modeling, it is assumed that the inputs do not vary in time and that the current inputs are not related to the mental ability to acquire knowledge. 2) The model of specification of added value: relates the current performance of pupils with contemporary family and educational inputs, and with the pupil performance in the previous period. This last term is sufficient to capture the non-observed variables of past input and the mental ability to acquire knowledge (TODD; WOLPIN, 2003).
The Proalfa database allows estimating the educational determinants through the specification of added value, since it is possible to obtain the proficiency of the same pupil in two different periods of time (2008 and 2009). Due to the hierarchical structure of the data, that is, to the fact that pupils are collected in schools, the EPF was estimated using the two tier hierarchical model, in which the first level considers the individual and the second one the school3.
Hierarchical models incorporate the hierarchical structure of data, assuming that the dependent variable is measured at the lowest level of aggregation, with the independent variables measured at all other levels (HOX, 1995)4.
Two hierarchical models were built to estimate the equation of the model for the
3 - The estimate through hierarchical models allows better estimators than those obtained through classic regression models, since it deals with the failure of an important assumption of the models estimated through Ordinary Least Squares, which is that of independent and identically distributed errors occurring due to the dependence that individuals have inside one same unit (in this case, the school). Besides, such models resolve the problem of the unit of analysis when there are independent variables measured at distinct levels of aggregation.
4 - They consider that the intercept and or inclination are the same for all units of level 2, and that the variation can happen by the effect of some explicative variable of level 2 and/or by a random component. In the present article, we have considered that only the intercept has a random effect. For more details about hierarchical models, see Bryk and Raudenbush (2002).
added value in the EPF, always with the main interest in determining the positive or negative impact of school failure.
In the first model, the proficiency in 2009 of a pupil was estimated considering just two explicative variables at the first level: one categorical variable that identifies that the pupil failed the 3rd grade in 2009 (zero for the
non-failing pupils and one for the failing pupils), and the performance of the pupils in the 3rd grade
exam of 2008. As commented above, this last variable will capture the effect of non-observed variables, such as the socioeconomic level of the pupil and their mental ability to acquire knowledge. The second model incorporates other explicative variables of level 1, such as the number of times the pupil has failed a grade and the gender of the pupil. It should be noted that the Proalfa database has few variables related to the pupil, as seen in the previous section; among these variables, only those that turned out to be significant were included. Also included in this model, at level 2, is the average proficiency of the 3rd grade in which the pupil
was studying in 2009. The other variables related to the school (administrative level and school infrastructure) were not significant and, therefore, were not considered in the analysis.
Table 11 shows the results of these models. From the analysis of the random effect in both models it can be seen that the hypothesis that the intercept is considered as having a random effect is acceptable, since it was significant. In addition to that, the school plays an important part in explaining the variation in the performance of pupils. This is an important fact, for it shows the importance of the school in the life of the pupils.
In model 1, it can be observed that pupil that failed the 3rd grade in 2009 has a
proficiency level 16.419 lower than a pupil that did not fail. The previous proficiency of the pupil has a positive impact, albeit small.
is higher than that of the previous proficiency of the pupil. The inclusion of this variable decreases the unexplained variation between schools, although there is still a significant part to be justified. The inclusion of a variable representing the average socioeconomic level of the schools would probably reduce the unexplained variation, but the database did not have this variable.
With regard to individual variables, the positive impact of girls with respect with boys is observed, corroborating existent studies in
this area that point to an advantage of girls in reading and writing tests.
In the case of the variable objective of this analysis – failing or non-failing pupil –, it can be observed that the inclusion of the two individual variables decreases its impact, although it still remains significant. The number of times that a pupil failed becomes the variable with the higher negative impact, that is to say, the higher the number of times that a pupil failed, the lower their proficiency.
Table 11- Result of the regression for proficiency in LP Exam
Independent variables Model 1 Model 2
Fixed effect Coefficient Sig Coefficient Sig
Intercept 329.902 0.000 8.888 0.393
Average proficiency of the school in 2009 0.679 0.000
Failing pupil -16.419 0.000 -8.696 0.000
Pupil proficiency in 2008 0.429 0.000 0.386 0.000
Number of times pupil failed -14.594 0.000
Gender (1 = male e 0 = female) -7.364 0.000
Random in fact
Among pupils 3,822.288 3,742.240
Among schools 4,527.912 0.000 3,016.924 0.000
Source: Proalfa/SIMAVE, 2009.
Conclusion
This work has attempted to evaluate whether or not retaining low performance pupils in the 3rd grade of fundamental education brought
more benefits for the learning of these pupils when compared to pupils that were promoted to the 4th grade, having as a database the assessment
of the Proalfa program in Minas Gerais. We hope that the analysis may contribute to the debate about the effect of proficiency in pupils’ learning.
The results indicate that pupils that were kept in the 3rd grade of fundamental education
displayed smaller growth in proficiency between the assessments carried out in 2008 and 2009 when compared to pupils that were promoted to the 4th grade. This fact is confirmed even when
one controls for other variables (hierarchical regression model). It can be said that all pupils, failing and non-failing, displayed quite important growth in the average proficiency. However, the
hierarchical models built indicate that between two pupils with the same proficiency in 2008, one of them having failed and the other not, the one that did not fail tends to present the better proficiency level in 2009. This result corroborates the work by Luz (2008) who, also carrying out a longitudinal study, reached a similar conclusion for some of the states in the Northern, North East and Midwest regions of the country.
References
ALEXANDER, Karl; ENTWISLE, Doris; KABBANI, Nader. Grade retention, social promotion, and “third way” alternatives. Paper presented at the National Invitational Conference hosted by the Laboratory for Student Success at Temple University for Research in Human Development and Education. Alexandria, Virginia, November 29 –December 1, 1999.
BRYK, Anthony S.; RAUDENBUSH, Stephen W. Hierarchical linear models: applications and data analysis methods. 2. ed. Newbury Park, California: Sage, 2002.
FERRÃO, Maria Eugénia; BELTRÃO, Kaizô Iwakami; SANTOS, Denis Paulo dos. O impacto de políticas de não repetência sobre o aprendizado de alunos da 4º série. Pesquisa e Planejamento Econômico, v. 32, n. 3, p. 495-513, 2002.
GOMES-NETO, João Batista; HANUSHEK, Eric A. The causes and effects of grade repetition. In: BIRDSALL, Nancy; SABOT, Richard H. (Eds.). Opportunity forgone: education in Brazil. Washington, DC: Inter-American development Bank, 1996. p. 425-460.
HANUSHEK, Eric A. Publicly provided education. In: AUERBACH, Alan J., FELDSTEIN, Martin (Eds.). Handbook of public economics.
Amsterdam: Elsevier, 2002. v.4, p. 2045- 2141.
HOX, Joop J. Applied multilevel analysis. Amsterdam: TT-Publicities, 1995.
[INEP/MEC] INSTITUTO NACIONAL DE ESTUDOS E PESQUISAS EDUCACIONAIS – INEP. Censo Escolar. Brasília, 2008.
JIMERSON, Shane et al. A prospective longitudinal study of the correlates and consequences of early grade retention. Journal of School Psychology, v. 35, p. 3-25, 1997.
LUZ, Luciana Soares. O impacto da repetência na proficiência escolar: uma análise longitudinal do desempenho de repetentes em 2002-2003. Dissertação (Mestrado em Demografia) – Centro de Planejamento e Desenvolvimento Regional, Universidade Federal de Minas Gerais, Belo Horizonte, 2008.
MEISELS, Samuel J.; LIAW, Fong-Ruey. Failure in grade: do retained students catch up? Journal of Educational Research, v. 87, n. 2, p. 69-77, 1993.
RIANI, Juliana L. Ruas. Determinantes do resultado educacional no Brasil: família, perfil escolar dos municípios e dividendo demográfico numa abordagem hierárquica e espacial. Tese (Doutorado em Demografia) – Centro de Planejamento e Desenvolvimento Regional, Universidade Federal de Minas Gerais, Belo Horizonte, 2005.
[SEEMG]. Secretaria de Estado da Educação de Minas Gerais. Proalfa: Boletim Pedagógico. Belo Horizonte, 2009.
TODD, Petra E.; WOLPIN, Kenneth I. On the specification and estimation of the production function for cognitive achievement.
The Economic Journal, v. 113, n. 485, p. F3-F33, Feb. 2003.
Received on: 10.10.2011
Accepted on: 10.05.2012
Juliana de Lucena Ruas Riani has a Ph.D. in Demography from the Federal University of Minas Gerais, and is a researcher
in the João Pinheiro Foundation and lectures at the University of Itaúna.
Vania Candida da Silva works in the State Secretariat for Education of Minas Gerais, and is a Ph.D. student in Demography
at the Centre for Regional Development and Planning of Minas Gerais, Federal University of Minas Gerais, and is a technical advisor to the State Secretariat for Education of Minas Gerais.
Tufi Machado Soares is Associate Professor at the Department of Statistics and at the Graduate Program in Education of the