www.scielo.br/rbg
EVOLUTION OF Dst AND AURORAL INDICES
DURING SOME SEVERE GEOMAGNETIC STORMS
Rajaram Purushottam Kane
Recebido em 24 julho, 2008 / Aceito em 27 abril, 2009 Received on July 24, 2008 / Accepted on April 27, 2009
ABSTRACT.The evolutions of the geomagnetic Dst and auroral indices AU, AL, AE were examined in relation to interplanetary parameters for thirteen severe storms (Dst change exceeding 250 nT) during 1980-2003. Dst changes occurred every time Bz component of interplanetary magnetic field B turned negative. Among the auroral indices, changes in AU (representing an eastward auroral electrojet) were generally much smaller than changes in AL (representing a westward auroral electrojet), and both started increasing almost simultaneously with increases of interplanetary magnetic field B, even though its Bz component may not have turned negative. Hence AU and AL changes may precede Dst changes by a few hours and could have a prediction potential. AU and AL changes were not correlated well with each other; their inter-correlation was almost zero. Whenever Bz was negative, AL indices were invariably high, but the reverse was not true. Large AL changes could occur even when Bz was not negative (or even when positive). AL values showed many peaks during the storm and these were not invariably related to Bz changes. Successive AL peaks had separations in a wide range of 40-160 minutes. Spectral analysis of hourly values showed frequent periodicities around 2-4 hours, 6 hours, and 8-9 hours.
Keywords: geomagnetic Dst, auroral indices, geomagnetic disturbances.
RESUMO.As evoluc¸˜oes dos ´ındices Dst geomagn´etico e AU, AL e AE da aurora foram investigadas em relac¸˜ao aos parˆametros interplanet´arios de treze tempestades (com ´ındices Dst maiores que 250 nT), no per´ıodo entre 1980 e 2003. As mudanc¸as no ´ındice Dst ocorreram toda vez que a componente Bz do campo B magn´etico interplanet´ario se tornou negativa. Entre os ´ındices da aurora, as mudanc¸as do ´ındice AU (representando o eletrojato da aurora em direc¸˜ao ao leste) geralmente foram bem menores do que as do AL (representando o eletrojato da aurora para oeste). Ambos iniciaram um incremento quase que simultaneamente com o aumento do campo B magn´etico interplanet´ario, muito embora n˜ao tendo, `as vezes, a componente Bz se tornado negativa. Portanto, as mudanc¸as observadas em AU e AL podem preceder as da Dst por algumas horas e com isso tˆem o potencial de previs˜ao de mudanc¸a. As mudanc¸as em AU e AL n˜ao se comportaram em paralelo e as suas inter-correlac¸˜oes foram quase nulas. Quando Bz se tornava negativa, invariavelmente AL era alto, por´em o reverso n˜ao se realizava. Grandes mudanc¸as em AL poderiam ocorrer mesmo quando Bz n˜ao fosse negativa (ou mesmo positiva). Valores de AL apresentaram muitos picos durante as tempestades e invariavelmente estes n ˜ao se relacionaram `as mudanc¸as de Bz. Picos sucessivos de AL mostraram separac¸˜oes em largas faixas, entre 40 e 160 minutos. An´alise espectral de valores hor´arios mostraram freq¨uentes periodicidades ao redor de 2-4 horas, 6 horas e 8-9 horas.
Palavras-chave: Dst geomagn´etico, ´ındices aurorais, tempestades geomagn´eticas.
INTRODUCTION
Biermann (1951, and further papers) proposed that the pointing of comet tails always away from the Sun implies material flying out of the Sun on a continuous basis. To explore this possibi-lity, Parker (1958) formulated his theory of solar wind at the Uni-versity of Chicago (Hufbauer, 1991). Further, Parker (1959) and Gold (1959) examined its implications for the stretching (exten-sion) of solar magnetic field into the interplanetary space during quiet and enhanced solar activity. Soon after, satellite observa-tions confirmed many of those implicaobserva-tions, and interplanetary structures with abnormal values of plasma parameters were found to occur frequently, notably after solar flares. It was observed that geomagnetic storms occurred when the Earth was engulfed by the interplanetary abnormal structures (blobs, clouds, whate-ver), provided these structures had a substantial component of a southward pointing magnetic field component Bz. An explanation for the role of this negative Bz was given by Dungey (1961) as follows. If the interplanetary magnetic fields are directed oppo-site to the Earth’s field, there is magnetic erosion on the dayside magnetosphere by magnetic reconnection and magnetic field ac-cumulates in the night-side magnetotail region. The magnetic re-connection in the tail leads to plasma injection towards the Earth in the night-side. Low energy particles precipitate in the high la-titudes and cause aurora, while high energy protons drift to the west and electrons to the east, forming a “ring current” centered near the equator around the Earth, which causes a reduction in geomagnetic field (storm time disturbance field Dst).
Geomagnetic activity is represented by several indices. The hourly Dst index (Sugiura, 1964) is obtained from the superposi-tion of data from magnetometer stasuperposi-tions near the equator but not so close that the E-region equatorial electrojet dominates the mag-netic perturbations seen on the ground. The stations are roughly 120◦apart in longitude, so that superposed data at the same UT
has no local-time effects. AE index is an auroral electrojet in-dex obtained from a number (usually greater than 10) of stati-ons distributed in local time in the latitude region that is typi-cal of the northern hemisphere auroral zone (Davis & Sugiura, 1966). For each of the stations, the north-south magnetic pertur-bation H is recorded as a function of universal time. A superpo-sition of these data from all the stations enables a lower bound or maximum negative excursion of the H component to be de-termined; this is called the AL index. Similarly, an upper bound or maximum positive excursion in H is determined; this is called the AU index. The difference between these two indices, AU-AL, is called the AE index.
Strong geomagnetic storms are known to have damaging ef-fects at high latitudes (see discussion in Kane, 2005), communi-cation systems including those in airplanes can go haywire and power grids can go down. The most outstanding example is of the March 13, 1989 event when the Hydro-Quebec (Canada) power grid went down for more than 9 hours, and the eastern U.S. sea-board power grid was almost put down (Allen et al., 1989; Tsuru-tani et al., 2003). It is reported that Kp exceeding 8 is already at a dangerous level. The transition of Kp from 8 to 9 corresponds approximately to negative Dst exceeding 250 nT (Kane, 2005). Such severe Dst storms seem to occur a few hours later than the start of the increases in auroral indices. Beland (2004) mentions that for Hydro-Quebec (HQ) in the province of Quebec in Canada, there are now two measurement systems (one primary and one backup) monitoring ground induced current (GIC) effects on the grid in real time. To be informed in advance of a probable GIC occurrence, HQ now relies on a specialized organization provi-ding geomagnetic activity alert and forecast. Following an alert or the detection of GIC effects on the network exceeding a minimal threshold, special operation rules become in effect for ensuring maximum stability and safety margin. Also, series capacitors are introduced on several 735 kV lines, which increase network sta-bility and also block GIC circulation. Other installations might be using other methods. In some cases, operations are stopped (if possible) until the storm continues.
In the present communication, we propose to examine the evolutions of Dst, AU, AL, AE in a rough qualitative way to check whether their behaviors are grossly different from each other, du-ring a few selected severe geomagnetic storms (maximum Dst de-pression exceeding 250 nT). Comparison is also made with inter-planetary data.
DATA
Figure 1– Plots of hourly values of interplanetary parameters: number density N, solar wind speed V, magnetic field B and its components Bx, By, Bz, and geomagnetic indices: AU, AL, AE, Dst, during Apr. 10-14, 1981. The full vertical lines mark the 0000 UT of the dates. The storm commenced at about 0800 UT of April 11 (marked by the vertical line). Positive values are painted black and negative values are shown hatched.
from this satellite are expected to be of a better quality, but during the severe storm of October 28-29, 2003 (Halloween event), some instruments seem to have failed (Skoug et al., 2004).
PLOTS FOR APRIL 10-14, 1981
Figure 1 shows the plots of hourly values during Apr. 10-14, 1981. The full vertical lines mark the 0000 UT of the dates. The storm commenced at about 0800 UT of April 11 (marked by the vertical line) when interplanetary number density N, solar wind speed V and total magnetic field B started rising. Positive values are pain-ted black and negative values are shown hatched. The southward Bz component was only a few nT negative, but the AU, AL, AE in-dices also increased at about the same time. In contrast, the Dst index had a very small negative value (few nT) and started incre-asing only at about 2200 UT, almost 14 hours later, when Bz had a large negative value (about –20 nT, marked by a vertical dashed line). Thus, Dst seems to need a threshold negative Bz value exce-eding∼5 nT (Gonzalez et al., 1994) for a substantial Dst change (exceeding 50 nT). However, this also indicates the possibility that in some Dst storms, the auroral indices may serve as precursors, with several hours of antecedence.
The Dst index had a main phase of about 4 hours, followed by a gradual recovery, which would have taken several tens of hours but for the fact that at UT about 0600 of April 12 (marked by a vertical dashed line), there was a negative Bz excursion of about –15 nT, which slowed the Dst recovery but did not show any abrupt change in Dst, and then another negative Bz excursion of about –25 nT at about 2200 UT of April 12, which resulted into a fresh decrease in Dst (marked by a vertical dashed line) and a highest maximum Dst value of –311 nT. There was another small negative excursion of Bz (–8 nT) at about 1900 UT on April 13 (marked by a vertical dashed line) which only slowed down the Dst recovery. Thus, two large negative Bz excursions resulted in large abrupt Dst changes while three small negative Bz changes caused only small perturbations in Dst. This was an unusual event where negative Bz occurred so often (5 or more times in three days). As will be seen in some other events, Bz changes are confined to a small interval of a few hours (tens of minutes to several hours).
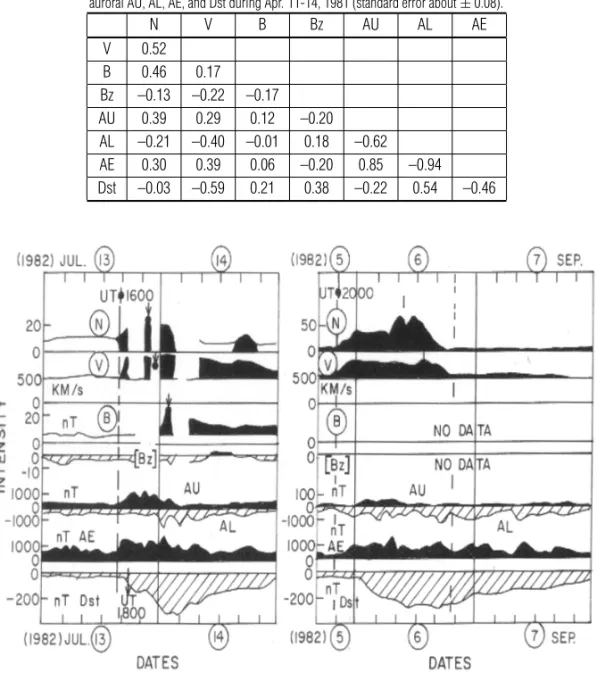
Table 1 shows the inter-correlations of interplanetary N, V, B, Bz, auroral AU, AL, AE, and Dst, using 96 hourly values of Apr. 11-14, 1981. As can be seen, most of the correlations are less than 0.45, indicating generally poor relationships. Correlations exceeding 0.45 are:
(a) N with V(0.52) and B(0.46) indicating simultaneous storm-time increases.
(b) AU with AL(-0.62) and AE(0.85), AL with AE(-0.94), in-dicating some relationship but not very strong between the two independent parameters AU and AL, and arith-metical relationship between AE and AU or AL (AL=AU-negative AL).
(c) Dst with V(-0.59) (well-known, first indicated by Snyder et al., 1963), AL(0.54), AE(-0.46), but not with AU(-0.22), indicating that equatorial Dst current variations may have some similarity with the westward auroral electrojet AL but almost none with the eastward auroral electrojet AU.
PLOTS FOR OTHER EVENTS DURING 1982-2003
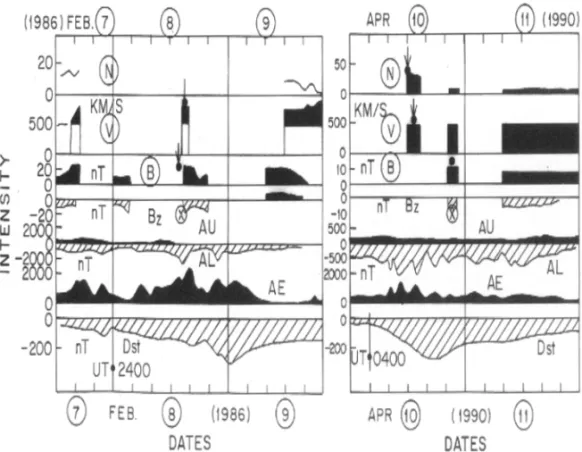
Figure 2 shows plots of hourly values of N, V, B, Bz, AU, AL, AE and Dst for the event of July 13-14, 1982 in the left half. The in-terplanetary data are intermittent, but, in conjunction with AU, AL, AE and Dst, the storm seems to have started at about 1600 UT of July 13 (marked by a vertical dashed line). Since the Bz data are intermittent, matching with geomagnetic indices is uncertain.
Table 1– Inter-correlations of the hourly values of interplanetary N, V, B, Bz, auroral AU, AL, AE, and Dst during Apr. 11-14, 1981 (standard error about±0.08).
N V B Bz AU AL AE
V 0.52
B 0.46 0.17
Bz –0.13 –0.22 –0.17
AU 0.39 0.29 0.12 –0.20
AL –0.21 –0.40 –0.01 0.18 –0.62
AE 0.30 0.39 0.06 –0.20 0.85 –0.94
Dst –0.03 –0.59 0.21 0.38 –0.22 0.54 –0.46
The Dst negative values started at about 1800 UT, about two hours later than AU, AL, AE, and reached a maximum value of –325 nT. The AU values showed maxima several hours earlier than AL This is different from what is mentioned for substorms, namely, the peak time of AU usually occurs several tens of minu-tes behind the AL peak time which signals the maximum epoch of substorms (Kamide & Fukushima, 1972). Thus, long-term variations (hours) of AU and AL have a different relationship as compared to those of short-term variations (tens of minutes). Part of the discrepancies could be because of the two factors mentio-ned by Rostoker (2002). Firstly, AU and AL are average values from a number of stations and the absence of data from some vi-tal stations under the electrojet centers could make a difference (even up to±50%) in the magnitude estimates. Secondly, the
electrojet centers move with time (e.g., pole ward movement) du-ring the different storm phases (expansion phase, etc.). But, in general, it seems that AU and AL do develop partly independently, with incoming solar wind particles hitting different latitudes and longitude differently at different times.
The right half of Figure 2 shows the plots for Sept. 5-7, 1982. There are no data for interplanetary magnetic field. The N and V plots indicate a storm commencement at about 2000 UT of Sept. 5 (marked by a vertical dashed line). Again, auroral acti-vities started at about this time, but the Dst variations started a
few hours later, at about 2400 UT, and reached a maximum va-lue of –289 nT. The N and V abnormal variations ended at about 2000 UT of Sept. 6, but the auroral and Dst variations continued well into Sept. 7. Since magnetic field data are missing, it is not possible to check whether the B component continued to be large on Sept. 7 also. In general, B values returning to normal would indicate that the Earth has come out of the interplanetary blob.
Figure 3 left half shows the plots for Feb. 7-9, 1986. The inter-planetary data are intermittent. The auroral indices and Dst storms started at about 1200 UT of Feb. 7 (beginning of the plots), had a slight recovery, and then had another swing at about 2400 UT, at the date line of Feb. 7-8, to reach a maximum Dst value of –307 nT. The positive AU values were much smaller than the negative AL values, so that AE values are roughly the same (sign changed) as the AL values.
The right half of Figure 3 shows the plots for Apr. 10-11, 1990. The interplanetary data were unsatisfactory. The auroral indices show a storm beginning at about 0000 UT of Apr. 10 (beginning of the plots), while the Dst storm strengthened at about 0400 UT (four hours later), and reached a maximum va-lue of –281 nT. Here again, AU vava-lues were much smaller than AL values, which had many peaks, unlike the Dst which was smooth. Since magnetic field data are intermittent, the associ-ation of these peaks with Bz changes cannot be checked.
Figure 4– Plots of hourly values for Oct. 28-30, 1991 (left half) and for Apr. 6-8, 2000 (right half).
Figure 4 left half shows the plots for Oct. 28-30, 1991. In-terplanetary data were satisfactory at least in the early part and show a storm beginning at about 0800 UT of Oct. 28 (beginning of the plots). Auroral indices increased at about the same time, while Dst started at about 1200 UT (four hours later) and reached a maximum value of –254 nT. Bz had three swings which were reflected in AL and Dst (AU values were much smaller than AL values). Thus, the geomagnetic indices ran parallel to Bz chan-ges. It is interesting to note that the third swing of Bz was smal-ler (–10 nT) than the second swing (–20 nT), but the AL values were comparable.
The right half of Figure 4 shows the plots for Apr. 6-8, 2000. The interplanetary data were missing for N, V but existed for B, Bz. The storm started at about 1800 UT of Apr. 6 (marked by a vertical dashed line), for all indices (an example of synchroniza-tion). Dst reached a maximum value of –268 nT. Coinciding with the large Bz negative. Here again, AU values were much smaller than AL values, which had many peaks, continuing even when Bz fluctuations had stopped and B values had come to normal. Thus, AL values had fluctuations even after the storm ceased.
Figure 5 shows plots for six events, (a) Jul. 15-17, 2000, (b) Mar. 30-31, 2001, (c) Apr. 11-12, 2001, (d) Nov. 5-7, 2001, (e) Oct. 29-30, 2003, (f) Nov. 20-21, 2003.
In (a) Jul. 15-17, 2000, interplanetary data were intermittent, auroral indices increased from about 1200 UT of July 15
(begin-ning of the plots), while Dst started at about 1800 UT (six hours later) and reached a maximum value of –301. Interplanetary data were intermittent, auroral indices increased from about 1200 UT of July 15 (beginning of the plots), while Dst started at about 1800 UT (six hours later) and reached a maximum value of –301. No magnetic data were available for comparison, but AU values were as large as AL values.
In (b) Mar. 30-31, 2001, interplanetary data were satisfactory, the storm started at 2000 UT on Mar. 30 in all indices (marked by a vertical dashed line), except Dst, for which the storm star-ted at about 0400 UT of March 31 (eight hours later, marked by a vertical dashed line), and reached a maximum value of –358 nT. The Bz had two major swings of more than –25 nT, but B had four swings, AU had four, and AL had more than four. Thus, AL seems to have some swings even when Bz was not negative.
In (c) Apr. 11-12, 2001, interplanetary data were satisfactory, the storm started at 1200 UT on Apr. 11 in all indices (marked by a vertical dashed line), except Dst, for which the storm started at about 1600 UT of Apr. 11 (four hours later, marked by a vertical dashed line), and reached a maximum value of –256 nT. The Bz had two swings, AU had two, but AL had three. Thus again, AL seems to have some swings even when Bz was not negative.
Figure 5– Plots of hourly values for (a) July 15-17, 2000; (b) Mar. 30-31, Apr. 1, 2001; (c) Apr. 11-12, 2001; (d) Nov. 5-7, 2001; (e) Oct. 29-30, 2003; (f) Nov. 20-21, 2003.
maximum value of –277 nT. The Bz values were not available, but AU had two swings and AL had three.
The (e) and (f) plots are for the famous Halloween events of October-November 2003. (In the WDC for Geomagnetism, Kyoto website, hourly values in digital form are available only up to 2001. For 2002 onwards, only plots are available. Hence, the plots in (e) and (f) are quantitatively approximate). In (e) Oct.
29-30, 2003, N data were missing in some instruments or un-reliable in some others (SWEAM data, Skoug et al., 2004). How-ever, PWI (plasma wave) instrument on Geotail gave some data (Toshio Terasawa, website http://www-space.eps.s.u-tokyo.ac.jp/
extremely high speed storms (V exceeded 2000 km/s) and se-ems to have started at about 0600 UT of Oct. 29 in all indices including Dst (marked by a vertical dashed line), for which the storm reached a maximum value of –363 nT in a first swing at 2400 UT of Oct. 29, and –401 nT in a second swing at 2200 UT of Oct. 30, both these well matched with similar Bz negative swings. The AU and AL had a very complex structure. AU was very small as compared to AL, which had many peaks besides two peaks matching with the Bz peaks. Thus, AL had some pe-aks unrelated to Bz changes. The B values had two major pepe-aks, first at about 1600 UT of Oct. 29 and the second at about 1600-2000 UT of Oct. 30. Thus, this was an interval of two succes-sive interplanetary structures (blobs) separated by about 24-28 hours. Large negative Bz occurred at about 2000 UT on Oct. 29 and 2000 UT on Oct. 30. These caused corresponding Dst main phases. However, in the auroral indices, AU was very small, AL and AE had enormous values (exceeding 2000 nT) and had ma-jor peaks matching with the negative Bz excursions but also had other peaks in between.
In (f) Nov. 20-21, 2003, interplanetary data were available fully. The V values were moderate and rose from a base va-lue of∼500 km/s at about 0700 UT of Nov. 20 (starting of the
storm, marked by a vertical dashed line) to values of only about 800 km/s. This was a simple but strong storm with Dst
rea-ching a very high value of –470 nT. B and Bz had one strong swing, but AU, AL and AE had many peaks. Particularly intri-guing is the abnormal increases in AU, AL, AE during 0400-0800 UT on Nov. 21 (marked in a square) which have no cor-responding changes in interplanetary parameters (the Earth had come out of the blob).
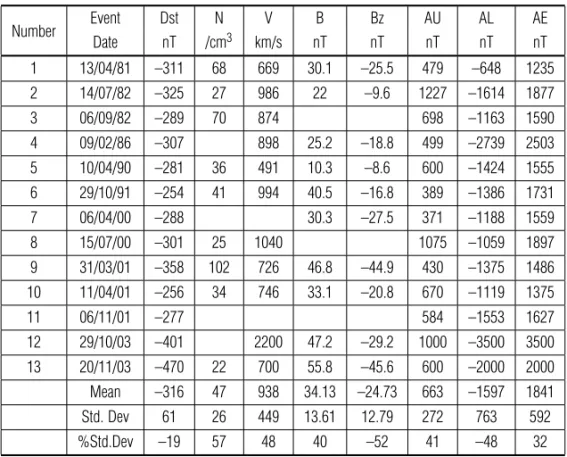
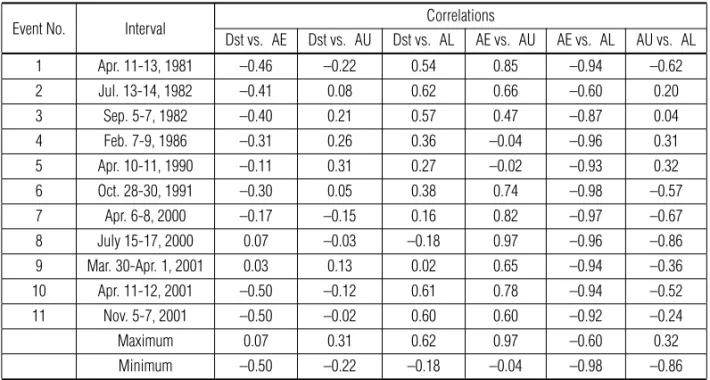
Table 2 lists the storm dates and the maximum values of the various indices during the various storms (numbered 1-13, va-lues for 12 and 13 are approximate). The Dst storms were chosen as severe (exceeding 250 nT) and the highest value is –470 nT. Table 3 shows the inter-correlations of the maximum values of Table 2. Table 4 shows the inter-correlations for the geomag-netic indices Dst, AE, AU, AL calculated from the hourly values in each storm separately. The following may be noted in Tables 2, 3 and 4:
(1) Dst has a poor correlation (–0.30) with interplanetary V. A good correlation was reported first by Snyder et al. (1963), but subsequent analyses have shown that with only V, the correlations are poor. The most glaring discrepancy was observed during the Halloween events. On Oct. 29, 2003, the V value was very large (2200 km/s), almost 3 times that of Nov. 20, 2003 (700 km/s), but the Dst values in the two storms were almost equal (–401 and –470 nT). The reason is that negative Bz plays a much more
impor-Table 2– Maximum values of Dst, N, V, B, Bz, AU, AL, AE during thirteen severe geomagnetic storms.
Number Event Dst N V B Bz AU AL AE
Date nT /cm3 km/s nT nT nT nT nT
1 13/04/81 –311 68 669 30.1 –25.5 479 –648 1235
2 14/07/82 –325 27 986 22 –9.6 1227 –1614 1877
3 06/09/82 –289 70 874 698 –1163 1590
4 09/02/86 –307 898 25.2 –18.8 499 –2739 2503
5 10/04/90 –281 36 491 10.3 –8.6 600 –1424 1555
6 29/10/91 –254 41 994 40.5 –16.8 389 –1386 1731
7 06/04/00 –288 30.3 –27.5 371 –1188 1559
8 15/07/00 –301 25 1040 1075 –1059 1897
9 31/03/01 –358 102 726 46.8 –44.9 430 –1375 1486
10 11/04/01 –256 34 746 33.1 –20.8 670 –1119 1375
11 06/11/01 –277 584 –1553 1627
12 29/10/03 –401 2200 47.2 –29.2 1000 –3500 3500
13 20/11/03 –470 22 700 55.8 –45.6 600 –2000 2000
Mean –316 47 938 34.13 –24.73 663 –1597 1841
Std. Dev 61 26 449 13.61 12.79 272 763 592
Table 3– Inter-correlations of the maximum values in thirteen storm events.
Dst N V B Bz VBz AU AL
N 0.04
V –0.30 –0.22
B –0.67 0.21 0.36
Bz 0.71 –0.45 –0.06 –0.85
VBz 0.66 –0.44 –0.81 –0.73 0.61
AU –0.20 –0.52 0.49 –0.11 0.31 –0.21
AL 0.52 0.38 –0.73 –0.28 0.10 0.69 –0.25
AE –0.49 –0.61 0.87 0.30 –0.07 –0.74 0.42 –0.95
Table 4– Inter-correlations of the hourly values of the geomagnetic indices Dst, AE, AU, AL separately for each of the eleven storms in 1981-2001.
Event No. Interval Correlations
Dstvs. AE Dstvs. AU Dstvs. AL AEvs. AU AEvs. AL AUvs. AL
1 Apr. 11-13, 1981 –0.46 –0.22 0.54 0.85 –0.94 –0.62
2 Jul. 13-14, 1982 –0.41 0.08 0.62 0.66 –0.60 0.20
3 Sep. 5-7, 1982 –0.40 0.21 0.57 0.47 –0.87 0.04
4 Feb. 7-9, 1986 –0.31 0.26 0.36 –0.04 –0.96 0.31
5 Apr. 10-11, 1990 –0.11 0.31 0.27 –0.02 –0.93 0.32
6 Oct. 28-30, 1991 –0.30 0.05 0.38 0.74 –0.98 –0.57
7 Apr. 6-8, 2000 –0.17 –0.15 0.16 0.82 –0.97 –0.67
8 July 15-17, 2000 0.07 –0.03 –0.18 0.97 –0.96 –0.86
9 Mar. 30-Apr. 1, 2001 0.03 0.13 0.02 0.65 –0.94 –0.36
10 Apr. 11-12, 2001 –0.50 –0.12 0.61 0.78 –0.94 –0.52
11 Nov. 5-7, 2001 –0.50 –0.02 0.60 0.60 –0.92 –0.24
Maximum 0.07 0.31 0.62 0.97 –0.60 0.32
Minimum –0.50 –0.22 –0.18 –0.04 –0.98 –0.86
tant role than V (Gonzalez et al., 1994), with correlations of Dstversus B (–0.67),versus Bz (0.71) andversus the product VBz (0.66).
(2) Dst has a poor correlation with AU (–0.20) but has better (moderate) correlations with AL (0.52) and AE (–0.49), in-dicating that eastward auroral electrojet AU is more or less independent of Dst, while the westward auroral electrojet AL may have at least a partial relation with Dst. On the other hand, interplanetary N (number density) has a bet-ter, though moderate, correlation with AU (–0.52) and AE (–0.61) at least in this case.
(3) V has a good correlation with AL (–0.73).
(4) AU has a poor correlation with AL (–0.25). Thus the eastward and westward auroral electrojets evolve almost
independently of each other. The mean value of the ratio AU/AL is –0.48 (±0.25). Thus, the auroral eastward elec-trojet AU is about 1/5thto 3/4thof the westward electrojet
AL in strength.
SPECTRUM ANALYSIS
The AU and AL plots show considerable fluctuations during the storm intervals, with many peaks, some coinciding with negative Bz excursions, others not coinciding. To obtain quantitative esti-mates of the spectral characteristics during storms, the series of AU and AL series in each storm were subjected to spectral analy-sis by MEM (Maximum Entropy Method, Burg, 1967; Ulrych & Bishop, 1975), which locates peaks much more accurately than the conventional BT (Blackman & Tukey, 1958) method. How-ever, the amplitude (Power) estimates in MEM are not very relia-ble (Kane, 1977, 1979; Kane & Trivedi, 1982). Hence, MEM was used only for detecting all the possible peaksTk (k =1ton),
using LPEF (Length of the Prediction Error Filter) as 50% of the data length. TheseTkwere then used in the expression:
f(t) = A0+ n
X
k−1
aksin(2πt/Tk)+bkcos(2πt/Tk)
+E
= A0+ n
X
k=1
rksin(2πt/Tk+φk)+E
where f(t)is the observed series andEthe error factor. A Mul-tiple Regression Analysis (MRA, Bevington, 1969) was then car-ried out to estimateAo(ak∙bk), and their standard errors (by a
least-square fit). From these, amplitudesrk and their standard
errorσk(common for allrkin this methodology, which assumes
white noise) were calculated. Anyrkexceeding2σ is significant
at a 95% (a priori) confidence level.
Figure 6 shows the spectra (amplitudesversus the periodi-cities found significant), for the storms numbered 1-13, for AU series in the left half, and AL series in the right half. The hatched area in each spectrum is the2σlimit, and lines protruding above this area represent periodicities significant at a better than 95% confidence level. The amplitudes of significant periodicities are, in general smaller for AU than for AL. Periodicities for AU and AL are not the same, and there is bunching around 2-4 hours, 6 hours, and 8-9 hours. A physical explanation for these needs to be explored. The larger periodicities (6-9 hours) may be indicative of long-term changes like latitudinal movements during different phases of the storm.
SHORT-TERM FLUCTUATIONS
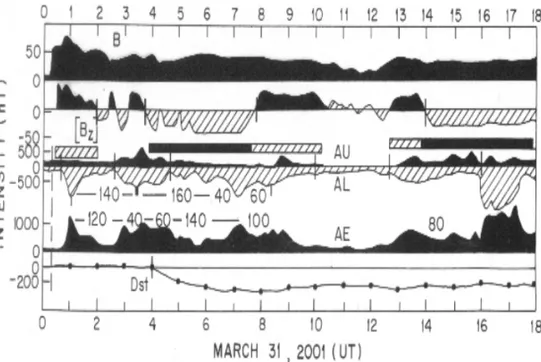
So far, only hourly data were considered. In substorms, fluctua-tions lasting for a few minutes to tens of minutes have been re-ported earlier (Nishida, 1971). Here, the event in Figure 5(b) was selected for a finer study. Figure 7 shows plots of 4-minute va-lues for interplanetary B, Bz and terrestrial AU, AL, AE, Dst indices (for Dst, hourly values only) during 0-18 UT of March 31, 2001.
Positive values are painted black and negative values are shown hatched. The B component started increasing at about 0020 UT (vertical dashed line), heralding a storm commencement. The Bz component started as positive and became negative only about 100 minutes later, from 0200 UT in an intermittent way up to 0340 UT, then was consistently large negative for the next four hours (up to about 0740 UT), positive or almost zero for the next six hours (up to 1400 UT), turning thereafter again to negative va-lues up to the end of the plot. Changes of the AU index were small, and the AL index (negative values only) showed large increases, first at about 0040 UT when Bz was positive, then at 0240 UT when Bz was alternating between negative and positive, and further from 0340 UT onwards for several hours when Bz was consistently ne-gative. Later on, AL was large from 1240 UT onwards when Bz was positive. From 1400 UT, Bz was negative and AL was large, but at 1600 UT when Bz was negative, AL increased enormously for almost 80 minutes. The horizontal rectangles below the Bz plot indicate the coincidence (full rectangles) or anti-coincidence (hatched rectangles) of negative Bz with large AL values. The bot-tom plot is for Dst (hourly values) and shows a strong storm from 0400 UT only, four hours later than B and auroral indices, and showing a smooth recovery from 0600 UT onwards. Interestin-gly, substorms lasting a few tens of minutes are often mentio-ned, but in the present case, these seem to be missing in Bz, and seem to be present in AL and AE, with successive peak sepa-rations of 40-160 minutes (indicated by numbers).
CONCLUSIONS AND DISCUSSION
The evolutions of the geomagnetic Dst and auroral indices AU, AL, AE were examined in relation to interplanetary parameters for thir-teen severe storms (Dst change exceeding 250 nT) during 1980-2003. The following was noted:
(1) When the Earth is engulfed by abnormal interplanetary structures, characterized by sudden increases in number density N and/or solar wind speed V and/or total magnetic field B, geomagnetic storms may occur, indicated by incre-ases of the geomagnetic disturbance indices Kp, Ap, Dst, AU, AL etc.
Figure 6– Spectra (amplitudesversusthe periodicities found significant), for the storms numbered 1-13, for AU series in the left half and AL series in the right half. The hatched area in each spectrum is the2σlimit, and lines protruding above this area represent periodicities significant at a better than 95% confidence level.
in between, Dst shows either a fresh kink (restart of another main phase), or a slowing down of the earlier recovery.
(3) Among the auroral indices, changes in AU (representing an eastward auroral electrojet) are generally smaller than changes in AL (representing a westward auroral electro-jet). We do not know how meaningful (or meaningless) AE should be considered, but AE is mostly similar (reversed sign) to AL. Generally, both AU and AL start increasing al-most simultaneously with increases of interplanetary mag-netic field B, even though Bz may not have turned negative. Hence AU and AL changes mayprecede Dst changes by a few hours and could have a prediction potential.
(4) AU and AL changes are not related to each other; their inter-correlation could be near zero. Whenever Bz is ne-gative, AL indices are invariably high, but the reverse is not true. Large AL changes can occur even when Bz may not be negative, or may be even positive.
Figure 7– Plots of 4-minute values for interplanetary B, Bz and terrestrial AU, AL, AE, and hourly values for Dst during 0-18 UT of March 31, 2001. Positive values are painted black and negative values are shown hatched. Numbers on the AL and AE plots indicate separation in minutes between successive peaks.
It seems therefore, that the entry of low energy solar wind particles in the polar regions of the Earth is a complicated pro-cess, not completely dominated by the negative Bz valve. Quiet time auroras are always present, though these intensify during storms, and AL changes can be large even when Bz is posi-tive. Charged particle precipitation in the auroral region is pre-ferably along magnetic field lines (field-aligned currents) and acceleration processes are involved (Axford & Hines, 1961). These processes need more detailed studies (using a variety of data inputs and not relying completely on the auroral indices, Rostoker, 2002), different from those needed for the equatorial ring current causing Dst.
ACKNOWLEDGMENTS
Thanks are due to Dr. Ruth Skoug, Dr. Qiang Hu and Dr. Toshio Terasawa for sending data and information about the October 29, 2003 event privately. Thanks are due to the various workers and the data suppliers and the WDC for Geomagnetism, Kyoto. Thanks are due to N. Ness of Bartol Research Institute and CDAWeb for some interplanetary data for the October-November 2003 Hal-loween events. This work was partially supported by FNDCT, Brazil, under contract FINEP-537/CT.
REFERENCES
ALLEN J, SAUER H, FRANK L & REIFF P. 1989. Effects of the March 1989 solar activity. EOS Trans. AGU, 70: 1479.
AXFORD WI & HINES CO. 1961. A unifying theory of high-latitude geophysical phenomena and geomagnetic storms. Canad. J. Phys., 39: 1443–1464.
BELAND J. 2004. Hydro-Quebec and geomagnetic storms: Measu-rement techniques. Effects on transmission network and preventive actions since 1989. Paper COSPAR 04-A-02392, PSW1-0012-04, 35th COSPAR Assembly, July 19-25, 2004, Paris.
BEVINGTON PR. 1969. Data Reduction and Error Analysis for the Physi-cal Sciences. McGraw-Hill, New York, pp. 164–176.
BIERMANN LF. 1951. Kometenschweife und solare Korpuskularstrah-lung. Zeitschrift f¨ur Astrophysik, 29: 274–286.
BLACKMAN RB & TUKEY JW. 1958. The Measurement of Power Spectra. Dover, New York, 190 pp.
BURG JP. 1967. Maximum Entropy Spectral Analysis. Paper presented at the 37thMeeting. Society of Exploration Geophysics, Oklahoma City, October.
DAVIS TN & SUGIURA M. 1966. Auroral electrojet activity index AE and its universal time variations. J. Geophys. Res., 71: 785–801.
DUNGEY JW. 1961. Interplanetary magnetic field and the auroral zones. Phys. Rev. Lett., 6: 47–49.
GOLD T. 1959. Plasma and magnetic fields in the solar system. J. Geo-phys. Res., 64: 1665–1674.
HUFBAUER K. 1991. Exploring the Sun: Solar Science since Galileo. The John Hopkins University Press, Baltimore, Maryland, USA. 370 p.
KAMIDE Y & FUKUSHIMA N. 1972. Positive geomagnetic bays in eve-ning high latitudes and their possible connection with partial ring current. Rep. Ionos. Space Res. Japan, 26: 79–101.
KANE RP. 1977. Power spectrum analysis of solar and geophysical pa-rameters. J. Geomag. Geoelect., 29: 471–495.
KANE RP. 1979. Maximum Entropy Spectral Analysis of some artificial samples. J. Geophys. Res., 84: 965–966.
KANE RP. 2005. How good is the relationship of solar and interplanetary plasma parameters with geomagnetic storms? J. Geophys. Res., 110, A02213, doi:10.1029/2005JA010799.
KANE RP & TRIVEDI NB. 1982. Comparison of maximum entropy spec-tral analysis (MESA) and least-square linear prediction (LSLP) methods for some artificial samples. Geophysics, 47: 1731–1736.
NISHIDA A. 1971. DP2 and polar substorm. Planet. Space Sci., 19: 205–221.
PARKER EN. 1958. Suprathermal particle generation in the solar corona. Astrophys. J., 128: 677–685.
PARKER EN. 1959. Extension of the solar corona into interplanetary space. J. Geophys. Res., 64: 1675–1681.
ROSTOKER G. 2002. Why we have not yet solved the substorm problem. In: WINGLEE RM (Ed.). Sixth International Conference on Substorms, pp. 1–8, University of Washington, Seattle.
SKOUG RM, GOSLING J, STEINBERG J, McCOMAS DJ, SMITH CW, NESS NF, HU Q & BURLAGA LF. 2004. Extremely high speed so-lar wind: October 29-30, 2003. J. Geophys. Res., 109: A09102, doi:10.1029/2004JA010494.
SNYDER CW, NEUGEBAUER M & RAO UR. 1963. The solar wind ve-locity and its correlation with cosmic ray variations and with solar and geomagnetic activity. J. Geophys. Res., 68: 6361–6370.
SUGIURA M. 1964. Hourly values of equatorial Dst for IGY. In: Annals of the International Geophysical Year, vol. 35, Pergamon Press, Oxford. 945–948.
TSURUTANI BT, GONZALEZ WD, LAKHINA GS & ALEX S. 2003. The extreme magnetic storm of 1-2 September 1859. J. Geophys. Res., 108(A7): 1268, doi: 10.1029/2002JA009504.
ULRYCH TJ & BISHOP TN. 1975. Maximum Entropy Spectral Analysis and autoregressive decomposition. Rev. Geophys., 13: 183–200.
NOTE ABOUT THE AUTHOR