Detection of acute cerebral hemorrhage
in rabbits by magnetic induction
J. Sun
1, G. Jin
1, M.X. Qin
1, Z.B. Wan
2, J.B. Wang
3, C. Wang
3, W.Y. Guo
3, L. Xu
1, X. Ning
1, J. Xu
1,
X.J. Pu
1, M.S. Chen
1and H.M. Zhao
2 1College of Biomedical Engineering and Medical Imaging, Third Military Medical University, Chongqing, China 2Experimental Animal Center, Third Military Medical University, Chongqing, China 3College of Electronic Engineering, Xidian University, Xi’an, ChinaAbstract
Acute cerebral hemorrhage (ACH) is an important clinical problem that is often monitored and studied with expensive devices such as computed tomography, magnetic resonance imaging, and positron emission tomography. These devices are not readily available in economically underdeveloped regions of the world, emergency departments, and emergency zones. We have developed a less expensive tool for non-contact monitoring of ACH. The system measures the magnetic induction phase shift (MIPS) between the electromagnetic signals on two coils. ACH was induced in 6 experimental rabbits and edema was induced in 4 control rabbits by stereotactic methods, and their intracranial pressure and heart rate were monitored for 1 h. Signals were continuously monitored for up to 1 h at an exciting frequency of 10.7 MHz. Autologous blood was administered to the experimental group, and saline to the control group (1 to 3 mL) by injection of 1-mL every 5 min. The results showed a significant increase in MIPS as a function of the injection volume, but the heart rate was stable. In the experimental (ACH) group, there was a statistically significant positive correlation of the intracranial pressure and MIPS. The change of MIPS was greater in the ACH group than in the control group. This high-sensitivity system could detect a 1-mL change in blood volume. The MIPS was significantly related to the intracranial pressure. This observation suggests that the method could be valuable for detecting early warning signs in emergency medicine and critical care units.
Key words: Acute cerebral hemorrhage; Magnetic induction phase shift; Electromagnetic properties of biological tissues; Intracranial pressure
Introduction
Spontaneous acute cerebral hemorrhage (ACH) is bleeding into the brain that occurs in the absence of trauma. Thirty-day mortality approaches 50%, and only 20% of survivors achieve meaningful functional recovery at 6 months (1,2). Spontaneous intracerebral hemor-rhage is responsible for 10-15% of acute strokes and is associated with the highest mortality rate, with only 38% of affected patients surviving the first year (3). The study of cerebral hemorrhage has benefited from advances in medical imaging technologies such as computed tomo-graphy (CT), magnetic resonance imaging (MRI), and positron emission tomography (PET) (4). Although such imaging devices are extremely valuable for studying cerebral hemorrhage, they are expensive and not readily available either to patients or to researchers in areas with limited economic resources (5,6), emergency depart-ments, and emergency zones. In addition, imaging techniques may be unable to detect hemorrhages when
the amount of bleeding is very small even though the potential danger is large. The goals of this study are to conduct animal experiments with our magnetic induction phase shift (MIPS) measurement device for real-time monitoring of ACH and to clarify the relationships of intracranial pressure (ICP), MIPS, and bleeding volume.
The relevant field of study here is that of the electromagnetic properties of biological tissues. As shown by Tarjan and McFee (7), electrodeless measurement of changing impedances in the human body can be achieved by measuring the effect of inducted eddy currents. It is well established that different biological tissues have different electromagnetic properties and can therefore be distinguished on the basis of those properties (8). The complex electrical properties of impaired tissue are substantially different from those of normal tissue, and various non-contact systems based on electromagnetic measurements have been proposed for different medical
Correspondence: M.X. Qin, College of Biomedical Engineering and Medical Imaging, Third Military Medical University, 400038 Chongqing, China. Fax: ++86-023-6877-2484. E-mail: [email protected]
applications (9,10). Magnetic induction tomography has been studied as a potential tool for the non-invasive detection of edema (9-12) in addition to other non-contact approaches for detecting electromagnetic changes in tissue (13). Measuring changes in the electromagnetic properties of tissue with two non-contacting induction coils placed near the tissue have been proposed as an alternative method to detect clinical changes in the tissue (14,15). Although the information thus obtained is not in the form of an image, it can provide temporal and even gross information about local changes in tissue (16) from non-contact, volume measurements. In particular, a change in the MIPS following the occurrence of a suspected clinical episode could serve as a first-order clinical warning by detecting the presence and progres-sion of changes in tissue (13). In previous research, we carried out experimental studies to simulate the detection of cerebral edema by using a magnetic induction method, a single detection system, and a physical model of cerebral edema (17,18). We found that MIPS values were directly proportional to the volume, conductivity, and frequency. In this study, we showed that non-invasive measurements of the electromagnetic properties of the rabbit brain can be used to detect the evolution of a cerebral hemorrhage. We describe herein the fundamen-tal principles of the technique and a prototype device. We then show results obtained from the brains of rabbits in which ACH was induced.
Material and Methods
Theoretical basis
The electromagnetic property that we measured in this study was the change in MIPS across time under conditions of ACH. We considered a cylinder of tissue of radiusRand thickness tas a case study; it was placed centrally between an excitation coil and a detection coil separated by distance d (t,,d). A sinusoidal current I of angular frequencyv flowed in the excitation coil and produced a magnetic fieldB. The non-magnetic cylinder had conductivity s and relative permittivity er. The skin
depthdwas assumed to be much greater than t, which means that the attenuation of the magnetic field B
produced by the cylinder was small. We used spherical polar coordinates (r,h), as shown in Figure 1.
According to Griffiths et al. (19), at a point P in the cylinder model, the magnetic field relation is given as follows.
DB
B ~ðve0er{jsÞ vm0td3
16
1
r02 { r0
2z2R2 r02zR2
ð Þ2
" #
(1)
where B is the primary magnetic field and DB is the magnetic field induced by the cylinder. Hence,DB/Bcan be defined in terms of the induced voltage in the detection coil (20) by
DB
B ~
DVi
V (2)
A constant k is defined as
k~ m0td 3
16
1
r02 { r0
2z2R2 r02zR2
ð Þ2
" #
(3)
By substituting Equations 3 and 2 into Equation 1, the phase of the total induced voltage hVi in the detection coil with respect to the voltage induced by the excitation magnetic field could be expressed as a function of the frequency and electrical parameters in the cylinder between the coils (19) by
hVi~arctg(
Im(DV)
VzRe(DV))~arctg(
{kvs kv2e
0erz1
) (4)
Because the phase change of current in the excitation coil was affected by the magnetic field induced by the cylinder, the phase in the excitation coil hVe could be estimated from the following expression (13)
hVe~arctg
Im( ZLzDZL
ZoutzZLzDZL
)
Re( ZLzDZL
ZoutzZLzDZL
whereZLrepresents the impedance of the excitation coil andZoutis the output impedance of the excitation source. The total phase shift between the voltages in the excitation and detection coils is given by the expression
Dh~hVi{hVe (6)
The total phase shiftDh, which is the measured MIPS, is produced by the cylinder perturbing the excitation field. In previous simulation experiments, the MIPS (i.e., Dh) was demonstrated to be directly proportional to the volume (18); hence, we could predict the volume of ACH as a function of the MIPS. On the basis of the theoretical estimates, an experimental setup was built to detect ACH (17,18).
Experimental setup to detect MIPS
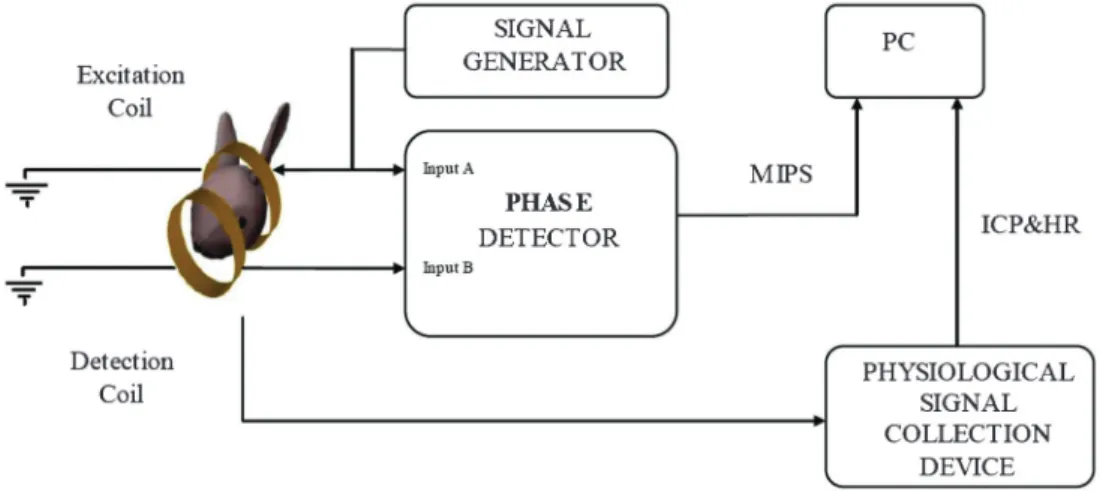
A system block diagram of the experimental setup that was built and used to detect the MIPS is shown in Figure 2. The system consists of seven modules: a signal generator, excitation coil, detection coil, phase detector, personal computer (PC), and equipment to collect and process biological signals.
The signal generator supplies a sinusoid signal Veof
approximately 5 V at 10.7 MHz. The resonance frequency of the generator-excitation coil system was determined experimentally to be centered on 7.65 MHz. This frequency was therefore excluded from the analysis. The range of output power from the generator was 1.5-33 dBm. The frequency stability was on the order of 10-4 and the signal-to-noise ratio in the excitation generator was 60 dB. The excitation and detection coils were coaxially placed. Both coils comprised ten turns with a radiusr of 5 cm, and the distance d between the coils was 11 cm. To avoid inductive pickup, the leads of the coils were twisted. The excitation coil induces a current in
the detection coil by magnetic induction and an MIPS whose magnitude depends on the conductivity of the rabbit brain. The main components of the phase detector were two band-pass filters, two differential amplifiers, an analog-to-digital converter, a field programmable gate array chip, a digital signal processor chip, flash memory chips, and a liquid crystal display module. The phase detector could be calibrated; the temperature drift and noise could be eliminated by the calibration software in the phase detector. The performance characteristics of the phase detector were as follows: range of phase measurement, 0-1806; phase resolution, 0.050; range of gain, ––10 to 35 dB; and duration of each measurement, 3-7 s. Measured data for a period of up to 12 h could be saved in the phase detector. The electrocardiograph (ECG) and ICP data collection device (6280C, Chengdu Instrument Factory, China) was controlled by a PC.
Surgical procedure
Six rabbits (2.2-3.8 kg, average weight 2.5 kg) in the experimental group (ACH) and four rabbits (2.3-2.7 kg, average weight 2.4 kg) in a control group were anesthe-tized with 5 mL/kg urethane (25%) via injection into the ear vein. We established models of ACH and edema by means of stereotactic methods. The coordinates for the brain were determined using a standard atlas (21). A short midline skin incision was made and the point for a stereotactic approach through the skull determined. The head was leveled, and positioned so that the bared bregma was 1.5 mm higher than lambda. With the position of the bregma as the reference point, the coronal zero plane (AP0) passed through the coronal suture. A1 and P1 were coronal planes 1 mm anterior and 1 mm posterior, respectively, to AP0. The scope of the internal capsule was between A5 and P2. We chose the P1 coronal plane to make a puncture point on the right
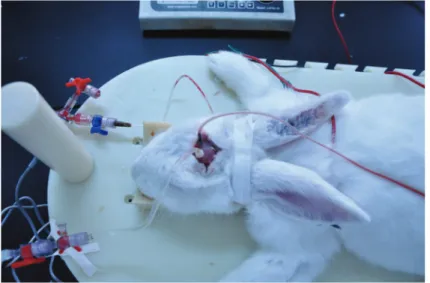
coronal suture (R = 6 mm) and posterior to the sagittal suture (P1, AP = 1 mm). A 1-mm drill bit was twisted by hand to perforate the skull. A needle (d = 0.7 mm) was then introduced to the proper depth (H = 13 mm). Autologous blood (1 to 3 mL) was slowly injected in the ACH group and the same volume of normal saline was injected in the control group. A physiological signal collection device (RM6280C, Chengdu Instrument Factory) was used to measure the changes in the ICP of rabbit brain (22) and heart rate (HR). As shown in Figure 3, rabbits were operated to monitor ICP and HR.
The Animal Experiments and Ethical Committee of our university approved all experimental protocols and the care of animals was carried out in accordance with the Declaration of Helsinki and International Association for the Study of Pain (IASP) guidelines (23,24).
Data processing and analysis
Data from the rabbits were obtained with a physio-logical signal collection device, and showed that HR, ICP and HR were stable throughout the experimental procedure. The MIPS signals recorded by the phase detector were collected synchronously with the ICP and ECG data acquired by the physiological signal collection device.
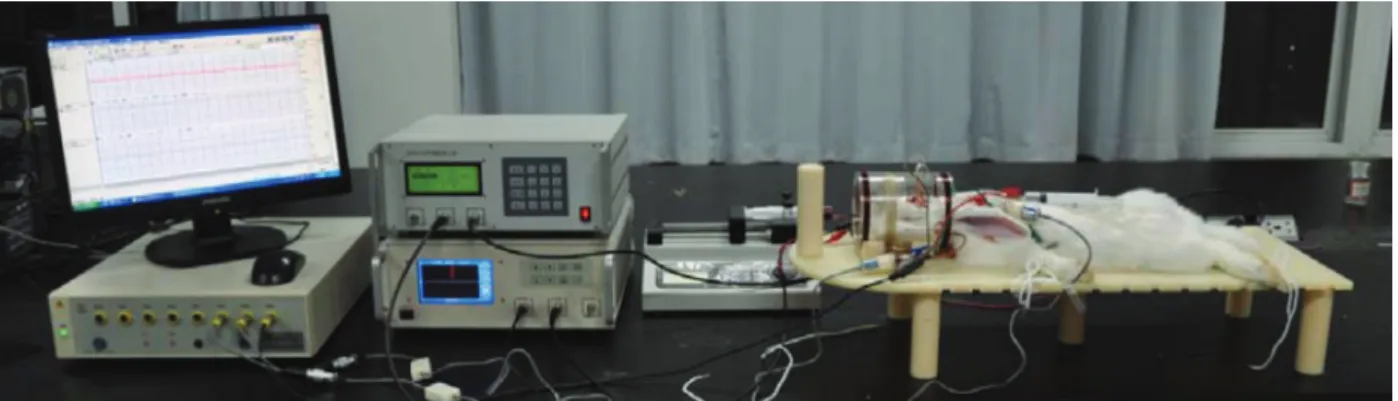
Figure 4 shows the experimental setup for detecting cerebral hemorrhage in the rabbits in the experiment group. ICP, HR, and MIPS were collected synchronously for comparison of the measured results; changes in the MIPS were recorded and compared with baseline measurements obtained after the surgical procedure. Experimental excitation and detection coils were coaxially placed around the heads of the rabbits. In all experiments, the coils were placed so that the head was centered between the excitation and detection coils. Changes in MIPS were recorded as a function of the injection volume. The key study hypothesis was that the changes in MIPS
measured with the detection coil would reflect the changes in electrical conductivity of the brain.
Baseline data obtained from a single ACH rabbit after the surgical procedure (t= 0) in a typical experiment are reported in Figure 5. Signals were continuously monitored for 1 h, during which a total of 3 mL autologous blood was injected by administration of three 1-mL injections given at 5-min intervals. The injection points are shown by red vertical bars. After each injection, the phase detector measured the MIPS for 5 min, collecting 70 data points. We selected 10 stable, continuous MIPS measurements before each subsequent injection, as shown by red circles. Overall, the MIPS and ICP showed an increasing trend as the injection volume increased. Some fluctua-tions in the MIPS due to the movement of rabbits were observed. These unstable data points were excluded from the data evaluation. The ICP and HR data were selected at the same times as the 10 MIPS measurements. Each data set was then averaged to eliminate interference in the data. The same data collection and processing methods were used with the control group.
Results and Discussion
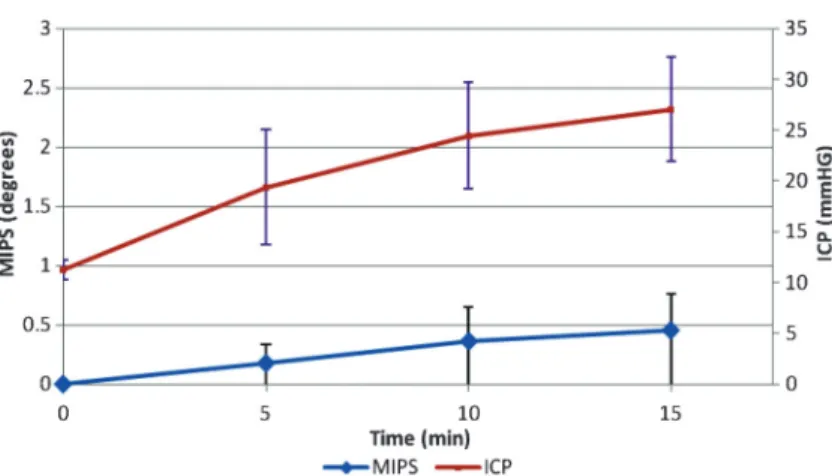
The average ICP and MIPS values obtained from 6 ACH rabbits at an excitation frequency of 10.7 MHz are reported in Figure 6. As the injection volume increased from 1 to 3 mL, the changes in both MIPS and ICP also increased. The slope of each curve was stable, and changes in both the MIPS and ICP were linearly related to the injection volume. The slope of each function reflected the sensitivity level. These results demonstrated that the MIPS method was a satisfactory, reliable, and feasible means to detect and monitor ACH. The MIPS system could detect a small amount of bleeding in the brain, with sensitivity higher than that of detecting changes in the ICP. Both the ICP and the MIPS increased with the
bleeding volume, and a change in the MIPS suggested a change in the ICP because the latter was directly proportional to the MIPS. A change in the MIPS might reflect changes in the cerebrospinal fluid and cerebral blood volumes, as reported previously in the literature (13). Our MIPS system is a non-invasive, non-contact method for detection of the volume of cerebral hemor-rhage.
Increase of either edema or ACH can cause an increase of ICP. As shown in Figure 7, the MIPS in the ACH group was significantly different from that of the control group. The MIPS data were analyzed in rabbits with stable HRs and vital signs. The average MIPS values in the 6 ACH rabbits in the experimental group increased to 0.6173±0.1976 degrees as the injection volume increased from 0 to 3 mL. Figure 7 also shows that MIPS changed from 0 to 0.041±0.0073 degrees for 4 rabbits from the control group due to the increase of edema volume. The change of MIPS in the experimental group was greater than in the control group. These results were expected with the MIPS method because the
conductivity of saline (0.281 s/m) is less than the conductivity of blood (1.101 s/m) at excitation frequency 10.7 MHz (17). The average conductivity of the brain during ACH is also less than that seen in brains with edema. The observed changes in conductivity reflect changes in MIPS, consequently the change of MIPS observed in the ACH group should be greater than that in the edema group.
Figure 6 also shows that the functional relationships of ICP and MIPS to the injection volumes were not identical. The slope of the MIPS was greater than that of the ICP during the early stages of hemorrhage, but this was reversed during later stages. This finding suggested that MIPS measurements would be useful as an early warning of an increase in ICP. Possible reasons for the differences in the observed behavior of ICP and MIPS include volume errors due to manual blood injection and physiological regulation of the cerebral blood flow (CBF) and cere-brospinal fluid (CSF).
Owing to damage of the skull and brain, cerebral hemorrhage and cerebral edema, the blood volume flow
Figure 4.Experimental setup to detect acute cerebral hemorrhage in rabbits with the magnetic induction phase shift method. The excitation and detection coils were coaxially placed.
rate in the animals used in the study was approximately 100-300mL (due to individual differences) within less than 1 h after the craniotomy. An animal hemorrhage model should take spontaneous intracerebral hemorrhage into consideration. The cerebral perfusion pressure remained largely unchanged.
We plan to use the NI-PXI design virtual instrument to improve the speed of the phase detector and ultimately achieve real-time monitoring (,5 ms) of the MIPS. We also plan to test different excitation frequencies as well as settings for the compensation coils. To improve this experimental rabbit model, we will need to examine different bleeding positions, means of inducing cerebral edema and hemorrhage, and to use large study popula-tions. The use of imaging methods to demonstrate the physiological regulating effects of CSF and CBF is necessary. For clinical applications, we need to ensure that the method meets safety regulations; furthermore, we will determine the optimal frequency and power. We plan to recruit more than 30 individuals to participate in a planned clinical study.
This study is the first to use animal experiments to demonstrate the relationship between ICP and changes of
MIPS. A comparison of the analytical and experimental results to those of previous studies (14,15) suggests that various physiological conditions in the brain, such as edema and ischemia, can be distinguished by analyzing the change in MIPS at specific frequencies. In this study, the MIPS curves were significantly related to the ICP curves. This observation suggests that in addition to continuous monitoring, the proposed method could be valuable for detection of early warning signs in emergency medicine and critical care units.
In future studies, we plan to optimize our system and the experimental scheme according to these results. We plan to perform up to 12 h or more of long-term monitoring. The inductance of the coils, and electrical conductivity of the rabbit brain were not calculated. Owing to time constraints, the sample size was small and there was no control group using traditional methods such as CT, MRI, or PET imaging. Further developments will be directed towards contrast research with established clinical methods.
Measuring changes in the MIPS as a function of volume after brain injury has the potential to become a simple method for early non-contact detection of the
Figure 6. Average intracranial pressure (ICP) and magnetic induction phase shift (MIPS) of 6 rabbits with acute cerebral hemorrhage as a function of time after the surgical procedure. The total injection volume increased from 0 to 3 mL during the 15-min period.
occurrence and progression of cerebral hemorrhage. Such a technique would certainly be useful in emergency medicine, critical care, and other clinical applications. In addition, the measuring device can be small and portable. This study is the first to clarify the relationships of ICP and MIPS to bleeding volume by using magnetic induc-tion. Because of the high sensitivity of MIPS measure-ments in the early stages of ACH, the method could be valuable for detecting early warning signs. Further studies
will be required to confirm the observations of this preliminary study.
Acknowledgments
Research supported by the National Natural Science Foundation of China (#61072254) and the Science and Technology Research Plan Project Foundation of Chongqing (#CSTC2012GG-YJS10013).
References
1. Wagner KR, Broderick JP. Hemorrhagic stroke: pathophy-siological mechanisms and neuroprotective treatments. In: Lo EH, Marwah J (Editors), Neuroprotection. Scottsdale: Prominent Press; 2001. p 471-508.
2. Naval NS, Nyquist PA, Carhuapoma JR. Management of spontaneous intracerebral hemorrhage.Neurosurg Clin N Am2008; 19: 415-423, v, doi: 10.1016/j.nec.2008.07.014. 3. Qureshi AI, Tuhrim S, Broderick JP, Batjer HH, Hondo H, Hanley DF. Spontaneous intracerebral hemorrhage.N Engl J Med 2001; 344: 1450-1460, doi: 10.1056/NEJM200105 103441907.
4. Kidwell CS, Chalela JA, Saver JL, Starkman S, Hill MD, Demchuk AM, et al. Comparison of MRI and CT for detection of acute intracerebral hemorrhage. JAMA2004; 292: 1823-1830, doi: 10.1001/jama.292.15.1823.
5. Otten DM, Onik G, Rubinsky B. Distributed network imaging and electrical impedance tomography of minimally invasive surgery.Technol Cancer Res Treat2004; 3: 125-134. 6. Granot Y, Ivorra A, Rubinsky B. A new concept for medical
imaging centered on cellular phone technology.PLoS One 2008; 3: e2075, doi: 10.1371/journal.pone.0002075. 7. Tarjan PP, McFee R. Electrodeless measurements of
the effective resistivity of the human torso and head by magnetic induction.IEEE Trans Biomed Eng1968; 15: 266-278, doi: 10.1109/TBME.1968.4502577.
8. Foster KR, Schwan HP. Dielectric properties of tissues and biological materials: a critical review.Crit Rev Biomed Eng 1989; 17: 25-104.
9. al-Zeibak S, Saunders NH. A feasibility study of in vivo electromagnetic imaging.Phys Med Biol1993; 38: 151-160, doi: 10.1088/0031-9155/38/1/011.
10. Korjenevsky AV, Cherepenin VA. Magnetic induction tomography.J Commun Technol El++1997; 42: 469-474. 11. Korjenevsky AV, Cherepenin VA. Progress in realization of
magnetic induction tomography.Ann N Y Acad Sci 1999; 873: 346-352, doi: 10.1111/j.1749-6632.1999.tb09482.x. 12. Griffiths H. Magnetic induction tomography.Meas Sci Technol
2001; 12: 1126-1131, doi: 10.1088/0957-0233/12/8/319. 13. Gonzalez CA, Villanueva C, Vera C, Flores O, Reyes RD,
Rubinsky B. The detection of brain ischaemia in rats by inductive phase shift spectroscopy.Physiol Meas2009; 30:
809-819, doi: 10.1088/0967-3334/30/8/006.
14. Gonzalez CA, Rubinsky B. A theoretical study on magnetic induction frequency dependence of phase shift in oedema and haematoma. Physiol Meas 2006; 27: 829-838, doi: 10.1088/0967-3334/27/9/006.
15. Gonzalez CA, Rubinsky B. The detection of brain oedema with frequency-dependent phase shift electromagnetic induction.Physiol Meas2006; 27: 539-552, doi: 10.1088/ 0967-3334/27/6/007.
16. Rojas R, Rubinsky B, Gonzalez CA. The effect of brain hematoma location on volumetric inductive phase shift spectroscopy of the brain with circular and magnetron sensor coils: a numerical simulation study. Physiol Meas 2008; 29: S255-S266, doi: 10.1088/0967-3334/29/6/S22. 17. Xu L, Qin MX, Jin G. Study of PSSMI for cerebral
hemorrhage detection: an experimental simulation. 4th International Congress on Image and Signal Processing. October 15-17, 2011, Shangai. p 266-268.
18. Jin G, Qin MX, Wang C. Experimental study on simulated cerebral edema detection with PSSMI.Commun Systems Inform Technol LNEE 2011; 100: 361-367, doi: 10.1007/ 978-3-642-21762-3_47.
19. Griffiths H, Stewart WR, Gough W. Magnetic induction tomography. A measuring system for biological tissues.Ann N Y Acad Sci 1999; 873: 335-345, doi: 10.1111/j.1749-6632.1999.tb09481.x.
20. Scharfetter H, Casanas R, Rosell J. Biological tissue characterization by magnetic induction spectroscopy (MIS): requirements and limitations. IEEE Trans Biomed Eng2003; 50: 870-880, doi: 10.1109/TBME.2003.813533. 21. Sawyer CH, Everett JW, Green JD. The rabbit diencephalon
in stereotaxic coordinates.J Comp Neurol1954; 101: 801-824, doi: 10.1002/cne.901010307.
22. Jing WL, Zhang XQ, Jin XL. Study on the model building of internal capsule hemorrhage and the changes of intracranial pressure and discharge of vagus nerve in rabbits.Shanxi Med J2007; 36: 18-21.
23. Declaration of Helsinki.Brit Med J1996; 313: 1448-1449. 24. Zimmermann M. Ethical guidelines for investigations of