Predictive Value of Short-term Forecasts of DNI for Solar
Energy Systems Operation
Francis M. Lopes
1, 2, a), Ricardo Conceição
1, 2, b), Hugo G. Silva
1, 2, c), Rui Salgado
2, d), Paulo Canhoto
2, e), Manuel Collares-Pereira
1, 2, f)1Renewable Energies Chair, University of Évora, IIFA, Palácio do Vimioso, Largo Marquês de Marialva, 7002-554, Évora, Portugal.
2Institute of Earth Sciences, University of Évora, Rua Romão Ramalho, 7000-671, Évora, Portugal.
a)Corresponding author: [email protected] b)[email protected]
c)[email protected] d)[email protected] e)[email protected] f)[email protected]
Abstract. Solar power forecasting plays a critical role in power-system management, scheduling, and dispatch operations.
Accurate forecasts of direct normal irradiance (DNI) are essential for an optimized operation strategy of concentrating solar thermal (CST) systems, particularly under clear-sky conditions during partly cloudy days. In this work, short-term forecasts from the radiative scheme McRad (Cycle 41R2) included in the Integrated Forecasting System (IFS), the global numerical weather prediction model of the European Centre for Medium-Range Weather Forecasts (ECMWF), together with in-situ ground-based measurements, are used in a simulated linear parabolic-trough power system through the System Advisor Model (SAM). Results are part of a preliminary analysis concerning the value of DNI predictions from the IFS for the improvement of the operationalization of a CST system with similar configurations as the Andasol 3 CST power plant. For a 365-day period, the present results show high correlations between predictions of energy to grid based on measurements and IFS forecasts mainly for daily values (~0.94), while the lower correlations obtained for hourly values (~0.89) are due to cloud representation of the IFS during overcast periods, leading to small deviations with respect to those from measurements. Moreover, as means to measure the forecasting skill of the IFS, daily and hourly skill scores based on local measurements and a persistence model are obtained (0.67 and 0.53, respectively), demonstrating that the IFS has a good overall performance. These aspects show the value that forecasted DNI has in the operation management of CST power systems, and, consequently, in the electricity market.
INTRODUCTION
Accurate predictions of DNI, i.e. the solar direct irradiance that is received on a plane normal to the sun’s rays over the total solar spectrum [1], are essential for CST power systems, mainly under clear-sky conditions during partly cloudy days [2, 3], allowing to reduce the uncertainty of solar plant outputs due to solar irradiance intermittency [4]. Forecasts of DNI can contribute for an efficient CST operation and management, which convert solar energy into thermal energy and then into electric energy. Such information is important for the operators of CST power plants since it allows to know, with a certain level of confidence, the energy output into the electrical grid for a given day and to anticipate the corresponding production price in the electricity market. Consequently, this allows the increase of the economic return during more demanding and valuable periods [5], reaching a higher level of profitability.
Current state-of-the-art Numerical Weather Prediction (NWP) models have inaccuracies in the representation of clouds (cloud cover and type) and atmospheric aerosols. This modeling issue leads to deviations in DNI forecasts,
since clouds and aerosols are the primary parameters that affect the variation of DNI in space and time due to the processes of scattering and absorption of irradiance, including those that result from the interaction with cloud microphysical and dynamical processes [6]. For instance, high altitude clouds such as cirrus can suppress DNI almost to zero [7], while in the case of aerosols, DNI reductions in the order of 80-90% can be observed due to extreme desert dust events [8, 9]. However, such model inaccuracies can be corrected through the use of post-processing bias-correction procedures such as that performed by [10], in which DNI predictions from the IFS are shown with satisfactory results. Moreover, accurate solar forecasts also have a dependency on the forecast horizon, since forecasting uncertainty tends to decrease with the reduction of the latter. For electrical grid operators, intra-day and day-ahead forecasts are essential to ensure stable grids and to enhance the power supply quality by reducing energy losses and energy fluctuations. This has been a recent standard practice in Europe (e.g. Spain and Germany), as one example being the 11 MWe commercial solar thermal power plant in Sevilla, Spain [11].
Having into account the aforementioned aspects, the DNI predictions from the IFS (ECMWF) are analyzed against in-situ measurements in a 24-hour forecast horizon, which are used here to predict the energy output of a CST power plant modeled through the System Advisor Model (SAM) software [12], developed by the U.S. Department of Energy and National Renewable Energy Laboratory (NREL). This exercise can enable the output of the respective annual performance and financial metrics from a CST power plant which includes the effect that DNI and meteorological variables have in a CST power system efficiency. Here, a case study concerning a linear parabolic-trough system with similar configurations as the Andasol 3 CST project power plant (Granada, Spain) is presented. As a first step, this validation method aims to be a contribution to understand how to improve the overall performance of a solar unit, having the potential to be adapted to any other type of power plant system and appropriated region in the world.
DATA
One year of in-situ ground-measured and forecasted data, based in a 24-hour prediction horizon from the IFS, are analyzed here for a 365-day period, from April 1st 2016 to March 31st 2017. Both measured and forecasted time-series include irradiance and meteorological data which are used as input parameters for the SAM power plant model in order to calculate the corresponding energy production.
Continuous measured data gathered from one of twelve radiometric stations of an existing national network in Portugal [13] is used here. This network, which was designed and installed for DNI resource mapping, will also contribute for the operationalization of solar power plants, as part of the DNI-A project (reference ALT20-03-0145-FEDER-000011). The selected ground-based measuring station (EVO) is located in Évora city (N38.567686, W7.91172), installed on the top of a research building of the Institute of Earth Sciences, in the southern region of Portugal. The climate of this region is of the Mediterranean type (Csa, based on the Köppen classification) with maximum temperatures that generally can go from 31˚C to 35˚C during the summer months of July and August, and occasionally reaching values above 40˚C [14]. The region is characterized in general by a clean atmosphere and has exceptional conditions for harvesting of solar energy since it has one of the highest solar resource potentials in Europe with a DNI annual availability over 2100 kWh/m2/year [13]. The DNI measurements were performed using a CHP1 pyrheliometer from Kipp & Zonen, being attached to a SOLYS2 Sun-Tracker. The pyrheliometer has been calibrated every 2 years, following the International Organization for Standardization (ISO) 9059:1990 [15], and is a First-Class instrument according to the ISO 9060:1990 [16], with an estimated uncertainty on a daily basis of < 1%. The EVO station is considered to be a reference station in the entire national network since it has been having a regular maintenance protocol with daily cleaning and standard data quality control since February 2015 [17]. Moreover, other relevant meteorological parameters were also measured near the Sun-Tracker with standard high-quality instruments. The measured DNI, and local meteorological parameters such as air temperature (˚C), relative humidity (%), atmospheric pressure (hPa) and wind speed (m/s), were acquired on a minute sampling rate and then averaged. The hourly time-series for atmospheric pressure was obtained from the ground-based measuring station of the Portuguese Meteorological Service (Instituto Português do Mar e da Atmosfera, IPMA) near Évora (N38.536542, W7.887958), since no atmospheric pressure data was available for the considered period of study in the EVO station.
The quality of DNI 24-hour forecasts for the region of study has been recently assessed in [18]. The IFS (cycle 41R2) results showed a mean annual overall overestimation against measurements of DNI for the same period of the present work. It was also demonstrated that DNI predictions are mainly hindered due to the representation of clouds and aerosols used in the IFS, since these two parameters strongly affect the predicted DNI. In the case of partly cloudy days, the IFS tends to overestimate the radiative effect of clouds while during clear-sky days under very clean atmospheric conditions it shows an underestimation of the radiative effect of aerosols due to use of a mean monthly
aerosol climatology. Nonetheless, taking these aspects into account, the forecasted DNI showed a general good agreement with ground-based measurements, with relative differences for DNI in various locations within the region raging between ~7% and ~12%. In this work, the first 24-hour predictions of the 0000 UTC IFS run were used here with an average grid resolution of 9 km (0.125˚ x 0.125˚). During the forecast time, the predicted projection of DNI in a horizontal surface (represented by the fdir parameter of the IFS) is an accumulated value (irradiation, in J/m2), which was then converted to mean irradiance values (W/m2), before being used in SAM. Additionally, in order to
obtain the predicted DNI, hourly values of fdir divided by averaged local cosine of 1-minute solar zenith angle (CZA) values were calculated.
SAM MODEL
The System Advisor Model (SAM), version 2017.9.5 [19], from NREL, is used here in a preliminary analysis to validate the predicted value of DNI forecasts from the IFS for CST power systems operation managing. The power plant model can generate hourly calculations through a physical (thermos-electric) and financial model, allowing to compute the respective annual efficiency and financial metrics of renewable energy systems, such as for CST systems. Predictions of energy output and cost estimations are generated for a given power plant, parameterized through several input parameters for each run, e.g. type of installation and system design variables. DNI and meteorological parameters at the project location are also needed in order to generate the hourly outputs. These outputs include a wide range of metrics, such as the annual electricity production of a power plant, detailing the respective annual efficiency. It should be noted that SAM calculates hourly outputs based on the CZA starting at January 1st. In the present work, to overcome
this aspect, the period between January 1st and March 31st 2017 was concatenated at the beginning of the input time-series for the SAM simulation. In this study, a CST physical linear parabolic-trough system of a 50 MWe power plant
with a similar configuration as the operational Spanish Andasol 3 CST project [20] is simulated. Such configuration is limited to some extent since the amount of available information concerning the characteristics of the Andasol 3 power plant is less than the available optional setup parameters of SAM. For that matter, unknown input configurations are set as default parameters for a generic CST power plant in SAM. Additionally, and for reference in the present study, the Andasol 3 CST power plant has an estimated electricity generation of 175.000 MWh/year.
METHODOLOGY
As common practice for data control quality check, adapted filters for the considered local measurements were applied prior to analysis. These include basic filters for solar irradiance records and gap-filling techniques due to the presence of possible missing periods of recording caused by any instrumental malfunction. Considering a 365-day period, the raw measured data showed a percentage of missing data of ~0.05% and ~0.01% for the local meteorological and DNI data, respectively. This highlights the high-quality data that the EVO station has, particularly for DNI measurements. A list of data quality filters that were considered for the present analysis is indicated below:
1. Zero or positive DNI values.
2. DNI values above positive CZA values.
3. DNI values below the radiation on the top-of-atmosphere (TOA). 4. DNI values below the physical possible limits (BSRN-QFPPL, [21]).
5. Gap-filling with linear interpolation for missing periods less or equal than 2 hours. 6. Gap-filling with data from the nearest station for missing periods above 2 hours.
The second filter has also been applied to the IFS data, considering the CZA of the nearest IFS grid point to the corresponding measuring location. Regarding the sixth filter, the nearest measuring station used to fill possible data gaps in EVO for the same period, is located in Mitra (N38.530522, W8.011221), in the outskirts of Évora city, about 13 km apart. The total solar irradiance at TOA is defined here as the total power from the Sun at the average Earth-Sun distance, 1361 W/m2 accordingly to [22].
Additionally, the forecasting metric mean square error skill score (SS) is used in this analysis as means to measure the forecasting skill of the IFS predictions in order to quantify their inaccuracies [23]. The SS is usually calculated using the root mean square error (RMSE), a recommended statistical metric for the application of electricity grid management issues [2], since only large errors are significant to the safety of the electrical grid system. In the context of this work, the SS is computed as the decrease in the mean square error (MSE) of the forecast with respect to a reference, i.e. a persistence model time-series that is obtained here by persisting previous observational values over
the forecast horizon (i.e. 24 hours). Skill values equal to one mean that results are close to a perfect forecast, negative values are related to a lower performance of the forecast model as compared to the persistence model, while zero values show that there is no improvement over the reference. The SS, as function of the MSE, can be calculated as shown by [24]: 𝑆𝑆 = 1 −%&'%&'()* +,* , (1) 𝑀𝑆𝐸 = 𝑅𝑀𝑆𝐸2=3 4 × [𝐼 𝑗 − Î 𝑗 ] 2 4 ;<3 , (2)
where MSEfor and MSEper are the corresponding error metrics for the forecast and the persistence, while I(j) and Î(j)
are the measured and the forecasted value at time j, respectively, and n the number of assessed pairs.
RESULTS AND DISCUSSION
The focus of this work concerns the value of 24-hour horizon forecasts of DNI for a 365-day period, as means to improve the management of operational CST power systems. To this end, an important quantity to know is the daily electric energy demand that an electrical grid operator has to handle on a daily basis. The electricity generated by a CST power plant with similar characteristics as those of the Andasol 3 power plant can be estimated by the software SAM through the output parameter energy injection to the grid EG (MWh).
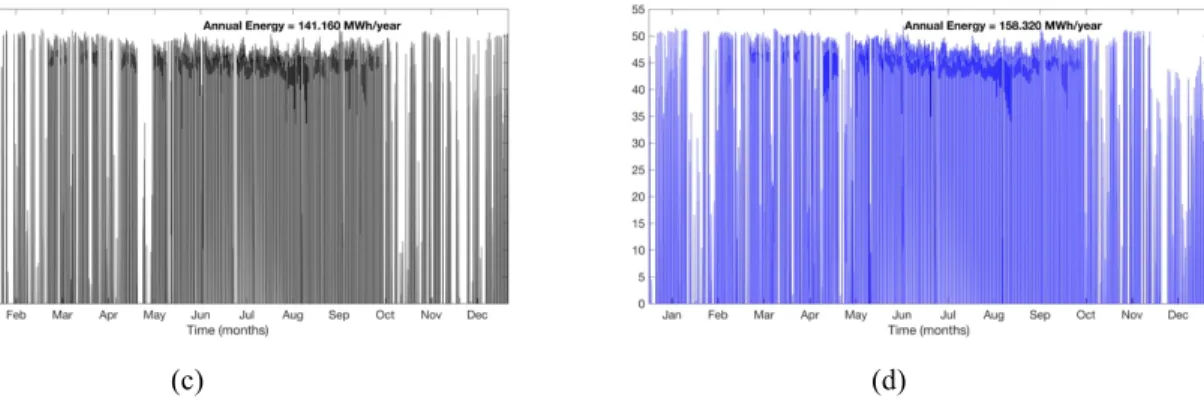
Hourly values of EG based on measured and forecasted data are depicted in Fig. 1, together with the respective
DNI. As expected, it is during the summer months that more electricity is generated and stored due to: i) higher frequency of clear-sky days with high DNI availability; ii) an increase in the number of sun hours during the day (an important feature for the total energy production); and iii) smaller CZA and a thinner air mass. The opposite case occurs during the winter months, where the EG tends to be lower and, in some cases, almost zero due to a higher
occurrence of overcast periods which can prevail during several consecutive days. During these periods is when the IFS clearly shows difficulties in representing clouds which, consequently, leads to lower values of EG than the ones
obtained with measurements. In general, the EG based on forecasted data shows an overestimation of ~17.159 MWh
of the total annual energy against EG based on measurements, i.e. a relative difference of ~12.16%. This is a
consequence of the annual DNI overestimation depicted by the IFS, which is here transferred to the energy output of a CST power plant through a non-linear transfer function (thermo-electric model) including the effect of other meteorological variables, namely the air temperature and wind speed that affect the system efficiency. The total annual energy values obtained are ~141.160 MWh/year and ~158.320 MWh/year for measurements and IFS, respectively. Although with small deviations in relation to the referenced annual energy generation of the Andasol 3 CST power plant (175.000 MWh/year), the IFS total annual energy based EG are closer than the ones obtained with measurements.
These deviations result mainly from the fact that the simulated power plant is not using exactly all the same configurations as the Andasol 3 CST, since such information is not available. For instance, different turbines are being used or the stored energy in SAM is not being used during consecutive overcast days as oppose to the stored energy used for the Andasol 3 CST (as part of any particular optimization operation). A limit for the energy generated in SAM is also considered, which is clearly seen during the summer months in both measured and forecasted EG, meaning
that more energy could be produced during this period instead.
(c) (d)
FIGURE 1. Direct Normal Irradiances, DNI (W/m2), from measured (a) and IFS forecasted data (b) in EVO station (Évora,
southern Portugal) together with the respective energy injection to the grid, EG (MWh), (c) and (d), calculated through SAM.
Period of study relates April 1st 2016 to March 31st 2017.
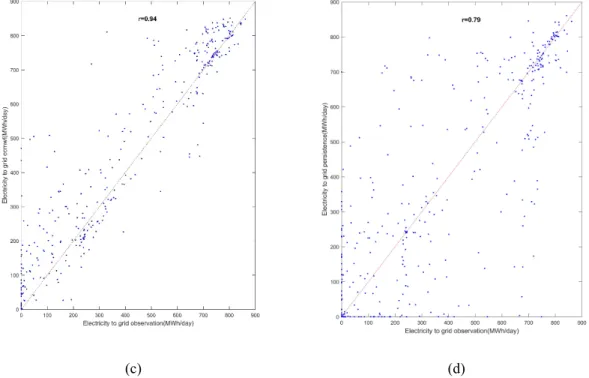
A closer comparison for the hourly and daily values of EG obtained through measurements, IFS and the persistence
model (Fig.2) shows a significantly higher correlation (r) between EG based on measured and forecasted data, mainly
for daily values where a correlation of 0.94 (Fig.2 c) is found, while for the daily correlation of the persistence model, a lower value is obtained, 0.79 (Fig.2 d). On the other hand, for the hourly values, correlations of 0.89 (Fig.2 a) and 0.75 (Fig.2 b) are obtained. The lower correlations result from the fact that hourly values can induce more errors, mainly during overcast periods in which the IFS predictions still need to be improved regarding cloud representation. It is in the range of 40-50 MWh that there is a better correspondence (Fig.2 a and b) between the various EG hourly
values. This is shown by a high frequency of occurrences of values, which are related to periods of clear-sky conditions, while a higher dispersion occurs for lower EG values, corresponding to cloudy periods. It should be noted
that the zero values found in the hourly results are due to shutdown periods, which are evident in EG based on both
measurements and IFS forecasts, being related to unusable stored energy.
(c) (d)
FIGURE 2. Energy injection to the grid, EG (MWh), based on DNI measurements, persistence model and IFS forecast model.
Hourly (a, b) and daily (c, d) results are shown for EVO station (Évora, southern Portugal). Corresponding correlation coefficient, r, is also depicted. Period of study relates April 1st 2016 to March 31st 2017.
In Table 1, a statistical summary for both hourly and daily values of EG is presented. In general, the IFS forecast
model tends to overestimate the EG, as shown by the negative values of MBE. However, the IFS also depicts a better
performance than the persistence model, with lower RMSE values. The calculated SS (based on the MSE) are above 0.5, particularly for the daily values (0.67), which prove that the IFS forecast model performs better than the persistence model. This means that, with the appropriated post process techniques of forecasted DNI data, the use of NWP modeling in a CST power plant system is potentially a valuable tool for an efficient management of CST power systems operations.
TABLE 1. Statistical summary of the energy injection to the grid, EG (MWh), obtained through SAM based on measurements
(Obs), IFS forecasts (IFS) and persistence model (Per) for EVO station (Évora, southern Portugal). Correlation (r), root mean square error (RMSE), mean bias error (MBE), mean absolute error (MAE) and the (dimensionless) skill score (SS) of the hourly
and daily results (MWh) are shown. Period of study relates April 1st 2016 to March 31st 2017.
Hourly Daily
EG (Obs) – EG (IFS) EG (Obs) – EG (Per) EG (Obs) – EG (IFS) EG (Obs) – EG (Per)
r 0.89 0.75 0.94 0.79 RMSE 10.35 15.03 111.18 192.78 MBE -1.96 -4.88x10⁻¹⁷ -47.01 1.59x10⁻¹⁶ MAE 3.63 6.01 72.82 127.66 SS 0.53 0.67
CONCLUSIONS
Measured and IFS forecasted DNI were used in this work to simulate the energy production of a real linear parabolic-trough power system with the purpose of contributing to improve the operation of CST power plant systems. Results of energy injection to the grid, EG, an important quantity to know for the day-ahead operations of a CST power
0.89 and 0.94 for the hourly and daily predicted energy generation, respectively. A good overall performance by the IFS has been shown despite the current difficulties that NWP models have in predicting DNI during overcast periods. Work progress for the near future will include: i) in the use of an upgraded version of the radiative scheme used here, McRad (Cycle 41R2), named ecRad (Cycle 43R3) which has recently become operational in July 11th 2017 [25].
This improvement contains a more efficient radiative code to perform deterministic predictions of DNI and also uses an aerosol data assimilation system through the Copernicus Atmosphere Monitoring Service (CAMS) instead of the previous aerosol monthly means; ii) unlike the previous analysis carried out by the authors, the incident radiation on a plane normal to the Sun’s direction (drsp) will be used, thus allowing to minimize possible error calculations; and iii) a more robust statistical analysis that includes the simulation of different types of CST power systems with higher number of input parameters from real power plants in the SAM software. These aspects will certainly allow for higher levels of confidence to be reached when using forecasted DNI in CST power systems.
ACKNOWLEDGMENTS
This work was co-funded by the European Union through the European Regional Development Fund, framed in COMPETE 2020 (Operational Program Competitiveness and Internationalization), through the Institute of Earth Sciences (UID/GEO/04683/2013) with reference POCI-01-0145-FEDER-007690, and through the projects DNI-A (ALT20-03-0145-FEDER-000011), ALOP (ALT20-03-0145-FEDER-000004) and INSHIP (H2020, grant agreement 731287). The initial recommendations of T. Fasquelle, P. Gilman (SAM Support) and R. Hogan, is recognized and appreciated. The authors are also thankful for the availability of the ECMWF and the Portuguese Meteorological Service (IPMA) in providing data. F. M. Lopes is thankful for the FCT scholarship (SFRH/BD/129580/2017), R. Conceição to the FCT scholarship (SFRH/BD/116344/2016), and H. G. Silva to DNI-A and INSHIP for his research contract.
REFERENCES
1. P. Blanc, B. Espinar, N. Geuder, C. Gueymard, R. Meyer, R. Pitz-Paal, B. Reinhardt, D. Renné, M. Sengupta, L. Wald, S. Wilbert, “Direct Normal Irradiance Related Definitions and Applications: The Circumsolar Issue”, Solar Energy, 110, pp. 561-577, doi: 10.1016/j.solener.2014.10.001, 2014.
2. M. Schroedter-Homscheidt, A. Benedetti, and N. Killius. “Verification of ECMWF and ECMWF/MACC’s Global and Direct Irradiance Forecasts with Respect to Solar Electricity Production Forecasts”, Meteorologische Zeitschrift, PrePub Article, doi: 10.1127/metz/2016/0676, 2016.
3. M. Collares-Pereira, A. Rabl. “Simple Procedure for Predicting Long Term Average Performance of Nonconcentrating and Concentrating Solar Collectors”, Solar Energy, 23, pp. 235-253, 1979.
4. W. Law, Edward and Prasad, Abhnil and Kay, Merlinde and Taylor, Robert. “Direct Normal Irradiance Forecasting and Its Application to Concentrated Solar Thermal Output Forecasting – A Review”, Solar Energy,
108, pp. 287-307, doi: 10.1016/j.solener.2014.07.008, 2014.
5. L. Ramirez, J. M. Vindel, “Forecasting and Nowcasting of DNI for Concentrating Solar Thermal Systems”, Advances in Concentrating Solar Thermal Research and Technology, Chapter 13, pp. 294-310, doi:10.1016/B978-0-08-100516-3.00013-7, 2017.
6. J. Fan, “Review of Aerosol-Cloud Interaction: Mechanisms, Significance, and Challenges. American meteorological Society, Vol. 73, pp. 4221-4252. doi: 10.1175/JAS-D-16-0037.1, 2016.
7. S. Quesada-Ruiz, Y. Chu, J. Tovar-Pescador, H. T. C Pedro, C. F. M. Coimbra, “Cloud-Tracking Methodology for Intra-Hour DNI Forecasting”, Solar Energy, 102, pp. 267-275. doi: 10.1016/j.solener.2014.01.030, 2014. 8. R. Conceição, H. G. Silva, J. Mirão, M. Gostein, L. Fialho, L. Navarte, M. Collares-Pereira, “Saharan Dust
Transport to Europe and its Impact on the Photovoltaic Performance: A Case Study of Soiling in Portugal”, Solar Energy, 160, pp. 94-102. doi: 10.1016/j.solener.2017.11.059, 2018.
9. P. G. Kosmopoulos, S. Kazadzis, M. Taylor, E. Athanasopoulou, O. Speyer, P. I. Raptis, E. Marinou, E. Proestakis, S. Solomos, E. Gerasopoulous, V. Amiridis, A. Bais, and C. Kontoes, “Dust Impact on Surface Solar Irradiance Assessed with Model Simulations, Satellite Observations and Ground-based Measurements”, Atmos. Meas. Tech. Discuss, doi: 10.5194/amt-2017-79, 2017.
10. A. Troccoli, J.-J. Morcrette, “Skill of Direct Solar Radiation Predicted by the ECMWF Global Atmospheric Model over Australia. American Meteorology Society, pp. 2571-2587. doi: 10.1175/JAMC-D-14-0074.1, 2014.
11. M. Wittman, H. Breitkreuz, M. Schroedter-Homscheidt, and M. Eck, “Case Studies on the Use of Solar Irradiance Forecast for Optimized Operation Strategies of Solar Thermal Power Plants”, IEEE J-STARS, 1, No.1, doi: 10.1109/JSTARS.2008.2001152, 2008.
12. N. Blair, A. Dobos, J. Freeman, T. Neises, M. Wagner, T. Ferguson, P. Gilman, S. Janzou, “System Advisor Model, SAM 2014.1.14: General Description. NREL/TP-6A20-61019”, National Renewable Energy Laboratory, Golden, CO, 2014. Accessed October 31, 2016.
13. A. Cavaco, H. G. Silva, P. Canhoto, T. Osório, M. Collares-Pereira, “Progresses in DNI Measurements in Southern Portugal”, Solar Paces 2017, AIP Conf. Proc., 2017. Submitted for publication.
14. F. Lopes, H. G. Silva, R. Salgado, M. Potes, K. Nicoll, R. G. Harrison, “Atmospheric Electric Field Measurements Near a Fresh Water Reservoir and the Formation of the Lake Breeze”, Tellus, 68:31592. doi: 10.3402/tellusa.v68.31592, 2016.
15. ISO 9059:1990, Solar energy – Calibration of field pyrheliometers by comparison to a reference pyrheliometer, International Organization for Standardization (www.iso.org/standard/16628.html), 2014.
16. ISO 9060:1990, Solar energy –Specification and classifications of instruments for measuring hemispherical solar and direct solar radiation, International Organization for Standardization (www.iso.org/standard/16629.html), 2003.
17. P. Canhoto, “Preliminary Analysis of Irradiance Data for the Generation of a Typical Solar Radiation year for Évora, Portugal”, Technical Report, Institute of Earth Sciences, University of Évora, Évora, Portugal. doi: 10.13140/RG.2.2.12258.94401, March 2016.
18. F. M. Lopes, H. G. Silva, R. Salgado, A. Cavaco, P. Canhoto, M. Collares-Pereira, “Short-term Forecasts of GHI and DNI for Solar Energy Systems Operation: Assessment of the ECMWF Integrated Forecasting System in Southern Portugal”, Solar Energy, 170, pp. 14-30, doi: 10.1016/j.solener.2018.05.039, 2018.
19. The System Advisor Model (SAM), version 2017.9.5, www.sam.nrel.gov/content/downloads, NREL 2018. 20. The Andasol 3 CST project (Granada, Spain), www.nrel.gov/csp/solarpaces/project_detail.cfm/projectID=117,
NREL 2018.
21. C. N. Long, and E. G. Dutton: BSRN Global Network recommended QC tests, V2.x, Bremerhaven, PANGAEA, 2010.
22. S. K. Solanki, N. A. Krivova, J. D. Haigh, “Solar Irradiance Variability and Climate”, Annu. Rev. Astrono. Astrophys, 51, pp. 311–351. doi: http://dx.doi.org/10.1146/annurev- astro-082812-141007, 2013.
23. C. Coimbra, J. Kleissl, and R. Marquez, “Overview of Solar Forecasting Methods and a Metric for Accuracy Evaluation”, Solar Resource Assessment and Forecasting, Chapter 8, pp. 183-185, Elsevier, Waltham, Massachusetts.
24. R. Perez, E. Lorenz, S. Pelland, M. Beauharnois, G. V. Knowe, K. Hemker Jr., D. Heinemann, J. Remund, S. C. Müller, W. Traunmüller, G. Steinmauer, D. Pozo, J. A. Ruiz-Arias, V. Lara-Fanego, L. Ramirez-Santigosa, M. Gaston-Romero, L. M. Pomares, “Comparison of Numerical Weather Prediction Solar Irradiance Forecasts in the US, Canada and Europe”, Solar Energy, 94, pp. 305–326, doi: 10.1016/j.solener.2013.05.005, 2013. 25. European Centre for Medium-Range Weather Forecasts (ECMWF) Newsletter 2017, Shinfield Park, Reading,