Universidade de Aveiro Departamento deElectr´onica, Telecomunica¸c˜oes e Inform´atica, 2015
Marina Daniela
da Cruz Jord˜
ao
Universidade de Aveiro Departamento deElectr´onica, Telecomunica¸c˜oes e Inform´atica, 2015
Marina Daniela
da Cruz Jord˜
ao
Sistemas de Caracteriza¸
c˜
ao para Aplica¸
c˜
oes RFID
Characterization Systems for RFID Applications
Disserta¸c˜ao apresentada `a Universidade de Aveiro para cumprimento dos requesitos necess´arios `a obten¸c˜ao do grau de Mestre em Engenharia Electr´onica e Telecomunica¸c˜oes, realizada sob a orienta¸c˜ao cient´ıfica do Pro-fessor Doutor Nuno Miguel Gon¸calves Borges de Carvalho, Professor Cat-edr´atico do Departamento de Electr´onica, Telecomunica¸c˜oes e Inform´atica da Universidade de Aveiro e sob co-orienta¸c˜ao cient´ıfica do Doutor Pe-dro Miguel Duarte Cruz, Investigador Doutorado do Instituto de Telecomu-nica¸c˜oes, pol´o de Aveiro
o j´uri / the jury
presidente / president Professor Doutor Jo˜ao Nuno Pimentel da Silva Matos
Professor Associado do Departamento de Electr´onica, Telecomunica¸c˜oes e In-form´atica da Universidade de Aveiro
vogais / examiners committee Professor Doutor Rafael Ferreira da Silva Caldeirinha
Professor Coordenador do Departamento de Engenharia Electrot´ecnica da Escola Superior de Tecnologia e Gest˜ao do Instituto Polit´ecnico de Leiria (arguente)
Professor Doutor Nuno Miguel Gon¸calves Borges de Carvalho
Professor Catedr´atico do Departamento de Electr´onica, Telecomunica¸c˜oes e In-form´atica da Universidade de Aveiro (orientador)
agradecimentos / acknowledgements
Um agradecimento especial aos meus pais e irm˜a por todo o apoio prestado afim de alcan¸car os meus objetivos.
Agrade¸co tamb´em a toda a minha fam´ılia e amigos pelo apoio cont´ınuo em todo o meu percurso acad´emico.
A todos os meus colegas e amigos, que tive o prazer de conviver durante o meu percurso na Universidade de Aveiro, um grande obrigado, pois sem a vossa ajuda e for¸ca esta etapa teria sido bem mais complicada.
Muito obrigado ao meu orientador, Professor Doutor Nuno Miguel Gon¸calves Borges de Carvalho, ao meu co-orientador, Doutor Pedro Miguel Duarte Cruz e ao colaborador, Investigador Diogo Carlos Alcobia Ribeiro, por todo incentivo, disponibilidade e ajuda durante toda a realiza¸c˜ao desta disserta¸c˜ao.
Um agradecimento especial ao Jo˜ao Santos e ao Andr´e Prata, assim como, a todos os membros do Instituto de Telecomunica¸c˜oes, por todo o aux´ılio prestado.
Palavras-Chave Radio Communication, Wireless Power Transmission, Energy Harvesting, RF-DC, Mixed-Domain, PXI, LabVIEW, RFID
Resumo Esta disserta¸c˜ao surge no ˆambito da colabora¸c˜ao do Instituto de Teleco-munica¸c˜oes com a National Instruments (NI), com o intuito de desen-volver solu¸c˜oes de caracteriza¸c˜ao e medida para conversores RF-DC. Estas solu¸c˜oes de caracteriza¸c˜ao pretendem garantir uma otimiza¸c˜ao deste tipo de circuitos, que ´e a base dos sistemas de Wireless Power Transmission and Electromagnetic Energy Harvesting.
Pretende-se assim recorrer a c´odigo Laboratory Virtual Instrumentation En-gineering Workbench (LabVIEW) e aos m´odulos PCI eXtensions for Instru-mentations (PXI) da NI com o objetivo extrapolar estes sistemas de medida para aplica¸c˜ao de leitura e medida de Tags Radio Frequency Identifica-tion (RFID).
Assim sendo, nesta disserta¸c˜ao pretende-se desenvolver um sistema de car-acteriza¸c˜ao do RFID usando o LabVIEW, ou seja, um leitor de RFID.
Palavras-Chave R´adio Comunica¸c˜oes, Wireless Power Transmission, Energy Harvesting, RF-DC, Mixed-Domain, PXI, LabVIEW, RFID
Abstract This dissertation has the collaboration of the Telecommunications Institute with National Instruments, in order to develop solutions for characterization and measurement for RF-DC converters. These characterization solutions are intended to ensure optimization of this type of circuit, which is the ba-sis of Wireless Power Transmission and Electromagnetic Energy Harvesting systems.
It is intended to use LabVIEW code and the PXI modules from NI with the goal of extrapolating these measurement systems to read and measure the RFID Tags.
Therefore, this dissertation is focused on RFID characterization using the LabVIEW, in other words, RFID reader.
Contents
Contents i List of Figures v List of Tables ix List of Acronyms xi 1 Introduction 1 1.1 Motivation . . . 21.1.1 LabVIEW-Based UHF RFID Tag Test and Measurement System Review 2 1.1.2 Advanced RFID Measurements: Basic Theory to Protocol Conformance Test Review . . . 3
1.2 Objectives . . . 3
1.3 Organization of the Dissertion . . . 4
1.4 Original Contributions . . . 4 2 Technical Background 5 2.1 RF Communications . . . 5 2.2 PXI Platform . . . 6 2.2.1 PXI Modules . . . 7 NI 5792 . . . 7 NI 5793 . . . 7 NI PXI 5652 . . . 8 2.2.2 NI myDAQ . . . 8 2.3 LabVIEW Programming . . . 8 2.4 RFID Theory . . . 10 2.4.1 Operating Mode . . . 10
2.4.2 Types RFID Tags . . . 10
2.4.3 Frequency Bands and Protocols . . . 11
2.4.4 Power Transmit Mask . . . 11
2.4.5 Relevance to the Internet of Things . . . 14
2.5 Protocol RFID ISO 18000-6C . . . 14
2.5.1 Modulation . . . 15
2.5.2 Pulse Internal Encoding . . . 16
2.5.3 FM0 and Miller encoding . . . 17
2.5.5 Protocol commands . . . 20
ACK . . . 20
NAK . . . 20
PC, EPC and PacketCRC . . . 20
Query . . . 21
QueryAdjust . . . 21
QueryRep . . . 21
RN16 . . . 21
2.5.6 Power Transmit Mask . . . 21
2.5.7 Link Timing . . . 23
2.5.8 Backscatter Link Rates and CRC . . . 24
2.5.9 Short Protocol Overview . . . 26
3 Architectures and Specifications 29 3.1 Stimulus-Response Architecture . . . 30
3.2 Real-Time Interrogator Emulation Architecture . . . 34
3.3 Specifications . . . 38
3.4 Application Use Case (Spectrum Analyzer) . . . 38
3.5 RF-DC measurement system . . . 39
4 Implementation 41 4.1 Commands Development for R→T Communication . . . 41
4.1.1 Development of the Preamble and the Frame-sync . . . 41
4.1.2 Development of Query Command . . . 43
4.1.3 Development of ACK Command . . . 44
4.2 Low Pass Filter for R→T Communication . . . 45
4.3 IQ Modulator . . . 45
4.4 VSG and VSA Configuration . . . 47
4.5 Decoding Information from Tag T→R . . . 47
4.5.1 Tag Information Decoding . . . 48
Square . . . 49
Low pass Filter . . . 50
Decimation . . . 50
High Pass Filter . . . 51
4.5.2 Autocorrelation . . . 52
4.5.3 FM0 Decoding . . . 52
4.6 Application Use Case (Spectrum Analyzer) Implementation . . . 53
4.7 RF-DC measurement system . . . 54
5 Results 57 5.1 Commands Validation . . . 57
5.2 Stimulus-Response Architecture Results . . . 59
5.2.1 Distance Measures for Reader and Tag Communication . . . 61
5.2.2 Short Architecture Conclusion . . . 64
5.3 Real-Time Interrogator Emulation Architecture Results . . . 64
5.3.1 Distance Measures for Reader and Tag Communication . . . 65
5.4 Comparison Between Stimulus-Response and Real-Time Interrogator
Emula-tion Architectures . . . 68
5.5 Power Transmit Mask . . . 70
5.6 Application Use Case (Spectrum Analyzer) Results . . . 70
5.7 RF-DC measurement system . . . 73
6 Conclusions and Future Work 75 6.1 Conclusion . . . 75
6.2 Future Work . . . 76
Appendices 77
A Article for CONFTELE 2015, 10th Telecommunications Conference 79
B Poster for CONFTELE 2015, 10th Telecommunications Conference 85
List of Figures
2.1 Block diagram of communication system . . . 6
2.2 IT’s PXI platform system from NI . . . 7
2.3 NI PXI 5652. . . 8
2.4 NI myDAQ. . . 8
2.5 LabVIEW programming example. . . 9
2.6 RFID operating mode. . . 10
2.7 USA UHF RFID regulation by FCC. . . 13
2.8 European UHF RFID regulation by ETSI. . . 13
2.9 IoT concept. . . 14
2.10 EPC structure. . . 15
2.11 OOK modulation. . . 16
2.12 PIE . . . 16
2.13 FM0 encoding. . . 17
2.14 FM0 generator state diagram. . . 17
2.15 Miller-signaling state diagram. . . 18
2.16 Miller-signaling state diagram as compared to FM0 state diagram. . . 18
2.17 Preamble. . . 19
2.18 Frame-sync. . . 19
2.19 FM0 Preamble with (bottom) and without (top) pilot tone. . . 20
2.20 Transmit mask for multiple-Interrogator environment. . . 23
2.21 Transmit mask for dense-Interrogator environment. . . 23
2.22 Link timing. . . 24
2.23 Short protocol overview process. . . 27
3.1 Communication between reader and tag. . . 29
3.2 Block diagram of stimulus-response architecture. . . 30
3.3 Transmission and reception antennas. . . 31
3.4 Tag from IDSolutions. . . 31
3.5 Tag from Alien Technology. . . 31
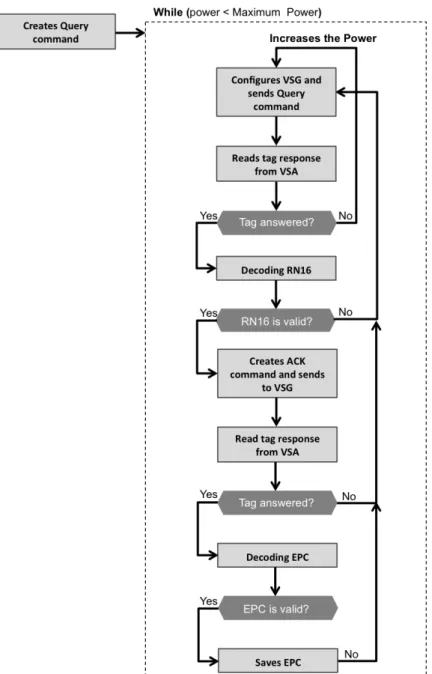
3.6 Flowchart of the stimulus-response architecture program to develop LabVIEW code. . . 32
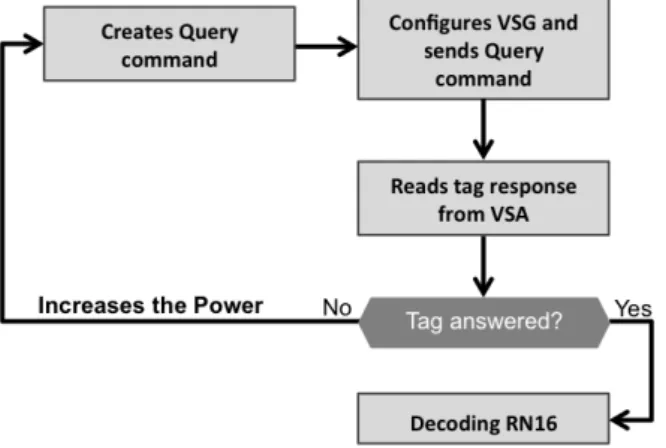
3.7 Flowchart of the stimulus-response architecture program to develop LabVIEW code simplified. . . 33
3.8 LabVIEW code of VSG. . . 34
3.9 LabVIEW code of VSA results capture. . . 34
3.11 PXI with NI 5792 and NI 5793. . . 35
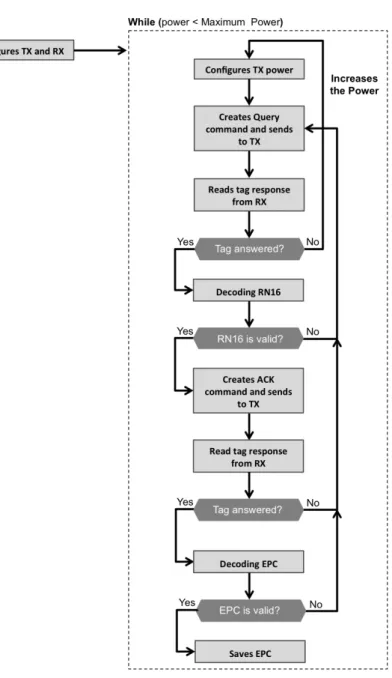
3.12 Flowchart of the real-time interrogator emulation architecture program to de-velop LabVIEW code. . . 36
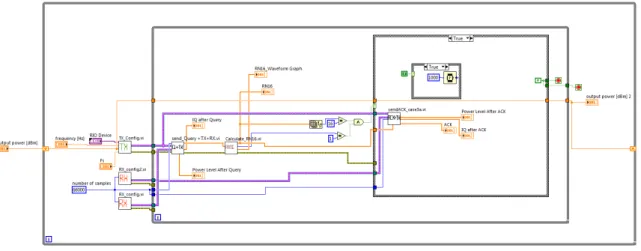
3.13 LabVIEW code of real-time interrogator emulation architecture. . . 37
3.14 Block diagram of spectrum analyzer application. . . 39
3.15 Block diagram of RF-DC measurement system. . . 40
3.16 Flowchart of RF-DC measurement system. . . 40
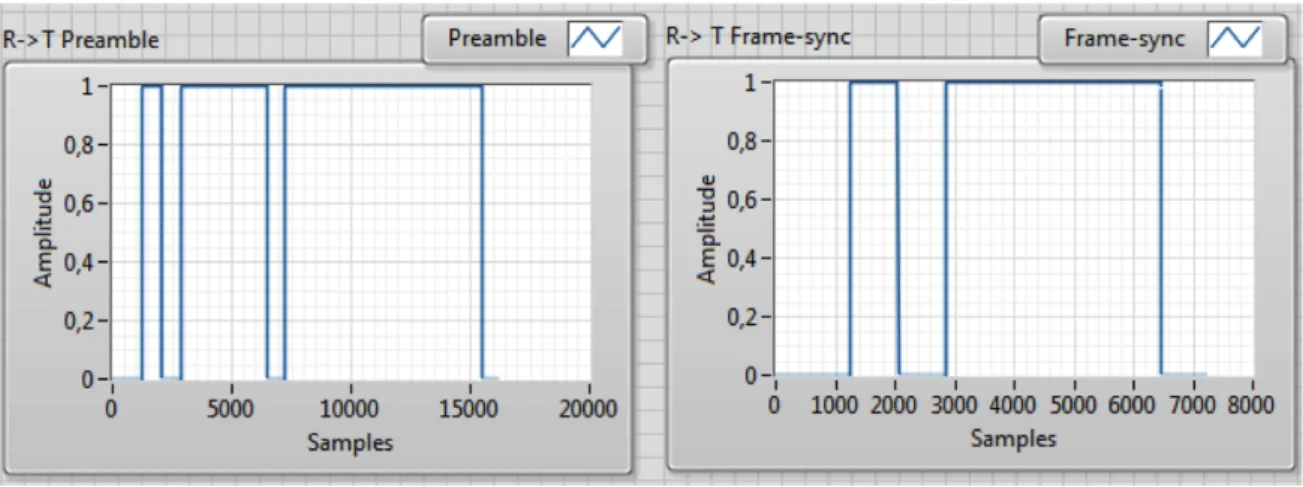
4.1 Preamble and frame-sync results in LabVIEW code. . . 42
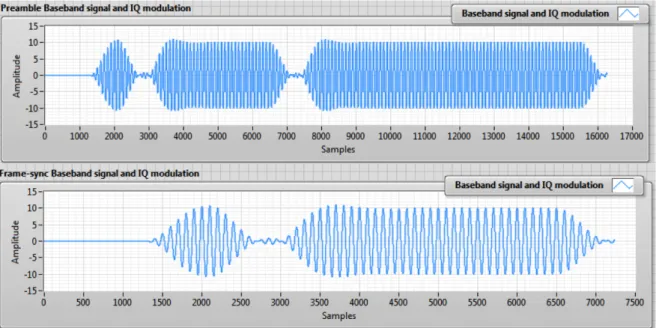
4.2 Preamble and frame-sync baseband results, with a low pass filter and an IQ modulator in LabVIEW code. . . 43
4.3 User interface for specify the Query command parameters in LabVIEW code. 43 4.4 Example of Query command LabVIEW code. . . 44
4.5 Example of ACK command in LabVIEW code. . . 44
4.6 Implementation of low pass filter in LabVIEW code. . . 45
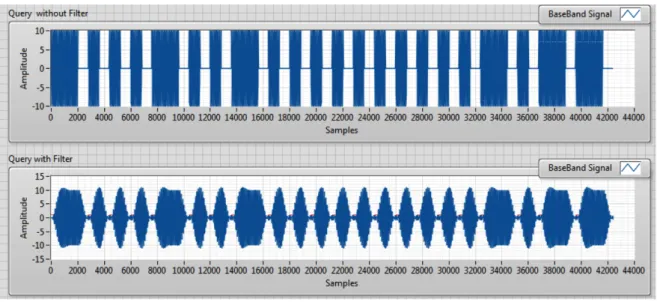
4.7 Difference between a Query command without a low pass filter and with a low pass filter. . . 46
4.8 IQ modulator block diagram. . . 46
4.9 IQ modulator used in LabVIEW code. . . 47
4.10 VSG configuration in LabVIEW code. . . 47
4.11 VSA configuration in LabVIEW code. . . 48
4.12 LabVIEW code for decoding tag information. . . 48
4.13 Signal received from tag. . . 48
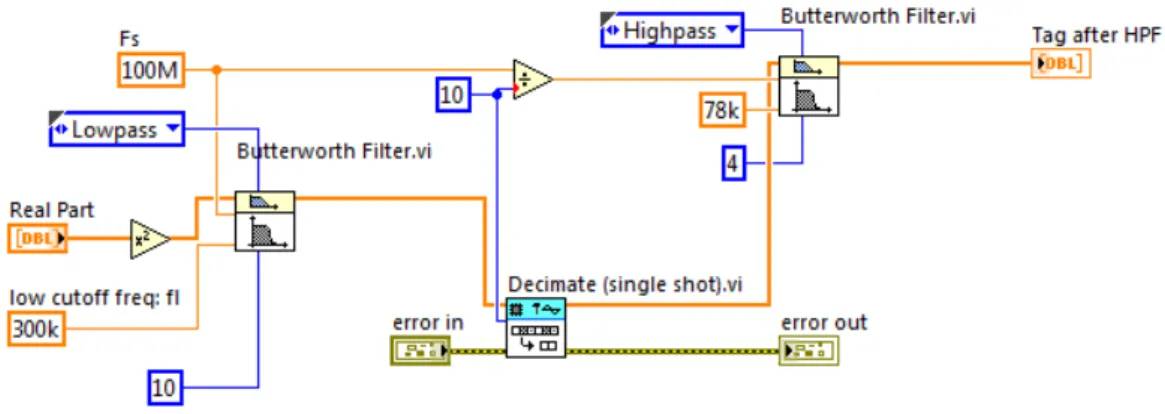
4.14 Block diagram of envelope detector followed by filters. . . 49
4.15 LabVIEW with square, low pass filter, decimation and high pass filter. . . 49
4.16 Signal after pass by squaring. . . 49
4.17 Signal after pass by a low pass filter. . . 50
4.18 Example of decimation process. . . 51
4.19 Signal after pass by decimation. . . 51
4.20 Signal after pass by high pass filter. . . 51
4.21 Signal after autocorrelation process. . . 52
4.22 Signal detected by autocorrelation. . . 52
4.23 Relationship between symbols and number of samples. . . 53
4.24 Example of RN16 detection after pass by the tag information block, autocor-relation and FM0 decoding. . . 54
4.25 LabVIEW code responsible for calculate the power spectrum. . . 54
4.26 LabVIEW code responsible for generate the spectrogram. . . 55
4.27 LabVIEW code of save data in a file. . . 56
4.28 LabVIEW code of RF-DC measurement system. . . 56
5.1 Preamble duration verification. . . 58
5.2 Preamble and Query command duration verification. . . 58
5.3 Tag response validation. . . 58
5.4 Frame-sync duration verification. . . 59
5.5 Frame-sync and ACK duration verification. . . 59
5.6 Stimulus-response architecture setup. . . 60
5.8 VSA user interface. . . 61
5.9 Measurement method to find the maximum distance and the minimum power which tag replies in stimulus-response architecture. . . 62
5.10 Relationship between increased power and the tag reading distance in stimulus-response architecture, for both tags. . . 63
5.11 Real-time interrogator emulaton archictecture setup. . . 65
5.12 Real-time interrogator emulaton archictecture result. . . 65
5.13 Measurement method to find the maximum distance and the minimum power which tag replies in real-time interrogator emulation architecture. . . 66
5.14 Relationship between increased power and the tag reading distance in real-time interrogator emulation architecture, for both tags. . . 67
5.15 Comparison between stimulus-response and real-time interrogator emulation architecture for tag reading distance. . . 69
5.16 Power transmission mask fulfilled. . . 70
5.17 Power transmission mask bandwidth. . . 71
5.18 Setup of spectrum analyzer and spectrogram application system. . . 71
5.19 Power spectrum and spectrogram display result. . . 72
5.20 User interface of spectrum analyzer and spectrogram application. . . 72
5.21 Setup of RF-DC measurement system. . . 73
5.22 Comparison between RF-DC measurement system results and experimental results in [Bel14] for Vout values. . . 74
5.23 Comparison between RF-DC measurement system results and experimental results in [Bel14]I for efficiency values. . . 74
List of Tables
2.1 Operation range in RF communications. . . 5 2.2 NI 5792 specifications . . . 7 2.3 NI 5793 specifications. . . 8 2.4 Distribuition of UHF RFID frequencies bands worldwide. . . 12 2.5 Relationship between RFID communication protocols and frequency bands. . 12 2.6 ETSI and FCC specifications. . . 12 2.7 PIE symbols duration. . . 17 2.8 Parameters which set the preamble and frame-sync. . . 19 2.9 ACK command. . . 20 2.10 NAK command. . . 21 2.11 PC, EPC and PacketCRC command. . . 21 2.12 Query command fields. . . 22 2.13 QueryAdjust command fields. . . 22 2.14 QueryRep command fields. . . 23 2.15 RN16 . . . 23 2.16 Values to respect in power transmit mask [GS115]. . . 24 2.17 Link timing parameters. . . 25 2.18 Tag-to-Interrogator link frequencies for DR=64/3. . . 25 2.19 Tag-to-Interrogator link frequencies for DR=8. . . 25 2.20 CRC-5. . . 25 2.21 CRC-16. . . 26 3.1 Transmission and reception antennas specifications. . . 31 3.2 RFID reader specifications. . . 38 4.1 Preamble values. . . 42 4.2 Query command values. . . 44 5.1 Alien tag power and distance results for stimulus-response architecture. . . . 62 5.2 ID Solutions tag power and distance results for stimulus-response architecture. 62 5.3 Tags results for fixed distance and variable power method for stimulus-response
architecture. . . 63 5.4 Tags results for fixed power and variable distance method for stimulus-response
architecture. . . 63 5.5 Alien tag power and distance results for real-time interrogator emulation
5.6 ID Solutions tag power and distance results for real-time interrogator emulation architecture. . . 66 5.7 Tags results for fixed distance and variable power method for real-time
inter-rogator emulation architecture. . . 66 5.8 Tags results for fixed power and variable distance method for real-time
inter-rogator emulation architecture. . . 66 5.9 T2 calculation. . . 68 5.10 Comparision between tags results in stimulus-response and real-time
interroga-tor emulation architectures. . . 68 5.11 Tags sensivity and maximum range obtained results for both architectures. . 69 5.12 Comparison results between RF-DC measurement system and experimental
List of Acronyms
ASK Amplitude Shift Keying BLF Backscatter-link frequency CRC Cyclic-Redundancy Check CW Continuous Wave
DC Direct Current
DFT Discrete Fourier Transform DR Divide Ratio
DSB-ASK Double-sideband amplitude shift keying EIRP Equivalent Isotropically Radiated Power EPC Electronic Product Code
ERP Effective Radiated Power
ETSI European Telecommunications Standards FAM Front-end Adapter Module
FCC Federal Communications Commission FFT Fast Fourier transform
FHSS Frequency Hopping Spread Spectrum FM Frequency Modulation
FM0 Bi-phase space
FPGA Field Programmable Gate Array FrT Frequency tolerance
GPS Global Positioning System HF High Frequency
IQ In-phase/Quadrature
ISM Industrial, Scientific and Medical ISO International Standards Organization IT Instituto de Telecomunica¸c˜oes
LabVIEW Laboratory Virtual Instrumentation Engineering Workbench LF Low Frequency
MIT Massachusetts Institute of Technology NI National Instruments
OOK (On/Off Key) PC Protocol control
PIE Pulse Interval Encoding
PR-ASK Phase-reversal amplitude shift keying PXI PCI eXtensions for Instrumentations PXISA PXI Systems Alliance
PW Pulse With
RTcal Interrogator-to-Tag calibration symbol RF Radio Frequency
RFID Radio Frequency Identification
RN16 16-bit Random or pseudo-Random Number RX Receiver
SSB-ASK Single-sideband amplitude shift keying Tari Type A Reference Interval
Tpri Backscatter-link pulse-repetition interval TRcal Tag-to-Interrogator calibration symbol TX Transmiter
UHF Ultra High Frequency USA United States of America USB Universal Serial Bus VI Virtual Instrument
VSA Vector Signal Analyzer VSG Vector Signal Generator WPT Wireless Power Transfer XPC Extended Protocol Control
Chapter 1
Introduction
A characterization approach based on specific PXI instrumentation is developed using measurement solutions for RF-DC converters, Radio Frequency Identification (RFID) and so on. These tests and measurement solutions are important to guarantee the optimization of circuits, mainly when the energy efficiency needs to be maximized, being such a key point in wireless power transmission and electromagnetic energy harvesting.In order to use these characterization systems in useful applications, the first thing to be done was to apply it to RFID applications. In this sense, the excitation of an RFID tag should be done following a convenient protocol. This is why the first approach was to design an RFID reader that could be embedded into the characterization instrument.
The PXI platform is a useful tool in this scenario, because it has the ability of implement test and measurement applications, for any type of purposes. The LabVIEW programming is a fundamental requirement to work with PXI, because it is a graphical programming with the big advantage of the code becoming easier to understand and, for this reason, the programmer productivity is increased.
For this purpose, an RFID reader and the respective LabVIEW code has been developed, in order to demonstrate the applicability of modular instrument. Two architectures have been implemented, one based on a stimulus-response strategy and another based on real-time interrogator emulation strategy. The RFID reader uses International Standards Organization (ISO) 18000-6C RFID communication protocol, which operates in the 860-960 MHz frequency range. Thus, it is important to create an RFID reader application, in order to demonstrate that this kind of applications are very useful to make RFID tag tests, measurements and to read tags.
All things considered, in the course of this dissertation another application emerges for RFID technology that is very significant, nowadays. The spectrum analyzer is a regular mea-sure instrument used in Radio Frequency (RF) laboratories, and the most recent instruments have the benefit of having a spectrogram application view too. In fact, the spectrogram view allows to have a different overview of spectrum, and this is a big advantage in RF world.
Another considering aspect is the fact of seeing what is present in Ultra High Frequency (UHF) RFID spectrum. In RF laboratories sometimes it is useful to know if signals exist near frequencies that we are working on. So, building a spectrum analyzer and spectrogram application is a goal of this dissertation too, because it is another measure system application using the PXI, and, at the same time, an application case of RFID reader.
makes the transmission of electrical power from one device to another device. Therefore, with this technique the power-charging problem can be resolved. According to this fact, build an RF-DC measurement system is a requirement to read and to optimize the efficiency of these circuits. Thus, building an RF-DC measurement system using LabVIEW code is purpose of this dissertation too.
1.1
Motivation
The RFID [Dob07] [Rob05] technology was used in the Second World War in radar systems by several countries, like Germany, England,Japan and the United States of America. The radar system was developed by the Scottish physicist Sir Robert Alexander Watson-Watt. He also developed an airplane identification system with British Army’s help during the Second World War, in 1935. For this reason, transmitters were implanted in airplanes that gave dif-ferent answers to the radar. These signals were received from radar stations on ground and, this way, the transmission of the response signal was started, which identified the airplane as friendly. It was then created the first radio frequency identification. The Massachusetts Insti-tute of Technology (MIT) and other research instiInsti-tutes, in 1999, started the study about an architecture with radio frequency technology, to apply on product identification applications. The first radio frequency identification was then created. As a result of this study, Electronic Product Code (EPC) was defined. EPC defines a product identification architecture using radio frequency signals, later called RFID.
After all, RFID brings to technology an easy and cheap way to do object identification, which is very useful and it is currently used in industry applications. Nowadays, because of these reasons, applications which allow test if tags work or not, applications that allow to make distance test about RFID tags and read the tags have an important role in industry.
The PXI platform and the LabVIEW code are fundamental tools in measurement system, developed by National Instruments NI. These two tools were particularly designed to measure and control systems and, for this reason, the PXI platform is the right choice to develop RFID reader systems.
Some works were made in this specific area [Ins15a] [Nik09] [Ins13a], and below a brief description about these issues is made.
1.1.1 LabVIEW-Based UHF RFID Tag Test and Measurement System
Re-view
As it was mentioned before, some works were made in RFID tag test and measurement. An example of this, is this paper [Nik09], which describes an UHF RFID tag test and measurement using the PXI and the LabVIEW code. In this work, the authors report how the system was built and the results obtained. Beyond the PXI, the system is based on RF signal generator, composed by a PXI-5421 (which generates an arbitrary waveform) and a RF up-converter PXI 5610. The system is also composed by a RF signal analyzer, with a PXI-5600 (RF downconverter) and the digitizer PXI-5620.
Two important lessons were learnt. The first one, is the RF signal generator and the RF signal analyzer in this system present a limitation about synchronization, which is very important to detect tag response. The reason why this happens is because the system has separated RF local oscillators (LO). The second lesson is about the LabVIEW processing
time, which has longer duration than the time limits which imposed different phase relations in receiver chain.
The analysis of this paper was very important for this dissertation, because it was a starting point to understand how this dissertation work could be implemented.
1.1.2 Advanced RFID Measurements: Basic Theory to Protocol
Confor-mance Test Review
Another substantial contribution is an article [Ins13a] developed by NI, with the purpose of giving to scientists in the research and commercial environments, a test and measure-ment system for tags. Firstly, the RFID theory is shortly explained and then the tag testing methodology. After that, a brief introduction about tags, antennas and communication pro-tocols.
As a matter of fact, with this article some doubts about an RFID reader system have been resolved, because the information about this topic is explained in a simple way. In this article, two very useful architectures were learnt (explained in chapter 3) to apply in this dissertation. Thus, this article was important to understand how these architectures could be applied in this dissertation, as well as, to observe the big difference between these two and their complexity.
These two papers/articles were very important to start this dissertation and make some decisions because many initial questions were clarified.
1.2
Objectives
In this dissertation it is intended to develop an RFID reader system capable of giving some information to the user about RFID tags and an RF-DC measurement system, more specifically:
• Test the tag functionality: detect if tag can reply or not;
• Make distance measurement test: get the maximum distance which tag can reply; • Make power measurement test: detect the minimum power which is needed for tag
reply;
• Read the tag: get the tag EPC;
• Make a spectrum analyzer and spectrogram application: analyze and see what happens in the UHF RFID spectrum for all frequency bands worldwide;
• Make an RF-DC measurement system: get a1, b1, S11, Direct Current (DC) voltage
and efficiency of RF-DC circuits.
To develop the RFID application, the PXI platform and the LabVIEW code are require-ments. An RFID reader is supposed to be built in UHF range (860 MHz - 960 MHz) and the ISO 18000-6C RFID communication protocol is used. In downlink, the Pulse Interval En-coding (PIE) with the (On/Off Key) (OOK) modulation is used and in uplink the Bi-phase space (FM0) coding is used. The RFID system is supposed to be built for United States of
America (USA) range and for a dense-interrogator environment, because it is more difficult to fulfill these specifications, than the European specifications. It makes the project more challenging.
For sure, the goal of this dissertation is not only to repeat that which has been done in this topic (RFID reader with PXI platform) in some articles, but the intention to build an RFID simple system capable of improving some of these works. It is a big purpose to create a useful tool, for RF laboratory, able to measure, test and read RFID tags, in a simple way to the user. Another purpose is to build an application which allows to view the RFID power spectrum, in a user-friendly fashion. Regarding RF-DC circuits, it is important to know the parameters values (incident wave (a1), reflected wave (b1) and thus, S11 (reflection coefficient)) of these
circuits, because this way the RF-DC circuits optimization can be done, with a LabVIEW application for this purpose.
1.3
Organization of the Dissertion
This document is divided into 6 chapters, including this introductory chapter:
• Chapter 2 - Technical Background: In this chapter, an introductory explanation is made of the concepts used in this dissertation.
• Chapter 3 - Archictures and Specifications: There is an intention to explain the architectures used to build the RFID system and understand the choices made about some system specifications.
• Chapter 4 - Implemetation: The development and the implementation of the RFID reader is explained in this chapter.
• Chapter 5 - Results: The dissertation results are demonstrated in this chapter. • Chapter 6 - Conclusion and Future Work: The conclusion of this dissertation is
done and ways to improve this work in the future are also mentioned.
1.4
Original Contributions
This dissertation work provided the opportunity to participate in CONFTELE 2015, 10th Telecommunications Conference held in Aveiro between September 17th - 18th. A scientific
paper was written, M. Jord˜ao, D. Ribeiro, P.M. Cruz, N.B. Carvalho, ” RFID Characteriza-tion System based on LabVIEW” and this one was accepted and presented in poster form, in the conference. The paper can be seen in Appendix A and the poster can be seen in Appendix B.
Chapter 2
Technical Background
This chapter is devoted to explain the baseline topics used in the course of this dissertation. Firstly, a brief overview of RF communications will be given. The PXI platform is very important, due to the fact that this element controls all system. The LabVIEW programming because it is the key element used to develop all system. The RFID is a technology which allows to identify many objects and is very useful in our days, in many applications, for instance in industry. The protocol ISO 18000-6C is explained in detail, because it is the primary tool to start developing the RFID reading system.
2.1
RF Communications
The RF communications [Ins07] is used in wireless communications like phone, television, radio, satellite and so on, to transmit and to receive information. The operation range [Ana09] of RF communication can be separated in several ranges, but the most common are concen-trated in the low end range (3 kHz - 3 GHz). This information can be seen in more detail in Table 2.1, but in summarised form.
Frequency (Hz) Applications
30 - 3 k Submarine communication
3 k - 30 k Communication for military purposes 30 k - 300 k Navigation and international radio stations
300 k - 3 M National radio stations
3 M - 30 M Radio stations and radiotelephone
30 M - 300 M Frequency Modulation (FM) radio stations radio and Television stations
300 M - 3 G Television stations, mobile phones and air traffic control by radar 3 G - 30 G Mobile phones, radar, communication satellite and
Global Positioning System (GPS)
30 G - 300 G Space Station
Table 2.1: Operation range in RF communications.
The radio frequency waves are electromagnetic and are able to send energy, which allows communication without using cables. The information sent can be analog or digital. The analog signals have a big number of messages and the corresponding waveforms might not
be all acquaintances. The digital signals have a detection of a finite number of waveform acquaintances.
The modulation process allows to send information using frequency. A carrier is a radio signal not modulated, which is an analog waveform that can be modulated to transmit in-formation. Several types of modulation exist and which one is more useful depends on the application scenario. The modulation can be in amplitude, frequency or phase.
The transmitter and the receiver are fundamental elements in RF communications, be-cause they allow to send and receive information, and for this reason the antennas are crucial elements in radio communications, because they are the interface to the air. To send a signal in RF communications, a big process happens, the coding of information, the modulation, the upconversion process, the downconversion process and the demodulation part (can be seen in Figure 2.1), but other techniques are useful in RF communications like filtering, interpolation, In-phase/Quadrature (IQ) modulation and many others.
Figure 2.1: Block diagram of communication system [Ins07].
Some aspects are required to send information in RF communications and the IQ mod-ulator is one of them. The IQ modmod-ulator is a useful tool for RF communications, because it allows to modulate signals to send information, and for this reason it is very used in RF systems. So, can be concluded that to make RF communications is required take into account these aspects, because is a complex process.
2.2
PXI Platform
The PXI [Ins14b] platform from NI is a high performance computer. This platform was developed in 1997 and is administered by PXI Systems Alliance (PXISA), group of companies which has a goal to promote and control the specifications of PXI. This system is designed to provide reliable and easily configurable measurement solutions. For these reason, it is a great solution for electronic test equipment, automation system and modular laboratory instruments.
The PXI chassis allows to put some slot modules, with different types of functions, so the PXI has the ability to add different types of front ends to work like receivers and transmitters, and has the possibility of processing with Field Programmable Gate Array (FPGA).
A bigger advantage of PXI is timing and resources synchronization, because this equipment contains a 10MHz system reference clock, a PXI trigger bus, a start trigger bus and a slot-to-slot local bus to address the need for advanced timing and synchronization. Thus, the 10MHz reference clock can be exported and sharing it with other devices.
In particular, PXI from NI, affords modules for instrumentation, data aquisition, commu-tation, movement, vision, advanced sincronization and interface with other buses.
All things considered, a PXIe-1085 [Ins15b] was used in this dissertation, which is present in Figure 2.2.
Figure 2.2: Instituto de Telecomunica¸c˜oes (IT)’s PXI platform system from NI.
2.2.1 PXI Modules
The PXI platform has the ability to add different types of front-ends to work like receivers and transmitters and has the possibility of processing the data in FPGAs. These modules are internally connected to a FlexRIO FPGA module. In this dissertation, two RF Front-end Adapter Module (FAM)’s from NI were used to connect to the PXI.
NI 5792
The NI 5792 [Ins13c] is an RF receiver adapter module, which connects to PXI and uses a FPGA module. This module has five connectors, an input receiver, an input and an output clock, an input and an output local oscillator. The module specifications are briefly shown in Table 2.2.
RF frequency range 200 MHz to 4.4 GHz ADC 14-bit dual channel at 250 MS/s Phase noise <95 dBc/Hz, 10 kHz offset
Dynamic range >106 dB
Instantaneous bandwidth 200 MHz
Table 2.2: NI 5792 specifications.
NI 5793
The NI 5793 [Ins13d] is an RF transmitter adapter module, can be connected with PXI using a FPGA module. This module has five connectors, an input trnasmitter, an input and an output clock, an input and an output local oscillator. The module specifications are on the following Table 2.3.
RF frequency range 200 MHz to 4.4 GHz
DAC 16-bit dual channel at 250 MS/s
(500 MS/s with 2x interpolation), I and Q Phase noise <95 dBc/Hz, 10 kHz offset, 2.4 GHz carrier Transmiter (TX) output power 7 dBm at 2.2 GHz
Instantaneous bandwidth 200 MHz
Table 2.3: NI 5793 specifications.
NI PXI 5652
The NI PXI 5652 [Ins06] is a RF signal generator with a frequency range of 500 kHz to 6.6 GHz. This module has modulation capability and can be seen in Figure 2.3.
Figure 2.3: NI PXI 5652 [Ins06].
2.2.2 NI myDAQ
NI myDAQ [Ins] is an electronic device from NI which allows received and read data, in other words, data aquisition. This device connects with computers by an Universal Serial Bus (USB) interface and this way can be done measurements and analysis of signals, easily. Figure 2.4 shows this device.
Figure 2.4: NI myDAQ [Har13].
2.3
LabVIEW Programming
The LabVIEW software package [Ins13b] [Ins98] is a graphical programming developed by NI, which contains tools to design, to implement measurement and control systems. This language was created in 1986, initially, for the Macintosh operating system, but, nowadays, it exists for Windows, Linux and Solaris operating systems too. LabVIEW language follows
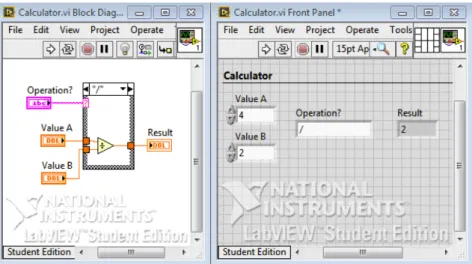
a data flow model, which makes it very functional for data acquisition and handling of in-formation. This programming language is very useful for measurements, processing, signals analysis, control and tests. To interact with user, this language contains a front panel (inter-face) and a block diagram to develop the graphic code of the program. Figure 2.5 shows an example of LabVIEW programming, which is a calculator program. As it can be seen, the program contains the block diagram and the front panel, which allows the user to interact with the Virtual Instrument (VI).
Figure 2.5: LabVIEW programming example.
The VIs are programs which contain other subVIs inside (functions which contain other functions). As a result, each program can be used for another program, or, can just be used stand alone. Each VI can be connected to another VIs, by connectors (lines) that make the VIs dependents from each other. The big advantage of this, are VIs which do not depend on others and can be execute in first place. Thus, the program becomes more efficient, with less time of execution.
One of the great LabVIEW programming advantages is the fact it allows the increase of productivity, because with the block diagram interface it is simple to view the entire code, create and to develop. This programming was used in this dissertation, because it is simple and compatible with most of the selected sub-systems, since it is very helpful in measurement systems also, and by the fact that it is used in PXIe-1085 from NI.
In summary, the LabVIEW is a great tool to develop graphical code, although the first steps in this programming language are quite confusing. The reason why this initial difficulty is present, in most part of beginner’s LabVIEW users, is due to the fact that developers are more familiar with written programing languages than graphical. When it is required to adapt all programming concepts to the graphical programming languages, some difficulties appear, at this moment. So, the big initial difficulty is to make the connection between the ordinary concepts of programming languages, for instance, built an array, with the respective blocks in LabVIEW programming.
2.4
RFID Theory
RFID [VDHP07], is a technology that uses radio frequency waveforms for identification approaches. This identification method allows to store a serial number that identifies a person, object or another type of information within the tag. The RFID system is based on interrogator (reader) and tag communication. Due to this fact, this technology much used and adaptable in many tasks, which makes this technology very used in industry and stores to know information about objects. Next, a brief description about this technology is made.
2.4.1 Operating Mode
An RFID system [Dob07] [MKS11] [GS1] consists of two main elements, the reader and the tag. The reader is responsible for all communication between tag (or tags) and reader, and is responsible to read the information that the tag contains. Therefore, if problems exists in reader and tag communication, the reader has the responsibility of managing all communication and solving all problems. This way, the reader is much more complex than the tag, and, for this reason, the reader has a much higher cost than the tag, as well as bigger dimension. However, the tag is an element of low complexity, small size and low cost, which only has to answer the entire communication process managed by the reader. The system also contains antenna (monostatic), or antennas (bistatic), which function to transmit and receive information between the reader and the tag.
The tag transmits the own information by sending the signal from integrated circuit to the reader. The reader converts the radio waves, from RFID, to digital information. After this, the information can be read and understood by a computer. Figure 2.6 gives an insight about the RFID working principle.
Figure 2.6: RFID operating mode.
2.4.2 Types RFID Tags
There are three types of RFID tags [Dob07] [Cis08], depending on the internal power: • Active tag - has own power source (internal battery), which feeds the chip and the
communication signal. This tag has a large data storage capacity, can resist harsh environments, has a higher cost and can be read at large distances.
• Passive tag - works with the energy which is sent through the reader, the energy received is used to send the stored data to the reader. It has a small number of elements, a simple constitution, a longer period of operation and requires no maintenance, which
makes it very cheap. However, the passive tag, compared with active tag, has a shorter range, because it has no internal battery.
• Semipassive tag - has a battery, but that is only activated when it receives a signal from the antenna/reader. Thus, battery power is typically used only for the chip feeding, while the energy used for communication is received by antenna/reader. So, these tags have a range value between passive tag and active tag.
Nevertheless, tags can be classified according to the storage type in internal memory. There are three types of tags, according to the storage type [Pra08] [Jou]:
• Read only (RO) -the data is written only one time, when it is manufactured, and the data cannot be changed. However, these tags can be read several times, which make them very useful for commercial applications, for this reason, typically they are passive. • Write Once, Read many (WORM) - are written when they are manufactured, but can
be changed a few times, in a limited number.
• Read-Write (RW) - can be reprogrammed many times, which make these tags more advantageous. Because of this reason, they contain a flash memory and usually are used in environments which need to update information recurrently.
Thus, the right tag must be selected depending on the reading range, the environment, and other factors.
2.4.3 Frequency Bands and Protocols
The RFID systems operate in several bands, which are related to Industrial, Scientific and Medical (ISM) bands. The ISM bands [Ban94] have a control by the regulatory authorities of each country due to the fact that they have obligations relating to spectrum. The Table 2.4 shows the distribution of UHF RFID frequencies bands worldwide [Dob07].
RFID systems can also be classified by frequency band like in Low Frequency (LF), High Frequency (HF), UHF and Microwave. The LF systems, which operate at 125-134 kHz, and the HF systems, which operate at 13.56 MHz, are both inductive. For higher frequencies there are two common bands, the UHF systems, which operate at 860-960 MHz, and the microwaves, which operate at 2.4-2.5 GHz, and both are radioactive.
To accomplish communication between the tag and the reader it is necessary to respect several rules, and these rules are present in a protocol. It is possible to see some RFID communication protocols [Ins13a] [Dob07] in Table 2.5. These protocols are related with readers and tags communication frequency and were created by ISO.
2.4.4 Power Transmit Mask
To achieve an RFID communication between reader and tag, some regulations for radio-frequency emissions are needed to respect, like the maximum power transmitted (Effective Radiated Power (ERP)). The RFID operates in several bands (ISM bands), like as was mentioned before, and the entities are responsible to check the specifications, in each country. Worldwide, two big entities are responsible for doing it, the European Telecommuni-cations Standards (ETSI) (Europe) and the Federal CommuniTelecommuni-cations Commission (FCC) (USA) [RFI09]. Table 2.6 shows the difference between the two regulatory entities.
Country Frequency (MHz)
USA, Canada 902-928
Mexico 915
Argentina, Chile, Costa Rica, Dominican Republic, Uruguay 902-928
Brazil 902-907.5, 915-928 Europe 865-868 South Africa 865.6-867.6, 917-921 China 917-922 Thailand 920-925 Korea 908.5-914 Japan 952-954 Taiwan 922-928 Malaysia 866-869 Singapore 923-925, 866-869 Austalia 918-926 New Zealand 864-868
Table 2.4: Distribuition of UHF RFID frequencies bands worldwide.
Frequency Tag Type - Protocols
LF 125-134 kHz Passive - HiTag, ISO11784/5, 14223, ISO18000-2
HF 5-7 MHz Passive - iPico DF/iPx, ISO10536
HF 13.56 MHz Passive - ICODE, ISO14443, ISO15693, ISO18000-3 MIFARE, Tag-IT, TIRIS
UHF 850-950 MHz Passive - EPC class 0, EPC class 1, Intellitag, ISO18000-6A, Title 21, S918, Ucode
UHF 850-950 MHz Semipassive - AAR S918, EZPass, Intelleflex, Maxim, Title 21
UHF 860-960 MHz Passive - EPC GEN II, EPC class 0, EPC class 1, Intelitag tolls, ISO18000-6A,B and C, Rail, Title 21 Microwave 2.4-2.45 GHz Active - ANSI 371.1, ISO18000-4
Microwave 2.4-2.45 GHz Passive - Intellitag, ISO18000-4 Microwave 2.4-2.45 GHz Semipassive - Alien BAP, ISO18000-4
Table 2.5: Relationship between RFID communication protocols and frequency bands.
ETSI FCC
Bandwidth of the 200 kHz 500 kHz
transmission channels
Distance between 600 kHz None, because the transmission
transmission channels channels are adjacents
Maximum power transmitted 2 W ERP (33.01 dBm) 4 W ERP (36.02 dBm) Reader operation frequency 865-868 MHz 902-928 MHz
The Frequency Hopping Spread Spectrum (FHSS) allows to transmit the radio signals and allows to change the carrier through several frequency channels too. This technique is used in FCC (see Figure 2.7) and has two big advantages, difficulty to interception and shar-ing bandwidth with many types of conventional transmitters and with minimal interference. Thus, this technique is used by FCC. Figure 2.8 represents the technique used by ETSI.
Figure 2.7: USA UHF RFID regulation by FCC.
Figure 2.8: European UHF RFID regulation by ETSI.
Therefore, each type of environment has a transmit mask to respect, and can be applied different types of power transmit mask. These masks [GS115] are for a single-interrogator environment, a multiple-interrogator environment or a dense-interrogator environment.
• Single-interrogator environment - in this case it is only taken into account the european UHF RFID regulation, because there is only one reader.
• Multiple-interrogator environment - several readers exist in the environment. The interference in the adjacent channels needs to be respected.
• Dense-interrogator environment - each channel is occupied with a reader. So, tags can be read when all adjacent channels are occupied.
2.4.5 Relevance to the Internet of Things
The Internet of Things (IoT) [VF13] is a growing issue. This big technology revolution is the Telecommunication future, in order to provide the connection between the daily routine objects, with a big control system, through the internet (see Figure 2.9). Thus, data of several objects can be controlled and registered.
However, besides using the internet to send data, about object information, it is neces-sary to be constantly reading information of these objects. The RFID tags allow to acquire the information, at home, in commerce, in factories, for instance, and allow to know the object localization. Because of these reasons, the RFID tags are the perfect choice for this scenario [Jou15]. In fact, some tags have the ability to read the information recurrently (Read-Write Tags), which make these tags very useful for IoT applications.
Nevertheless, the economic factor is very important in any kind of business, the RFID tags are much easier to develop and do not require maintenance. Thus, systems which allow to make a successful tags reading and make efficient measurement tag tests are also associated to all this great revolution. So, this makes the tags and, consequently, the readers (to read the tag information) a big focal point of IoTs, in the near future. Therefore, it is foreseen that the IoT will make the RFID tags technology grow, as well as, the RFID readers, more and more.
Figure 2.9: IoT concept.
2.5
Protocol RFID ISO 18000-6C
The protocol is an agreement which allows to connect and establish communication be-tween two systems. To develop an RFID reader, in this dissertation, is used the ISO 18000-6C protocol, EPC Generation-2 Class 1 UHF (EPC Gen-2) [GS115]. This protocol was developed by EPC Global Organization and operates in 860 MHz - 960 MHz frequency range.
Thus, a tag identification can be done, using an RFID reader and this protocol. To read a tag it is required to know the parameters which allow to read the tag information. The
EPC [EPC13] gives an exclusive identification for an object. This attribution is made by EPC global, a company which makes a unique identification product. The EPC is encoded on RFID tag, for all kinds of applications, and this way it is possible to identify many different objects. In Figure 2.10 it is possible to observe the EPC structure.
Figure 2.10: EPC structure.
The header identifies the length, type, structure, version and generation of the EPC. The EPC manager number is the entity responsible for maintaining the subsequent partitions. The object class identifies a class of product. The serial number is a unique identifier number for each product.
An interrogator (reader) to interact with tags employs three operations, the select opera-tion, the inventory operation and the access operation. The select is responsible for choosing the one or more tags in a given population. The inventory (or inventory round) is responsible for identifying an individual tag. The access is responsible for communicating with a tag which was already identified.
Nevertheless, in this dissertation only the inventory round is used, because it is intended to get the tag identification. Firstly, it is send a Query command, then the tag replies with a 16-bit Random or pseudo-Random Number (RN16) command. After that, the reader sends the ACK command, which contains the same RN16 command which was sent by the tag. The tag, receives the ACK command and sends the Protocol control (PC), EPC and PacketCyclic-Redundancy Check (CRC). Finally, if EPC is valid, the reader sends to tag the QueryRep command, if not, sends the NAK command.
In this protocol, the reader sends information to the tag, which modulating a RF carrier using a Double-sideband amplitude shift keying (DSB-ASK), Single-sideband amplitude shift keying (SSB-ASK) or Phase-reversal amplitude shift keying (PR-ASK), and using PIE. When the reader sends the information to the tag (R→T), the tag starts to operate because of this modulated RF carrier, and this way, the tag is capable to send his own information to the reader. After this, the reader receives the tag backscattered reply (T→R). To communicate, the tags use the amplitude, or phase modulation of the RF carrier, by backscatter. The FM0 and Miller are used by the tag like the encoding format to response to the reader.
The following subsections will explain the RFID protocol details.
2.5.1 Modulation
In modulation [Col] process, the signal characteristics are modified to transmit informa-tion, through the carrier wave, and these modifications can be in frequency, amplitude or phase. In this protocol can be used DSB-ASK, SSB-ASK, PR-ASK, to send information from the reader to the tag (R→T). The DSB-ASK modulation is less efficient, however it is easier to develop with OOK. The SSB-ASK is more complex than DSB-ASK, because it requires an IQ modulator, but gains in terms of spectral efficiency. In SSB-ASK and DSB-ASK, the power efficiency present in this modulation depends on the modulaton index. To decrease the carrier to noise in a narrowband, the PR-ASK is a nice solution, because of that the power transmitted to tag is increased.
The Amplitude Shift Keying (ASK) is a digital modulation technique, which uses the variation of the RF carrier amplitude in accordance with baseband digital input signal. So, to represent logic level ’0’ is used 0 and to represent the logic level ’1’ is used the Acos(2πf). The A is the amplitude and the f is waveform frequency.
The OOK modulation is a very popular modulation index [JA]. The digital OOK modu-lation is simple and is an easy form of ASK modumodu-lation. This modumodu-lation uses two symbols to represent logic level ’1’ and ’0’, where both have different amplitudes. For this reason, the carrier frequency assumes a certain amplitude (voltage level), and, this way, represents the logical level ’1’. The logic level ’0’ is represented by zero amplitude (voltage level), like Figure 2.11 shows. The big advantage of this modulation is the transmission of zero sym-bol. When a zero is sent, it does not need to transmit any waveform, the signal remains in zero, and this way, allows conserve energy. Nevertheless, this modulation is very sensitive to undesired signals.
Figure 2.11: OOK modulation.
2.5.2 Pulse Internal Encoding
In encoding process, the message is converted into symbols. PIE [YZC09] (see Figure 2.12.) is used to easily do the information demodulation in tag, where the information comes from the RFID reader (R→T).
Figure 2.12: PIE.
Basically, this encoding intends to represent the ’0’ and ’1’ symbols (data 0 and data 1). To do this, variable pulse lengths are used to transmit digital information. According to the ISO 18000-6C protocol, tags are required to respond to commands. The data rate is specified by Type A Reference Interval (Tari) value, the time interval required to transmit a zero bit. The Tari value is between 6.25µs and 25µs. The Pulse With (PW) minimum value is MAX(0.265Tari, 2) and the maximum value is 0.525Tari. So, the data-0 is represented by two logic levels, ’1’ and ’0’, and the data 1 is also represented by two logic levels, ’1’ and ’0’.
However, in data 0 and data 1, the logic level ’0’ is represented by PW value. In data-0, the logic level ’1’ is also represented by PW, in constrast to data 1, because the logic level ’1’ has bigger duration (see Table 2.7).
Logic level ’1’ ’0’
data-0 Tari-PW PW
data-1 Minimum: 1.5Tari PW Maximum: 2Tari
Table 2.7: PIE symbols duration.
2.5.3 FM0 and Miller encoding
The FM0 [Dob07] inverts baseband phase at every symbol boundary. The tag can code information with FM0 or Miller, to send to reader (T→R).
Figure 2.13: FM0 encoding.
This encoding (FM0) works like a transition in the middle of the ’0’ symbol, but does not exist a transition in the middle of the ’1’ symbol. Figure 2.13 shows the FM0 encoding and Figure 2.14 shows the FM0 generator state diagram, which occurs four possible stages, S1, S2, S3 and S4.
Figure 2.14: FM0 generator state diagram [GS115].
In the Miller [GS115] encoding, the signal FM0 is multiplied by a square wave, using 2, 4 or 8 factor for each FM0 symbol. In this encoding, between two data-0 symbols exists an inversion of phase and the same happens in middle of data-1 symbol. In Figure 2.15 can be seen the Miller-signaling state diagram.
In FM0 encoding, the S2 and S3 stages represent the data-0 symbol, and the S1 and S4 stages represent the data-1 symbol. The relation between them remains in (2.1) and (2.2).
Figure 2.15: Miller-signaling state diagram [GS115].
S2 = −S3 (2.2)
In Miller encoding, the S4 and S1 stages represent the data-0 symbol, and the S2 and S3 stages represent the data-1 symbol. The relation between them is the same that in (2.1) and (2.2). So, the big diference between FM0, Miller 2, 4 and 8 is the number of transitions in each symbol, and can be seen in Figure 2.16. The FM0 is typically used because of its is easiness of implementation.
2.5.4 Preamble and Frame-sync
To send commands from reader to tag (R→T) some fields need to be used. Thus, to send any command from reader to tag a preamble has to be sent (see Figure 2.17) or a frame-sync (see Figure 2.18). The preamble precedes the Query command, which makes this one the initiator of the inventory round. The frame-sync precedes the ACK, NAK, QueryAdjust and QueryRep commands. As can be seen in Figure 2.17, the preamble contains four parts, the delimiter, the data-0, the Interrogator-to-Tag calibration symbol (RTcal) and the Tag-to-Interrogator calibration symbol (TRcal). The preamble and frame-sync are very similiar, however, the frame-sync has not the TRcal part.
Figure 2.17: Preamble [GS115].
Figure 2.18: Frame-sync [GS115].
To calculate each parameter that composes the preamble and frame-sync the values in Table 2.8 have to be used.
Parameter Value
Tari 6.25 µs≤Tari≤ 25 µs
PW MAX(0.265Tari) ≤PW≤ 0.525Tari delimiter 12.5 µs +/- 5%
data-0 Tari
RTcal 2.5Tari≤RTcal≤ 3Tari TRcal 1.1RTcal≤TRcal≤ 3RTcal
Table 2.8: Parameters which set the preamble and frame-sync.
Therefore, to send information from tag to the reader (T→R) the communication starts with a FM0 preamble (see Figure 2.19). This preamble is different from the preamble in R→T communication. It may start or not with a pilot tone (depends on the Query command sent by tag in the beginning of the communication). The pilot tone is formed for 12 data-0
symbols. After pilot tone (or if no pilot tone) there are 6 static symbols (1 0 1 0 v 1, v means violation). After these 6 symbols, the command sent from tag to the reader appears.
Figure 2.19: FM0 Preamble [GS115], with (bottom) and without (top) pilot tone.
2.5.5 Protocol commands
To do the communication between the reader and the tag some commands are exchanged. That happens in inventory round part, which was implemented in this dissertation.
ACK
The ACK command is sent to the tag (R→T) in order to inform that the RN16 command was received and is valid. Therefore, when the reader receives the RN16 command from tag, the ACK command is sent to inform the tag, containing the same RN16 information. Thus, the ACK command is composed by 18 bits, 2 statics bits (01) and the 16 bits (the same bits in RN16 command) (see Table 2.9). Nevertheless,a Frame-sync is sent before the ACK command.
Command RN
# of bits 2 16
description 01 Echoed RN16 or handle Table 2.9: ACK command [GS115].
After the ACK command is sent, the tag replies with PC, EPC and PacketCRC, which makes a total of 96 bits.
NAK
The NAK command, such as the ACK command, is preceded by a Frame-sync. This one, has the purpose to inform the tag that the EPC received is not valid. When this happens, the tag does not reply to this command. NAK is composed by 8 specific bits (see Table 2.10). PC, EPC and PacketCRC
The PC, EPC and PacketCRC command (see Table 2.11)) is composed by 96 bits and is sent from the tag to the reader (T→R), after the reader sends to the tag (R→T) an ACK
Command
# of bits 8
description 11000000 Table 2.10: NAK command [GS115].
command. This command contains the tag EPC, which gives an exclusive identification for each tag. Like in the other commands, this one is preceded by a FM0 preamble.
PC, EPC and PacketCRC command
# of bits 96
Table 2.11: PC, EPC and PacketCRC command.
Query
The Query command is responsible for initializing the communication between reader and tag, and is preceded by a preamble. This command contains all the communication configurations between reader and tag, and due to this reason, the Query command starts the inventory round. Table 2.12 shows all fields that form this command, which is composed by 22 bits.
Tag replies to the Query command with a RN16 command. QueryAdjust
The QueryAdjust command is preceded by a Frame-sync and is composed by a total of 9 bits (see Table 2.13). The purpose of this command is to adjust the Q parameter value.
The tag replies with a RN16 command, after being sent a Query Adjust command. QueryRep
QueryRep command informs the tag to decrease one unit in your slot counter. Thus, when the slot counter reaches the zero value, the tag knows that it is your time to be read. This command is also preceded by a Frame-sync and has 4 bits, which can bee seen in Table 2.14.
When a Query command is sent to the tag, the tag replies with a RN16 command. RN16
The RN16 command (see Table 2.15) is composed by 16 bits randomly generated and is sent from the tag to the reader (T→R), after reader sends to tag (R→T) a Query command. FM0 preamble precedes this command.
2.5.6 Power Transmit Mask
This protocol can be applied on three power transmit masks, the single-interrogator envi-ronment, the multiple-interrogator environment (see Figure 2.20) and the dense-interrogator environment (see Figure 2.21). Table 2.16 depicsts the specifications for multiple-interrogator and for dense-interrogator environments.
Fields Definition # of bits Bits
Command Starts the Query command. 4 1000
DR Sets Backscatter-link frequency (BLF) 1 0: DR=8
value. 1: DR=64/3
M Number of subcarriers per symbol. 2 00: M=1
01: M=2 10: M=4 11: M=8 TRext Sets if preamble from tag has pilot tone 1 0: No pilot tone
or not. 1: Use pilot tone
Sel Sets which tags reply. 2 00: All
01: All 10: ∼SL
11: SL
Session Session number. 2 00: S0
01: S1 10: S2 11: S3 Target Select the type of tags that respond to 1 0: A
this command. 1: B
Q Sets the number of slots in the round. 4 0-15
CRC A 16-bit CRC 5 CRC-5
code that a tag calculates over its PC, optional XPC
word or words, and EPC and backscatters during inventory.
Table 2.12: Query command fields.
Fields Definition # of bits Bits
Command Starts the QueryAdjust command. 4 1001
Session Selects the inventory round number 2 00: S0
session. 01: S1
10: S2 11: S3
UpDnt Adjusts the Q parameter. 3 110: Q=Q+1
000: No change to Q 011: Q=Q-1 Table 2.13: QueryAdjust command fields.
In multi-interrogator environment, the channel R represents the channel used to send information, the channel S represents other channel than R and the P represents the power of a particular channel. To fulfill the power transmit mask, when any information is sent in channel R, the relation between power in channel S and channel R is shown in Table 2.16.
In dense-interrogator environment, the RBW represents the R channel bandwith and the
Fields Definition # of bits Bits
Command Starts the QueryRep command. 2 00
Session Selects the inventory round number 2 00: S0
session. 01: S1
10: S2 11: S3 Table 2.14: QueryRep command fields.
RN16 # of bits 16
Table 2.15: RN16.
Figure 2.20: Transmit mask for multiple-Interrogator environment [GS115].
Figure 2.21: Transmit mask for dense-Interrogator environment [GS115].
carrier frequency. In this environment, the ratio between channel S, which is centered in (n.F0)+Fc, (n is an integer) should be respected.
2.5.7 Link Timing
In order to fulfill the communication between reader and tag, time limits need to be re-spected. In Figure 2.22 it is possible to understand the relation between commands and time.
Multi-interrogator environment Dense-interrogator environment |R-S|=1: 10log10(P(S)/P(R)) < -20 dB |n|=1: 10log10(P( SBW)/P(RBW)) < -30 dB
|R-S|=2: 10log10(P(S)/P(R)) < -50 dB |n|=2: 10log10(P(SBW)/P(RBW)) < -60 dB
|R-S|=3: 10log10(P(S)/P(R)) < -60 dB |n|>2: 10log10(P( SBW)/P(RBW)) < -65 dB
|R-S|>3: 10log10(P(S)/P(R))< -65 dB
Table 2.16: Values to respect in power transmit mask [GS115].
During inventory round, it is required to have a continuous wave between each command, sent by the reader. This happens because the tag to get energized and thus, be able to reply to reader commands.
First, the Query command is sent and tag replies with the RN16 command, and at the same time, the T1 must be respected. T1 represents the immediate time that tag can reply, after tag receives a command.
Then, after tag sends a RN16 command, the reader has to send a ACK command with a maximum time limit of T2. T2 represents the time that reader has to demodulate a signal from tag and send a new one. After reader sends the ACK command, the tag has to reply with a PC, EPC and PacketCRC, until T1 time. When reader receives the PC, EPC and PacketCRC, the T2 time is the limit time for reader to send the QueryRep command, or the NAK command. If the T1 and T2 are exceeded, the communication ends. Thus, the times are one of the most important requirement for the communication between reader and tags.
Figure 2.22: Link timing [GS115].
To calculate the T1 and T2 times, the formulas in Table 2.17 are used, which depend on the Backscatter-link pulse-repetition interval (Tpri), Frequency tolerance (FrT) and RTcal values. It should be noted that the Tpri value is calculated according (2.3) and the BLF value is related to (2.4), which will be explained in next section.
Tpri = 1
BLF (2.3)
2.5.8 Backscatter Link Rates and CRC
The BLF value is the symbol frequency sent by the tag. In FM0 encoding the BLF value is the data-rate. The (2.4) specifies the relationship between BLF, Divide Ratio (DR) and
Parameter Minimum Nominal Maximum T1 MAX(RTcal,10Tpri) MAX(RTcal,10Tpri) MAX(RTcal,10Tpri)
×(1-|FrT|)-2µs ×(1+|FrT|)+2µs
T2 3.0 Tpri 20.0Tpri
Table 2.17: Link timing parameters [GS115].
TRcal. Table 2.18 shows the link frequencies and tolerances specified for DR of 64/3 and the Table 2.19 shows the same information for a DR of 8.
BLF = DR
TRcal (2.4)
BLF TRcal FrT FrT Frequency
(µs +/- 1%) (nominal temp) (extended temp) variation
during backscatter 33.3 640 +/-15% +/-15% +/-2.5% 33.3<TRcal<66.7 320<BLF<640 +/-22% +/-22% +/-2.5% 66.7 320 +/-10% +/-15% +/-2.5% 66.7<TRcal<83.3 256<BLF<320 +/-12% +/-15% +/-2.5% 83.3 256 +/-10% +/-10% +/-2.5% 83.3<TRcal≤133.3 160≤BLF<256 +/-10% +/-12% +/-2.5% 133.3<TRcal≤200 107≤BLF<160 +/-7% +/-7% +/-2.5% 200<TRcal≤225 95≤BLF<107 +/-5% +/-5% +/-2.5%
Table 2.18: Tag-to-Interrogator link frequencies for DR=64/3 [GS115].
BLF TRcal FrT FrT Frequency
(µs +/- 1%) (nominal temp) (extended temp) variation
during backscatter 17.2≤TRcal<25 320<BLF≤465 +/-19% +/-19% +/-2.5% 25 320 +/-10% +/-15% +/-2.5% 25<TRcal<31.25 256<BLF<320 +/-12% +/-15% +/-2.5% 31.25 256 +/-10% +/-10% +/-2.5% 31.25<TRcal<50 160<BLF<256 +/-10% +/-10% +/-2.5% 50 160 +/-7% +/-7% +/-2.5% 50<TRcal≤75 107≤BLF<160 +/-7% +/-7% +/-2.5% 75<TRcal≤200 40≤BLF<107 +/-4% +/-4% +/-2.5%
Table 2.19: Tag-to-Interrogator link frequencies for DR=8 [GS115].
The CRC is a parameter used by reader and tag to validate commands in R→T and T→R communication, respectively. The CRC can be the CRC-5 and CRC-16. The first one is explained in Table 2.20 and the second one is explained in Table 2.21
Length Polynomial Preset Residue 5 bits x5+x3+1 010012 000002
CRC Type Length Polynomial Preset Residue ISO/IEC 13239 16 bits x16+x12+x5+1 F F F Fh 1D0Fh
Table 2.21: CRC-16 [GS115].
2.5.9 Short Protocol Overview
After the protocol has been explained, it is possible to make a short overview, to under-stand better the protocol process more easily. Figure 2.23 presents a short overview of some protocol steps.
First a Query command is created, which starts the communication between the reader and the tag. In Figure 2.23 it is possible to observe each parameter, which composes the Query command. However, it should be noted that the preamble part before the Query command is missing. After building the Query command, the coding process starts. As it can be seen, a 1 symbol is encoded with a data-1, and a 0 symbol is encoded with a data-0. As was explained before, the data-1 and the data-0 have different duration. Then, the modulation process starts, and, after that, the command is ready to send, the Query command, to the tag (in this example the OOK modulation was used).
The tag replies with a RN16 command and then this one is decoded. To decode the RN16 command, the tag sends a FM0 preamble, which may contain a pilot tone, or not, sends six symbols, and lastly, sends the RN16. Then, the information from tag is read, using FM0 or Miller encoding (in figure example FM0 encoding was used).
Thereafter, although it is not present in Figure 2.23, the reader starts to build the ACK command, and uses the same process until sending this one to tag. The tag replies with PC, EPC and PacketCRC command, using the same process in RN16 command, like as explained before.
The figure allows to better understand how protocol works and specify all protocol steps, in a summarised form.
Chapter 3
Architectures and Specifications
The purpose of this chapter is to explain the reason why the elements that compose the RFID reader system were chosen, explain the architectures which were used to develop the system and explain the choice of the specifications to test the system.
To develop the RFID reader, like any other system, it is necessary, first of all, to make technical decisions. The technology to use, the equipments, the architecture of the system, the programming language, in other words, the hardware and the software are fundamental choices to initiate the development of system, to make it more efficient as possible. In addition, a specific issue is the communication protocol that should be implemented respecting several details, as explained in previous chapter.
Therefore, the first element taken into account, in this dissertation, was the PXIe-1085 from NI, because it was intended to provide one application for that measurement instrument. For this reason, the LabVIEW programming language was used to develop the entire system. Subsequently, the ISO 18000-6C communication protocol was selected, as mentioned be-fore. This choice was made because this communication protocol operates in UHF range, 860 MHz - 960 MHz, the range that is intended to develop the RFID reader. It is intended to get the tag identification, and to do this, it is only necessary the Inventory Round part of the protocol. The Figure 3.1 shows how the Inventory Round works, and how it will be implemented in this dissertation.
Figure 3.1: Communication between reader and tag.
As shown in Figure 3.1, the Query command is sent to tag with all configurations which are required to communicate. Then, the tag replies with a RN16 command, in case the slot
![Figure 2.16: Miller-signaling state diagram as compared to FM0 state diagram [GS115].](https://thumb-eu.123doks.com/thumbv2/123dok_br/15915122.1093165/46.892.291.616.612.1048/figure-miller-signaling-state-diagram-compared-state-diagram.webp)