Página | 39
https://periodicos.utfpr.edu.br/rbpd
Numerical modelling of the flow rate in
artificial water channels: application to
Ribeira Brava´s stream
ABSTRACT
André Moura
[email protected] University of Madeira - Uma. Funchal. Portugal.
Andrés Silva
[email protected] University of Madeira - Uma. Funchal. Portugal.
Leonardo Gonçalves
[email protected] University of Madeira - Uma. Funchal. Portugal.
Sérgio Lousada
University of Madeira - Uma. Funchal. Portugal.
Water flows that run through urban areas are mostly heterogeneous, thus their characterization must include a formulation that explicitly incorporates spatial variability. The University of Madeira´s Hydraulics Laboratory, Geographic Information Systems and software such as HEC-RAS complemented by spreadsheets constitute viable alternatives for studying the occurrence of floods in river basins.
The purposes of this study are the characterization and development of numerical tools accessing streamflow in artificial water channels, in case of a sudden variation of the tributary flows; application of a hydrodynamic scale model, considering the variable run-off in urban floods, with changes between the variable inflow conditions and the channel´s hydro-morphological conditions; or even the feasibility of the hydrodynamic scale model and its utility to develop flood mitigation measures.
The combined use of all three models (i.e. empirical method, experimental model and HEC-RAS) towards runoff simulation and modelling, reveals itself to be the most appropriate way to prevent urban floods and to develop flood mitigation measures, removing gaps in each of the models used.
KEYWORDS: Artificial water channel; Urban floods; Experimental model; Empirical methods; Geographic Information Systems.
Página | 40
1 INTRODUCTION
With the evolution of times, areas where anthropogenic pressure - which occurs through demographic concentration, buildings and roads - is high, focusing on the vicinity of watercourses that change accordingly, increasing the risk of the occurrence of floods caused by high-intensity and short-duration phenomena. In the occurrence of high-intensity rainfall, the watercourse´s flow increases rapidly and worryingly, as the transport and deposition of sediments leads to the clogging of the canal, resulting in the overflow of the riverbed, with all the inherent damage. The increase in occurrences of this kind, verified using the analysis of climate change models, emerges as a concern of entities in relation to the population and their material goods. Therefore, there is a need to find solutions regarding the coordination and planning of the urban environment, particularly on the issue of stormwater drainage systems. Rainfall analysis, associated with a constantly changing hydrological cycle due to phenomena such as global warming, makes it impossible to find a finite solution, fostering the constant innovation and optimization of multidisciplinary solutions that act on preventive and mitigate flood risk.
As a first stage, using the digital elevation models (DEM) and ArcGIS software made it possible to perform the morphometric characterization of Ribeira Brava´s watershed and its main stream, from which it was possible to obtain geometric parameters, relief characteristics and their drainage system. Subsequently, the rainfall was analyzed using spreadsheets and data provided by specific entities such as the National Water Resources Information System and the Portuguese Institute of the Sea and Atmosphere, with the aim of obtaining daily and annual average values for later use in empirical equations, either to calculate time of concentration values or maximum flood flow rates.
The second step consisted on the selection of flood-prone sections of the water channel so that with the use of the available equipment in the University of Madeira (UMa) Hydraulics Laboratory (experimental model), as well as the HEC-RAS software complemented by a programmed spreadsheet (numerical model), it becomes possible to simulate and model the watershed, obtaining acceptable results according to the expected in a flood situation.
Lastly, some final remarks and a list of objectives to be achieved in the upcoming years are shown, including priority actions and recommendations in order to improve the characterization of the flow rate in artificial water channels and optimize flood prevention and management.
2 METHODOLOGY
The adopted methodology was quantitative, characterized for being nomotetic — that is, that it deals with the establishment of laws and principles or the study of recurrent natural phenomena, thus emphasizing the development of research guidelined by protocols and specific techniques. It stands within the scope of scyentific methods based on the test of hypothesis, therefore feasible for the civil engineering area particularly for Hydraulics.
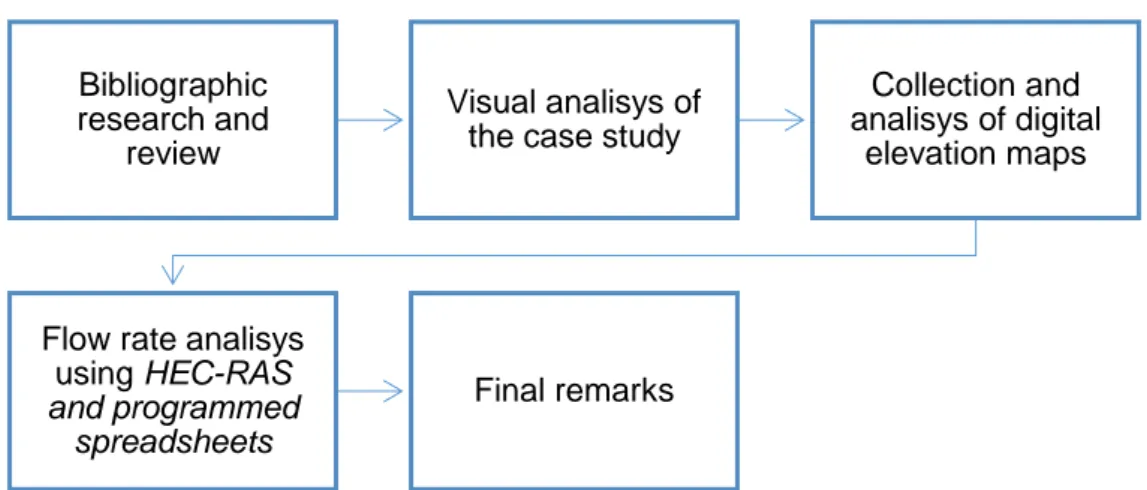
This work was developed according to the organization chart presented in Figure 1, starting of with an extensive bibliographic research and review on the
Página | 41
theme to be addressed, followed by a visual analysis of the areas under study, as well as the collection and analysis of digital elevation maps using ArcGIS software. All results and data obtained were subsequently organized and analysed, with the help of HEC-RAS software and spreadsheets programmed using Microsoft Excel. In the final stage were shown final remarks related to the developed work, as well as suggestions for future work complementing the present study and optimizing the solutions proposed in it.
Figure 1 – Adopted methodology
3 CASE STUDY
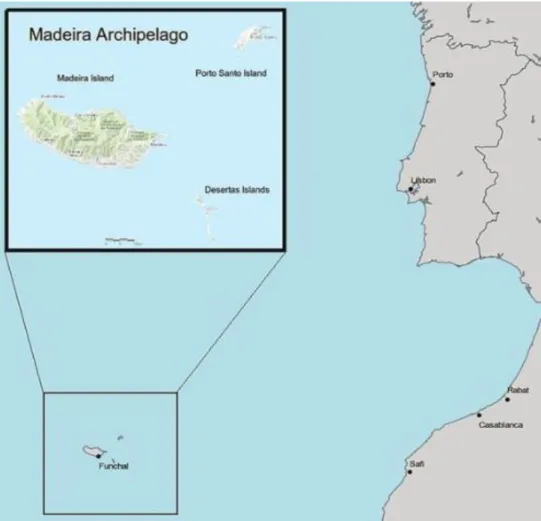
The hydrographic basin under analysis in this study (Ribeira Brava stream), is located on the island of Madeira, belonging to an archipelago of the same name, Figure 2. The Madeira archipelago is geographically located in the North Atlantic, between the latitudes 30º 01' and 33º 08' and the meridians 15º 41' and 17º 16'.
With an area of approximately 802 km², the archipelago consists of a total of seven islands and two islets being: Madeira, with an area of approximately 742 km²; by Porto Santo, with about 43 km²; Desertas with 14 km², and the Selvagens with 3 km² (Camacho et al., 2018).
Bibliographic research and
review
Visual analisys of the case study
Collection and analisys of digital
elevation maps
Flow rate analisys using HEC-RAS and programmed
spreadsheets
Página | 42
Figure 2 – Madeira archipelago
According to Camacho (2015), the Madeira archipelago has specific conditions which contribute to the occurrence of significant floods, namely: the existence of 126 watersheds occupying 741 km2 with 94% of them having a total area of less than 25 km2; The 7 bigger watersheds (excluding Funchal) occupy a corresponding area of approximately 40% of the island of Madeira; The streams are less than 21 km long and time of concentration of less than 2 hours; The rugged relief favours the vertical thrust of sea tropical air masses, usually from the southwest; The volcanic geological substrate is very altered and poorly permeable, so it favouring surface runoff; The morphology of embedded valleys with strict background provides river dynamics and others associated with mass movement.
4 METHODS AND CONCEPTS
As previously stated, in order to perform the correct morphometric characterization of the watershed of Ribeira Brava, were used 3 different methodologies – i.e. empirical methods, experimental model and HEC-RAS complemented by programmed spreadsheets.
Página | 43
4.1 Empirical method and ArcGIS
ArcGIS consists of a geographic information tool created by ESRI in order to use vector and matrix processing for the analysis and characterization of watersheds. With the collection and further analysis of DEM files provided by UMa, containing metadata regarding the altimetry and planimetry of the land, it became possible to access data from Ribeira Brava´s watershed.
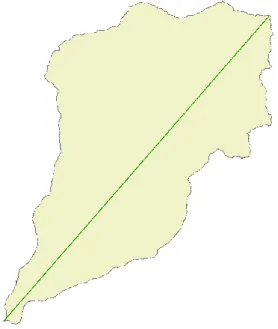
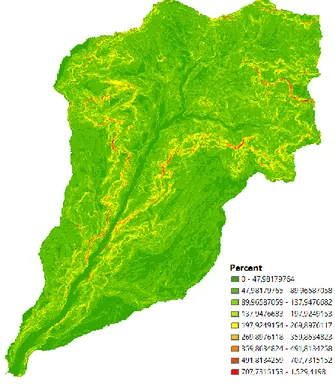
The morphometric characterization began with the production of border delimitation, length and slope maps, as presented in Figure 3, Figure 4 and Figure 5.
Figure 3 – Length of Ribeira Brava´s watershed
Página | 44
Figure 5 – Slope (in percentages) of Ribeira Brava´s watershed
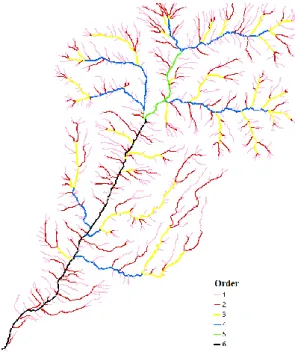
Regarding the flow rate of this particular basin, watercourses were the characterized using Shreve and Strahler´s hierarchies, making it is possible to verify and quantify its drainage density, as seen in Figure 6 and Erro! Fonte de referência não encontrada..
Página | 45
Figure 7 – Strahler classification applied to the Ribeira Brava´s watershed
Acessing the basin´s time of concentration, makes it essential to know parameters such as the gap between the sections under study and their length. Knowing this, it was possible to use ArcGIS in order to create the longitudinal profile of the Ribeira Brava´s watershed main stream, as illustrated in Figure 8.
Figure 8 – Longitudinal profile of Ribeira Brava´s watershed main stream
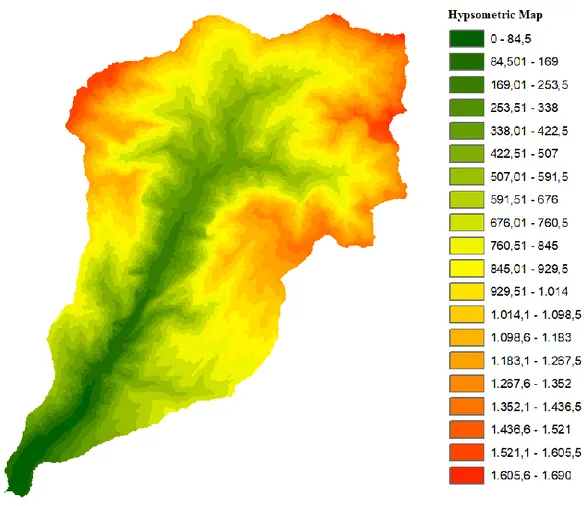
The longitudinal profile of the Ribeira Brava´s watershed main stream was obtained using the hypsometric map of the basin, classifying the areas of the watershed basin by its corresponding height, as presented in Figure 9.
Página | 46
Figure 9 – Hypsometric map of the Ribeira Brava´s watershed
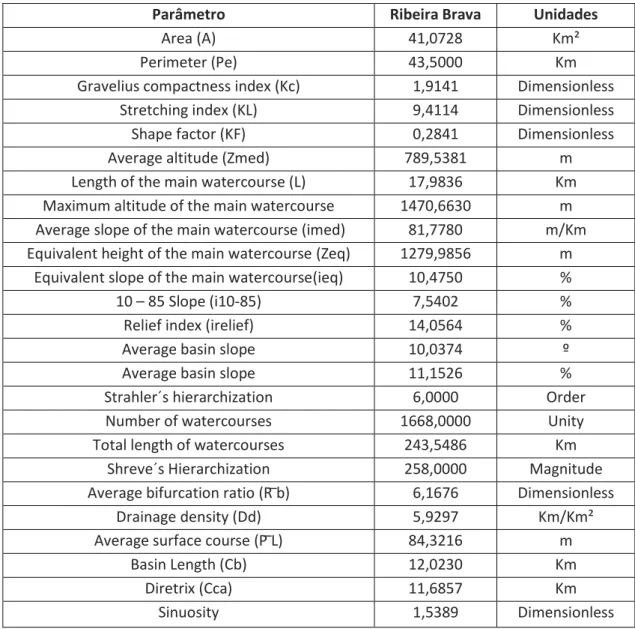
Finally, with the knowledge of the physic and morphometric parameters obtained using ArcGIS software, allows to calculate several other flood prone indicative parameters of Ribeira Brava´s watershed, Table 1. It should be noted that these parameters were calculated using methodologies and equations of several authors in order to obtain average values.
Página | 47
Table 1 – Summary of the watershed´s features
4.1.2 Empirical method
The most relevant parameter to be calculated is time of concentrations using several authors equations, the maximum flood flow rates, the flow velocity, Froude and Reynolds numbers and Manning´s coefficient.
As stated before, the time of concentration is a key parameter for the analysis of a watershed and it is also necessary for the determination of the maximum flood flow rate, which can be considered as the most used parameter in the temporal perspective (Wong, 2009). For Pavlovic and Moglen (2008), this factor infers at the speed with which the watershed responds to the rainfall´s flow rate. It should be taken into consideration that this parameter should be obtained as precisely as it can be, since very high values will result in a much higher maximum flood flow rate than the real one, with the same happening for very low values (Fang et al., 2007).
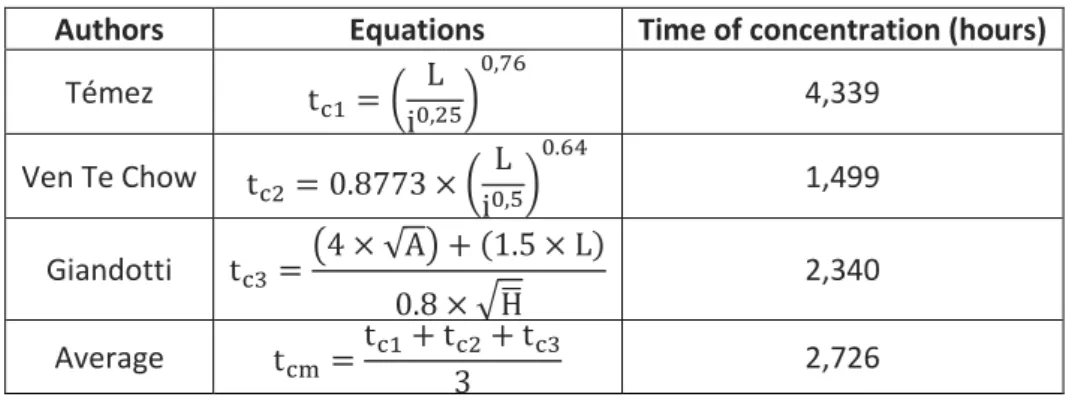
According to Almeida et al. (2013), several equations are presented to calculate the time of concentration as shown in Table 2, as well as its respective
Parâmetro Ribeira Brava Unidades
Area (A) 41,0728 Km²
Perimeter (Pe) 43,5000 Km
Gravelius compactness index (Kc) 1,9141 Dimensionless
Stretching index (KL) 9,4114 Dimensionless
Shape factor (KF) 0,2841 Dimensionless
Average altitude (Zmed) 789,5381 m
Length of the main watercourse (L) 17,9836 Km
Maximum altitude of the main watercourse 1470,6630 m Average slope of the main watercourse (imed) 81,7780 m/Km Equivalent height of the main watercourse (Zeq) 1279,9856 m
Equivalent slope of the main watercourse(ieq) 10,4750 %
10 – 85 Slope (i10-85) 7,5402 %
Relief index (irelief) 14,0564 %
Average basin slope 10,0374 º
Average basin slope 11,1526 %
Strahler´s hierarchization 6,0000 Order
Number of watercourses 1668,0000 Unity
Total length of watercourses 243,5486 Km
Shreve´s Hierarchization 258,0000 Magnitude
Average bifurcation ratio (R ̅b) 6,1676 Dimensionless
Drainage density (Dd) 5,9297 Km/Km²
Average surface course (P ̅L) 84,3216 m
Basin Length (Cb) 12,0230 Km
Diretrix (Cca) 11,6857 Km
Página | 48
calculation processes. The easiest way to understand this parameter was established by Chow et al. (1988), where it is stated that the time of concentration refers to the estimated amount of time needed for the rainfall that occurred at the farthest point to reach corresponding final section of the watershed. The calculation of this parameter was developed by several authors, and each of the empirical equations results from their limitations, such as the total area of the hydrographic basin under study.
Table 2 – Calculation of time of concentration
Authors Equations Time of concentration (hours)
Témez tc1= ( L i0,25) 0,76 4,339 Ven Te Chow tc2= 0.8773 × ( L i0,5) 0.64 1,499 Giandotti tc3 = (4 × √A) + (1.5 × L) 0.8 × √H̅ 2,340 Average tcm = tc1+ tc2+ tc3 3 2,726
According to Rodrigues et al. (2011), the concept of flooding is not completely standardized, and in some cases, it is directly linked to the occurrence of an extreme event, such as flooding of land adjacent to the stream bed. From the hydrological point of view, the concept refers to the occurrence of surface runoff, relating itself to the first concept presented.
Thus, empirical, kinematic and statistical methodologies were established to determine the maximum flood flow rates, as presented in Table 3. Regarding the empirical methodologies used to calculate the maximum flood flow rate, they consider that the parameter depends exclusively from the total area of the watershed, (Lousada and Camacho, 2018). Considering this, the equations should only be applied to watersheds with similar features and limitations as the ones studied by the authors (Rodrigues et al., 2011).
Table 3 – Calculation of flow rates
Authors Equations Flow rate
(m3/s) Forti 𝐐𝐩𝟏= 𝐀𝐛∙ (𝐛 ∙ 𝟓𝟎𝟎 𝐀𝐛+ 𝟏𝟐𝟓 + 𝐜) 338,856 Iskowski 𝐐𝐩𝟐= 𝐊𝐈𝐬∙ 𝐦𝐈∙ 𝐏̅ ∙ 𝐀𝐛 343,846 Pagliaro 𝐐𝐩𝟑= 𝐀𝐛∙ ( 𝟐𝟗𝟎𝟎 𝟗𝟎 + 𝐀𝐛 ) 908,740 Giandotti 𝐐𝐩𝟒= 𝛌 ∙ 𝐀𝐛∙ 𝐡𝐦𝐚𝐱 𝐭𝐜 302,323 Mockus 𝐐𝐩𝟓= 𝟐, 𝟎𝟖 ∙ 𝐀𝐛∙ 𝐏𝐞 √𝐭𝐜+ 𝟎, 𝟔 ∙ 𝐭𝐜 396,358 Témez 𝐐𝐩𝟔= 𝐂 ∙ 𝐈 ∙ 𝐀𝐛 𝟑 714,961 Average 𝑸𝐩𝐦 =𝑸𝐩𝟏+ 𝑸𝐩𝟐+ 𝑸𝐩𝟑+ 𝑸𝐩𝟒+ 𝑸𝐩𝟓+ 𝑸𝐩𝟔 𝟑 500,848
Página | 49
4.2 HEC-RAS & programmed spreadsheets
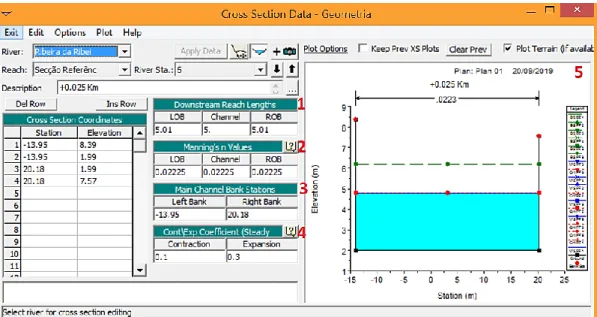
The use of HEC-RAS software complemented with spreadsheets programmed in Microsoft Excel allow to determine the possibility of flooding by analysing the energy lines, stream bottom level, and free surface level, as well as its relation with the water level during an event of high-intensity rainfall, Figure 10. On the other hand, this method allows the calculation of parameters that characterize flow rate under these conditions, such as Froude and Reynolds numbers, the velocity or even the water´s critical height.
4.2.1 HEC-RAS
The U.S. Army Corps of Engineers River Analysis System, alias HEC-RAS is an integrated software system, used to evaluate one-dimensional flows, either uniform or not, in natural or artificial water channels, also evaluating the transport of sediments and water quality. This system consists of a graphical user interface, with the ability to store and manage data with hydraulic analysis components and the production of reports and graphs.
Figure 10 – Cross section geometry editor, HEC-RAS
4.2.2 Programmed spreadsheet
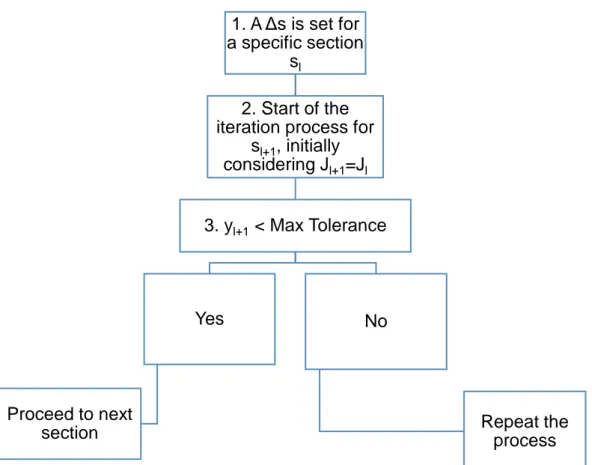
To determine the water surface profiles it was needed to programme a spreadsheet in Visual Basic language, based on others already created in the Curricular Unit of "Maritime and River Works", taught at UMa. Figure 11 shows all the calculations executed by the previously mentioned programmed spreadsheet. This is an iterative process that considers the finite difference method with successive approximations until it reaches the established tolerance.
Página | 50
Figure 11 – Schematic representation of the programmed spreadsheet iteration process
Another programmed spreadsheet was then created contemplating the parameters referring to the sections under study, particularly Manning´s coefficient or even Froude and Reynolds numbers. To define Manning´s coefficient as correctly as possible it became necessary to recognize the conservation status of the water channel, walls and bottom — as its roughness deeply influences the definition of the flow. The coefficient was established using a weighted average considering that the section was made 75% of poor condition concrete with n = 0.018 and 25% of dry-stone masonry also in poor condition with n = 0.035, resulting in the average value of n = 0.022 m-1/3s.
4.3 Experimental model
The multifunction channel used to carry out this study corresponds to a basic model, since the support of the many accessories only allows the measurement of water level, the remaining parameters (velocity, area, perimeter amongst others), are obtained using a programmed spreadsheet.
Before the simulation, the slope of the multifunction channel must be adjusted to the desired value (in this case 2%). After turning on the pump, the flow control valve is slowly opened until it reaches the desired value. After stabilizing the flow, the equipment used to obtain the water level values is placed at pre-established stations at 9, 41, 91, 141, 191, 241 cm of water inlet of the multifunction channel. The reason for choosing these values is the dimensions of the level indicator that can only be placed 9 cm either from the end and beginning
1. A Δs is set for
a specific section
s
l2. Start of the
iteration process for
s
l+1, initially
considering J
l+1=J
l3. y
l+1< Max Tolerance
Yes
Proceed to next
section
No
Repeat the
process
Página | 51
of the channel. Thus, the channel has an effective length of 2.32 m along which it is possible to measure the height of water. In order to obtain the value of the water level, it must be calculated an average of the values recorded in 3 different tests, as shown in Table 4.
Table 4 – Water level measurement # Section Water level (m)
I= 2% 1 0 0,0480 1 0,0380 2 0,0360 3 0,0340 4 0,0355 5 0,0350 2 0 0,0480 1 0,0380 2 0,0360 3 0,0335 4 0,0350 5 0,0350 3 0 0,0485 1 0,0375 2 0,0355 3 0,0330 4 0,0340 5 0,0340 Average 0 0,0482 1 0,0378 2 0,0358 3 0,0335 4 0,0348 5 0,0347
The flow rate is mainly influenced by forces — i.e. inertia and gravity, which is equivalent to analyse the experimental model based on Froude´s law. The ratio between the values of the different parameters measured either in the experimental model and in the "real" case (HEC-RAS software) are presented in Table 5.
Table 5 – Ratio between the “real” case (r) and the experimental model´s measurement
Qr/Qm br/bm Lr/Lm hr/hm vr/vm Jr/Jm 200339,100 480,348 10,775 52,904 7,723 0,2143
The values presented on the previous table like the water level, flow rate´s velocity and pressure loss represent an average value. In the numerical model case, the channel´s length has no influence over the analysis, concerning the geometric
Página | 52
reduction effects. On the other hand, in the case of the experimental model the ratio between the model and the real case can influence the results obtained through it. However, geometric reduction effects may be put aside, if some conditions for relevant flow parameters are ensured, namely: for turbulent flows, in the experimental model and in the "real" case, if Reynolds' numbers are ensured above the laminar flow transition zone to turbulent, even if different, the similarity is satisfactory; for cross sections of the flow with dimensions that aren´t too small — widths greater than 8 or 10 cm and flow depth greater than 2 cm — scale effects prove to be irrelevant.
4.4 Comparative analisys
In this subchapter are shown the results of the study of the flow rate carried out using a programmed spreadsheet, the HEC-RAS software and the experimental model, for Ribeira Brava watershed´s main stream, see Table 6, Table 7, Table 8 and Table 9.
The results for the last 25 m stretch of Ribeira Brava watershed´s main stream, obtained through the programmed spreadsheet and the HEC-RAS software are very similar, proving that for the section studied and considering an average flow rate of 500.847 m3/s, slope of 2% and Manning´s coefficient of 0.022 m-1/3s, presents generally Froude numbers greater than 1 and Reynolds numbers greater than 5000, which means that the flow is either rapid and turbulent.
Table 6 – Programmed spreadsheet
Section L (m) b (m) h (m) Q (m³/s) U (m/s) Ks Froude Reynolds
0 0 34,13 3,507 500,85 4,185 0,022 0,714 12052755,033
1 25 41,31 1,698 500,85 7,139 0,022 1,750 11092024,276
Table 7 – HEC-RAS.
Section L (m) b (m) h (m) Q (m³/s) U (m/s) Ks Froude Reynolds
0 0 34,13 2,79 500,85 5,26 0,022 1,006 12487759,025
1 25 41,31 1,66 500,85 7,30 0,022 1,811 11111111,604
Table 8 – Experimental model
Section L (m) b (m) h (m) Q (m³/h) U (m/s) Ks Froude Reynolds
0 0 0,086 0,048 9 0,604 0,022 0,878 13575,398 1 0,41 0,086 0,038 9 0,768 0,022 1,262 15310,809 2 0,91 0,086 0,036 9 0,811 0,022 1,369 15699,244 3 1,41 0,086 0,034 9 0,868 0,022 1,514 16178,088 4 1,91 0,086 0,035 9 0,835 0,022 1,428 15900,948 5 2,32 0,086 0,035 9 0,839 0,022 1,439 15935,070
Página | 53
Table 9 – After transformation
Section L (m) b (m) h (m) Q (m³/h) U (m/s) Ks Froude Reynolds
0 0 34,13 2,548 2E+06 4,661 0,022 0,933 10232538,586 1 4,42 34,01 2,002 2E+06 5,934 0,022 1,340 10522029,274 2 9,81 33,90 1,896 2E+06 6,266 0,022 1,454 10577490,299 3 15,19 33,80 1,772 2E+06 6,702 0,022 1,608 10644250,654 4 20,58 37,52 1,843 2E+06 6,446 0,022 1,517 10708581,667 5 25 41,31 1,834 2E+06 6,477 0,022 1,528 10801418,953
The following graphs refer to each of the analysis methods used, containing the energy line (E), the free surface level (Y), the stream bottom level (Z) and the velocity (U), Figure 12, Figure 13 and Figure 14.
Figure 12 – Programmed spreadsheet´s results
Figure 13 – HEC-RAS results
Figure 14 – Experimental model´s results
After analysing the previously presented charts, both the stream bottom level, the free surface level and the energy lines decrease from upstream to downstream, and the velocity increases reversely. For the same stretch and for the value of the flow rate and drain conditions admitted, it was found that the water
Página | 54
level does not exceed the height of the walls, a fact that can be observed in Figure 15 and Figure 16.
Figure 15 – Upstream section obtained using HEC-RAS
Figure 16 – Downstream section obtained using HEC-RAS
5 FINAL REMARKS
This study can be summarized in the characterization of the main parameters of Ribeira Brava watershed´s main stream and further simulation of its flow rate on a smaller scale. These goals were achieved, considering that:
• For the calculation of flow rates and times of concentration, were used empirical and semi-empirical equations due to their practical application, however it is noticed that the application of these
Página | 55
methodologies is restricted to preconditions so that parametric values with acceptable errors can be obtained;
• The present study was developed based on three main methodologies: the experimental model, programmed spreadsheets and the HEC-RAS software;
• Considering the recurrence interval (T) of 100 years, it was found that in all upstream stations the flow rates are characterized as subcritical or slow (Fr < 1) and turbulent (Re > 5000), and all downstream flows as fast (Fr > 1) and also turbulent (Re > 5000). The analysis of these parameters corroborates that the methodologies used are valid, presenting expected results if related to the verified section;
• Since the minimum and maximum flow rate velocities are 0.75 and 4.5 m/s in case of high-intensity short-duration rainfall events as suggested by Tomas (2011), the flow rate will be considerably higher than the maximum suggested, which will cause the wear of the bottom of the channel and the subsequent reduction of the flow´s capacity;
• Due to a factory defect located at the bottom of the multifunction channel used to simulate the flow, there was an increase of the level of water at approximately 3/4 of the length of the canal, so that the expected result would be the gradual reduction of the water´s level from upstream to downstream. Therefore, it should be emphasized that it would be ideal for this study to simulate the flow rate in an artificial channel in perfect conditions;
• Even if physical models show reliable results without the need to perform simplifications, this methodology usually characterizes itself as time consuming and is susceptible to imperfections and scale problems;
• It was necessary to assign the equivalent length to the last station, since the programmed spreadsheet does not consider the final section. Therefore, it was considered a 0.5 m variation.
The following objectives were presented in this study´s summary:
• Characterization and development of numerical tools for the simulation of the flow rate in artificial channels, in case of a sudden variation of the affluent flows;
• Application of a hydrodynamic model at simulation scale, considering free surface variable flows in flooding events, under unstable conditions of the influxes and the hydro-morphological conditions of the channel;
• Analysis of the feasibility of the simulation at scale of the model, management and prevention of floods in artificial channels.
For the first objective, the gulf curves were determined using the programmed spreadsheet, which was based on other spreadsheets created for the curricular unit of "Maritime and River Works" of the master’s degree in Civil Engineering at the University of Madeira. Since the spreadsheet considers geometry restrictions
Página | 56
and flow constancy, the HEC-RAS software proved to be a viable solution to get to know parameters that couldn´t be calculated by the programmed spreadsheet.
Concerning the second objective, the simulation at scale using the experimental model presented satisfactory results when compared to the other two methods (empirical and HEC-RAS). Amongst all the analysis capacities performed throughout the present study, it is hereby highlighted the possibility of accessing the flow´s behaviour as the hydraulic parameters are changed.
The third and final objective was accomplished simultaneously with the second, as the results obtained may be considered satisfactory despite all experimental errors. Therefore, it is also highlighted that the experimental model is considered an important tool for the hydraulic study of streams and subsequently prevent floods.
Regarding the morphometric aspect of the Ribeira Brava watershed, it was possible to conclude that this basin has a high-contribution area comparing to other Madeira island´s basins. In addition, the parameters indicate that the watershed has a high drainage density, meaning that a greater amount of flow sections contribute to the occurrence of floods. By contrast, it is an elongated basin meaning that there is a low probability of high-intensity rainfall affecting the entire basin.
Finally, the extreme phenomena of 2010 corroborates the present study results, showing that there is a need to improve the Ribeira Brava´s watershed urban drainage system in order to prevent flooding events.
Página | 57
Modelagem numérica da vazão em canais
artificiais de água: aplicação ao córrego da
Ribeira Brava
RESUMO
Os fluxos de água que percorrem o interior das zonas urbanas são maioritariamente heterogéneos, pelo que a sua caracterização necessita de uma formulação que incorpore explicitamente essa variabilidade espacial. Para tal, o Laboratório de Hidráulica da Universidade da Madeira, os Sistemas de Informação Geográfica e softwares como o HEC RAS complementados por folhas de cálculo programadas, revelam-se como alternativas viáveis ao estudo de bacias hidrográficas, nomeadamente quanto à ocorrência de fenómenos de cheias e inundações.
Os objetivos principais deste estudo são a caracterização e desenvolvimento de ferramentas numéricas de simulação do comportamento do escoamento em canais artificiais, no caso de uma variação súbita dos caudais afluentes; a aplicação de um modelo à escala de simulação hidrodinâmico, considerando os escoamentos variáveis em superfície livre no caso de situações de cheia, na simulação entre as condições variáveis das afluências e das condições hidromorfológicas do canal ou ainda a análise da viabilidade da simulação com o modelo à escala na gestão e prevenção de cheias em canais artificiais. A utilização conjunta dos três modelos (i.e. método empírico, modelo experimental e HEC-RAS) de caraterização, simulação e modelação do escoamento revela-se como a forma mais apropriada para o auxílio na prevenção e sobretudo na instauração de medidas mitigadoras de cheias e inundações, uma vez que permite suprimir lacunas da análise individual de cada um dos modelos.
PALAVRAS-CHAVE: Canal de água artificial; Cheias Urbanas; Modelo experimental;
Página | 58
REFERÊNCIAS
Almeida, I. K. & Anache, J. A. A. & Almeida, V. R. & Sobrinho, T. A. (2013). Estimativa de tempo de concentração em bacia hidrográfica. XX Simpósio Brasileiro de Recursos Hídricos. Associação Brasileira de Recursos Hídricos.
Camacho, R. F. & Lousada, S. & Castanho, R. (2018a), 1001 Modelling Torrential Rain Flows in Urban Territories: Floods. The Case Study of Madeira Island. ISBN 978-989-8780-06-5.
Camacho, R. F. (2015). Caracterização, Simulação (à escala) e Modelação do Escoamento em Canais Artificiais. Aplicação a caso de estudo. Dissertação submetida para o grau de Mestre em Engenharia Civil na Universidade da Madeira, Funchal. 132 p.
Chow, V. T. & Maidment, D. R. & Mays, L. W. (1988). Applied hydrology. New York. McGrawHill, 570 p.
Fang, X. & Thompson, D. B. & Cleveland, T. G. and Pradhan, P. (2007). Variations of time of concentration estimates using NRCS velocity method. Journal of Irrigation and Drainage Engineering 133 (4), pp. 314–322.
França, J. A., & Almeida, A. B. (2003). Plano regional de água da Madeira. Síntese do diagnóstico e dos objectivos.
Lousada, S. & Camacho R. (2018). Hidrologia, Recursos Hídricos e Ambiente - Aulas Teóricas. Acedido em 20 de Março de 2019, no Web site do repositório científico digital da Universidade da
Madeira: https://digituma.uma.pt/handle/10400.13/2132
Lousada, S. & Camacho R. (2018). Hidrologia, Recursos Hídricos e Ambiente - Aulas Práticas. Acedido em 20 de Março de 2019, no Web site do repositório científico digital da Universidade da
Madeira: https://digituma.uma.pt/handle/10400.13/2131
Pavlovic, S. B. & Moglen, G. E. (2008). Discretization issues in travel time calculation. Journal of Hydrologic Engineering 13(2), pp. 71–79.
Rodrigues, C. M., Moreira, M., & Guimarães, R. C. (2011). Apontamentos para as aulas de hidrologia. Évora: Departamento de Engenharia Rural. Obtido de
Página | 59
https://dspace.uevora.pt/rdpc/bitstream/10174/4721/1/Apontamentos_hidrolo gia.pdf
Tomaz, P. (2011). Curso de Manejo de águas pluviais, Capítulo 50 – Fórmula de Manning e canais.
Wong, T. S. W. (2009). Evolution of kinematic wave time of concentration
formulas for overland flow. Journal of Hydrologic Engineering 14 (7), pp. 739-744.
Recebido: 17 out. 2019. Aprovado: 21 nov. 2019. DOI: 10.3895/rbpd.v9n1.10974
Como citar: SILVA. A.; MOURA, A.D. S.; GONÇALVES, L. B.; LOUSADA, S. A. N. Numerical modelling of the flow rate in artificial water channels: application to Ribeira Brava´s stream. R. bras. Planej. Desenv. Curitiba, v. 9, n. 1, p. 39-59, jan./abr. 2020. Disponível em: <https://periodicos.utfpr.edu.br/rbpd>. Acesso em: XXX.
Correspondência:
Ségio António Neves Lousada
Rua dos Ferreiros Colégio dos Jesuítas, 9000-082 – Funchal – Portugal
Direito autoral: Este artigo está licenciado sob os termos da Licença CreativeCommons-Atribuição 4.0 Internacional.