Synechocystis ferredoxin/ferredoxin-NADP
+
-reductase/NADP
+
complex: Structural model obtained by NMR-restrained docking
P. Nuno Palma
a, Bernard Lagoutte
b, Ludwig Krippahl
a,
Jose´ J.G. Moura
a, Franc¸oise Guerlesquin
c,*aREQUIMTE, Departamento de Quı´mica, Faculdade de Cieˆncias e Tecnologia, Universidade Nova de Lisboa, 2859-516 Caparica, Portugal b
Service de Bioe´nerge´tique, URA 2096, CNRS, De´partement de Biologie Joliot Curie, CEA Saclay, 91191 Gif sur Yvette Cedex, France
cUnite´ de Bioe´nerge´tique et Inge´nierie des Prote´ines, IBSM-CNRS, 31 chemin Joseph Aiguier, 13402 Marseille Cedex 20, France
Received 16 May 2005; revised 27 June 2005; accepted 5 July 2005 Available online 8 August 2005
Edited by Miguel De la Rosa
Abstract
Ferredoxin (Fd) and ferredoxin-NADP
+-reductase
(FNR) are two terminal physiological partners of the
photosyn-thetic electron transport chain. Based on a nuclear magnetic
res-onance (NMR)-restrained-docking approach, two alternative
structural models of the Fd–FNR complex in the presence of
NADP
+are proposed. The protein docking simulations were
per-formed with the software BiGGER. NMR titration revealed a
1:1 stoichiometry for the complex and allowed the mapping of
the interacting residues at the surface of Fd. The NMR chemical
shifts were encoded into distance constraints and used with
the-oretically calculated electronic coupling between the redox
cofactors to propose experimentally validated docked complexes.
Ó 2005 Published by Elsevier B.V. on behalf of the Federation of
European Biochemical Societies.
Keywords: Ferredoxin; Ferredoxin NADP
+-reductase;
Complex; Docking and NMR
1. Introduction
Short-lived non-covalent complexes formed between
elec-tron-transfer proteins are essential for the function of energy
conserving systems such as photosynthesis and respiration.
The molecular recognition process involves sequential steps:
formation of a transient complex, electron transfer,
dissocia-tion and diffusion. The active sites must come in close contact
to produce an efficient electron-transfer device, being the
spec-ificity and the efficiency of the electron transfer dictated and
controlled by the details of the non-covalent interactions.
While the three-dimensional (3D) structures as well as a wealth
of information are available for many redox proteins, very few
structures of electron-transfer complexes have been solved to
date. Due to the low affinity constants, it is difficult to obtain
co-crystals of these transient complexes. However, two
struc-tures of the FNR/ferredoxin (Fd) complexes from Z. Maize
and Anabaena PCC7119 have been solved by crystallography
[1,2]
. In order to give a model of the ternary NADP/FNR/
Fd complex, we have used in the present paper a nuclear
mag-netic resonance (NMR)-restrained docking approach
[3–5]
.
Ferredoxin-NADP
+-reductases (FNR) are flavine adenine
dinucleotide (FAD) flavoproteins that catalyze the reduction
of nicotinamide adenine dinucleotide phosphate (NADP
+) to
NADPH during photosynthesis in plant, algae or
cyanobacte-ria
[6]
. The electron transfer from photosystem I to FNR is
mediated by a (2Fe–2S) Fd
[7]
. Fd is a small ubiquitous soluble
protein involved in many cellular processes from prokaryotes
to eukaryotes
[8]
. NMR allowed us to investigate the
forma-tion of a complex between FNR and Fd from Synechocystis
sp. PCC 6803 (Synechocystis), in the presence or the absence
of NADP. On the basis of sequence alignment (
Fig. 1
), a
struc-tural model of FNR has been obtained, and NMR-restrained
docking enables us to propose two structural working models
of the Fd/FNR/NADP
+ternary complex.
2. Materials and methods
2.1. Expression and purification of the15N labeled Fd
The petF gene was PCR amplified, cloned and used for overexpres-sion as previously reported[9]. The minimal medium (M9) was supple-mented with 15N ammonium sulfate (ISOTEC Inc., Matheson
company, Miamisburg, USA). Purification of Fd was essentially as previously described[10]with an additional last step using hydropho-bic chromatography (HiLoad phenyl Sepharose 16/10 from Pharma-cia) eluted using a reverse gradient of ammonium sulfate (2.5–0 M) in 60 mM tricine buffer at pH 7.8. The final 422–276 OD ratio was of 0.55. Fd was equilibrated in 10 mM phosphate buffer and concen-trated by ultrafiltration up to 4 mM as measured at 422 nm using an extinction coefficient of 9.68 mM 1cm 1.
2.2. Expression and purification of FNR
The plasmid encoding a truncated form of the petH gene was a gift of Dr. J. van Thor, modified in order to start translation at the codon 113 of the original gene[11]. Purification procedure of Synechocystis FNR followed a similar scheme as for Fd. Overexpressed FNR was precipitated between 55% and 70% ammonium sulfate saturation and solubilized in 20 mM tricine, pH 7.8. The protein sample first loaded on a Hitrap Q Sepharose HP column (Pharmacia) was further purified on a phenyl Sepharose matrix (HiLoad phenyl Sepharose 16/ 10 from Pharmacia) eluted by a reverse ammonium sulfate gradient (1.6–0 M in tricine 80 mM, pH 7.8). Pure FNR was eluted at 0.85 M salt. The 460–274 OD ratio after dialysis against 10 mM phosphate, pH 6.5, was 0.14. The protein concentration for NMR studies was esti-mated based on an extinction coefficient of 10.8 mM 1cm 1 at 460 nm.
Abbreviations: FAD, flavine adenine dinucleotide; Fd, ferredoxin; FNR, ferredoxin-NADP+-reductase; HSQC, heteronuclear single quantum coherence; NADP+, nicotinamide adenine dinucleotide
phosphate; NMR, nuclear magnetic resonance; Synechocystis, Synechocystis sp. PCC 6803
*
Corresponding author. Fax: +33 4 91 16 45 78.
E-mail address:[email protected](F. Guerlesquin).
0014-5793/$30.00 Ó 2005 Published by Elsevier B.V. on behalf of the Federation of European Biochemical Societies. doi:10.1016/j.febslet.2005.07.027
2.3. Nuclear magnetic resonance
NMR experiments were carried out on a Bruker DRX500 spec-trometer at 293 K. 2D1H–15N heteronuclear single quantum coher-ence (HSQC) spectra were recorded using a watergate pulse sequence in the TPPI mode. The spectral widths are 2500 Hz for
1
H and 2027 Hz for 15N. 1024 data points in t2 and 64 transients
for each 128 t1 were used. The 1H and 15N chemical shifts of the
free-Fd were found in agreement with those previously reported
[12]. Two sets of NMR titration experiments were performed with Fd samples, respectively, at 0.05 and 0.1 mM concentrations, in 10 mM phosphate buffer, pH 6.5, 10% D2O. Small amounts of
either FNR or FNR–NADP+ (1:1) complex (2 mM concentration) were added to the Fd sample to obtain 0.12, 0.25, 0.5, 1, 2 or 5 M equivalents to Fd concentration.
2.4. Modeling
The structure of Synechocystis FNR was obtained by homology modeling using the X-ray structure (as template) of the homologous protein from Anabaena (sequence homology between the two proteins is 65%). The sequences were aligned (Fig. 1A) with the program ClustalW (http://www.ebi.ac.uk/clustalw) and that of the target molecule was overlaid on the 3D structure of the template pro-tein. The atomic coordinates of the highest resolution structure of Anabaena FNR (pdb:1QUE, 1.8 A˚ ) were used to model Synechocystis FNR apo-protein. Since 1QUE lacks the structure of NADP+, the atomic coordinates of the co-substrate were taken from the 3D struc-ture of Pea FNR (pdb:1QFY) and merged into the final Synechocys-tis structure. Note that the residues of the co-substrate binding pocket are extremely conserved; of the 23 residues that make close contacts (<4 A˚ ) with NADP+in the Pea FNR structure, 18 are
con-served, 4 show conservative mutations and only the C-terminal
Ser308 is substituted by a non-equivalent Tyrosine residue in Syn-echocystis. Therefore, it is fair to assume that the two proteins may stabilize the substrate in the same conformation. A coarse struc-ture prediction was first performed at the Swiss-Model web server
[13]and the final model was optimized by energy minimization with the MMFF94 force field, as implemented in the molecular modeling package Sybyl (Tripos Inc., 1699 South Hanley Rd., St., Louis, MO 63144, USA.).
A structure of Synechocystis Fd is available from NMR, but lacks well resolved coordinates around the region of the FeS cluster. There-fore, a new model of the Fd was generated by overlaying the amino acid sequence of the Synechocystis protein onto the X-ray structure of the homologous Fd from Anabaena (pdb:1QT9, 1.3 A˚ ) (sequence homology is 70%, Fig. 1B), followed by structure refinement, as described above.
2.5. Docking
Molecular interaction simulations were performed using the protein-docking algorithm BiGGER v.1.0[5,14], and the entire molecular sur-faces were searched, therefore, assuming no prior knowledge of the interacting surface regions.
2.6. NMR filtering
The perturbations of NMR chemical shifts of Fd caused by the presence of FNR can be used to probe the amino acids more closely involved in the formation of the complex. Once assigned to specific amino acids, these chemical shift perturbations may be translated into distance constraints, assuming that a nucleus is affected if it is within an arbitrary distance of 8 A˚ from any atom of the other partner. Only those solutions that minimize the number of con-straint violations are retained for subsequent analysis.
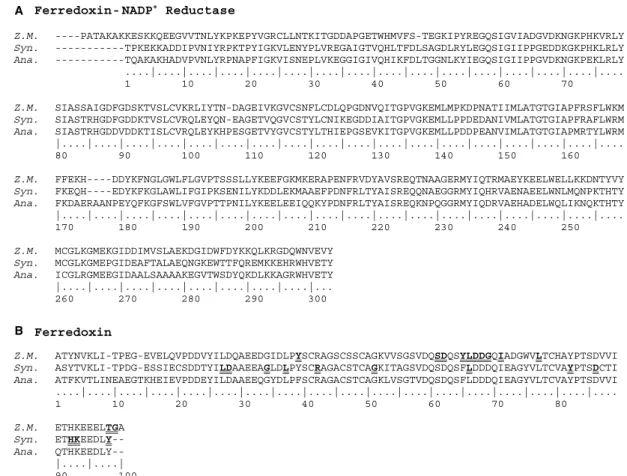
A
B
Fig. 1. Multiple sequence alignment for (A) FNRs and (B) Fds, from Z. Maize (Z.M.), Synechocystis (Syn.) and Anabaena (Ana.). Sequence numbering was taken from Anabaena. Residues mapped by NMR in Maize system[2]and in Synechocystis (this work), are displayed in double underline and bold. Multiple sequence alignment was performed with ClustalW.
2.7. Electron tunneling pathway filtering
The first-order rate constant for electron transfer ket between a
donor and an acceptor at fixed distance and orientation may be generally described by Marcus theory[15]. In the case of the elec-tron-transfer reaction between the redox centers of two interacting proteins, ket depends essentially on temperature, DG
0
(determined by the difference in redox potentials), the reorganization energy and the electronic coupling between the two redox centers. This last parameter is approximated by a decay function which is influenced by the distance and nature of the intervening medium, i.e., the nat-ure of the putative electron-transfer pathway. For the purpose of comparing alternative binding orientations between two proteins, the first three contribution terms of ketmay be considered
approx-imately constant and therefore, the structures presenting higher electronic coupling values should also allow for faster electron-trans-fer rates.
3. Results and discussion
3.1. NMR titration
15
N–
1H HSQC experiments carried out on
15N labeled Fd
in the presence of FNR alone or NADP
+-bound FNR
revealed identical modifications of 12 resonances of the
Fd. Among the 76 assigned residues of the Fd
[12]
, 7
residues (L25, L35, R40, G49, L64, H90 and K91) were
found substantially affected during the complex formation,
in both cases (
Fig. 2
A). These resonances, corresponding
to residues close to the FeS center of the Fd, are broaden
in the spectrum of the free-Fd and progressively disappeared
during the complex formation with FNR. However, the
shifts of theses resonances, still observable at low FNR
con-centrations indicate that the corresponding amino acids are
at the interacting site and that the complex is in fast
exchange at the NMR time scale. Five other resonances,
assigned to residues D26, G32, Y80, D84 and Y96, shifting
more than 0.2 ppm for
15N during the complex formation
(
Fig. 2
B), were also selected. These 12 residues fairly
dispersed through the Fd surface that surrounds the FeS
center were used to define distance constraints to filter the
docking results.
As attested by the saturation curves obtained from the Y96
chemical shift variations (
Fig. 2
C), the stoichiometry of the
Fd/FNR and Fd/FNR–NADP
+complexes was found to be
1:1. This stoichiometry is in agreement with gel filtration
experiments (data not shown and
[16]
). The titration curves
show that the affinity of the two proteins is slightly increased
by the presence of NADP
+(
Fig. 2
C). For this reason, we have
investigated the docking of the two proteins in the presence of
NADP
+.
3.2. Docking experiments
It is now generally assumed that transient complexes such
as the ones formed between electron-transfer proteins have
typically low association constants and are driven by
long-range electrostatic interactions that favor the dynamic nature
of their formation and dissociation. Due to the particular
nature of such interaction, reliable docking simulations of
electron-transfer complexes are more difficult to accomplish
using general purpose docking algorithms. Instead, we have
previously developed a successfully constrained docking
hy-brid methodology
[3–5]
, which enriches the docking search
space with solutions that are compatible with experimental
evidence.
The present docking experiment was performed using
Syn-echocystis FNR/NADP
+and Fd model structures described
in Section 2. BiGGER protein docking algorithm was used
Fig. 2. (A)15N–1H HSQC spectra of15N labeled Fd from
Synecho-cystis in the absence of FNR (in black), and in the presence of NADP-bound FNR at a 1:0.5 Fd/FNR ratio (in red). The NMR experiments were recorded with a 500 MHz NMR spectrometer, at 293 K. The Fd concentration was 50 lM in 10 mM phosphate buffer, pH 6.5. The labeled residues were used for NMR-restrained docking. (B) Chemical shift variations observed in15N HSQC of Synechocystis Fd in the presence of Synechocystis FNR/NADP+complex at a stoichiometry of
1 Fd:0.5 FNR/NADP+. (C) Titration curve of the Synechocystis Fd/ FNR complex formation. Y96,15N resonance was followed during the
titration: in the absence of NADP+ (white diamonds), and in the presence of NADP+ (black boxes). The curves represent best fits of
to generate and rank 5000 hypothetical docked structures,
based on geometric surface complementarity and empirically
based inter-residue affinity terms
[5,14]
. After a filtering step
using NMR derived distance constraints, none of 5000
hypothetical docked structures fulfilled these 12 constraints.
Indeed, D84 of Fd, whose
15N resonance shifts about
0.2 ppm during complex formation, is located at the surface
of Fd but, in contrast with all other selected residues, seats
at the opposite side of the protein, relative to the FeS
clus-ter. Therefore, it is not physically possible to have all
marked residues simultaneously within 8 A
˚ from the FNR
partner and the target complex should be sought amongst
the ones that minimize the number of NMR constraint
violations. Seven hypothetical docked complexes fulfill 11
NMR constraints imposed and
Fig. 3
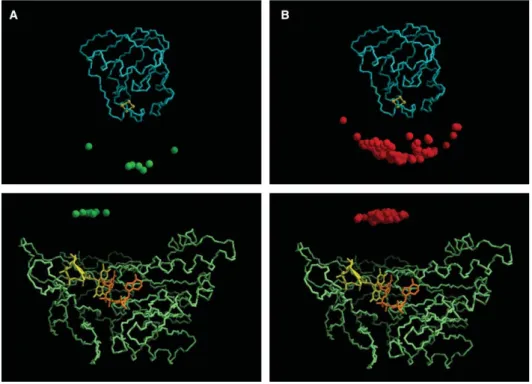
A represents their
geo-metrical distribution. All seven complexes possess
approxi-mately the same interacting surface patches, with FAD
and FeS cofactors separated by no more than 7.8 A
˚
(be-tween the C8M atom of isoalloxazine and the closest Iron
atom). These models differ by varying degrees of rotation
and translation along the inter-molecular axis.
To discriminate between those putative solutions, the initial
5000 docked structures were also evaluated for the theoretical
electronic coupling constants, calculated between the
corre-sponding redox cofactors (Section 2). The 50 top-scoring
com-plexes
which
present
the
shortest
electron
tunneling
pathlengths, were selected (
Fig. 3
B). As can be observed in
Fig. 3
, the NMR- and the electron tunneling-filtered docked
solutions roughly share the same interacting regions. Three
models are thus selected when applying simultaneously the
two filters (
Fig. 4
A). Two of the three structures are very
sim-ilar to each other (RMS deviation between a-carbons is
0.96 A
˚ ) and represent virtually the same solution.
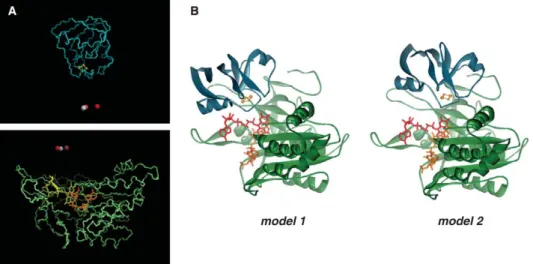
From the results above, we were able to propose two
alter-native working models of the Synechocystis Fd/FNR/NADP
+complex (
Fig. 4
B, models 1 and 2), which equally fulfill both
experimental and theoretical constraints. The interaction
scores computed with BiGGER algorithm are also very similar
for the two structures. However, our current experimental or
theoretical knowledge of this complex does not allow us to
conclude which of them is more likely to represent the native
complex.
3.3. Analysis of the structural models of Synechocystis
Fd/FNR/NADP complex
The two models of the complex differ from each other by
3.7 A
˚ RMSD (a-carbons), resulting from a slight rotation of
the Fd molecule and a translation of around 6.5 A
˚ along the
surface of FNR. They share 19 common residues at the
sur-face of Fd and only 11 on FNR, but interestingly, the
molecular interfaces of the two model complexes show very
similar percentages of non-polar atoms (about 60% in Fd
and FNR). Model 1 is stabilized by three intermolecular
salt-bridges (residues D11, D60 and E92 from Fd with
K75, K264 and K77 from FNR, respectively) and three
potential hydrogen bonds, involving S38, R40 and T46 from
Fd, besides several hydrophobic contacts. Interactions in
model 2 are less numerous with salt bridges and hydrogen
bonds only between E29, G32 and E92 from Fd and K80,
K77 and R21, respectively, from FNR. The interface areas
Fig. 3. Docking of the Fd/FNR/NADP+complex from Synechocystis. The top panels show the hypothetical docked positions of FNR (represented each by a small sphere located at its geometric center), relative to the structure of Fd (shown as blue backbone trace). The bottom panels represent the complementary view, i.e., the backbone of FNR is explicitly displayed in green and the position of the geometric center of each docked Fd molecule is represented with a sphere. FAD and NADP molecules are also shown in yellow and orange, respectively. Panel A: Filtered solutions (green) based on 12 distance constraints from NMR titrations (7 alternative poses). Panel B: Top 50 solutions (red) with minimal electron-transfer pathlengths between FeS and the isoalloxazine ring of FAD.
of models 1 and 2 are 1530 and 2030 A
˚
2, respectively, which
are within the most common range of 1600 ± 400 A
˚
2for
protein–protein complexes
[17]
. These values also compare
well with the observed interface area (1600 A
˚
2) of the
crys-tallographic 1:1 FNR/Fd complex from Z. Maize (pdb
1GAQ), even though the two models differ from that
structure by as much as 8.0 and 8.6 A
˚ RMSD, respectively.
The interfaces of the two models are fairly compact,
possess-ing a slightly smaller gap volume than that observed for the
Z. Maize complex (7100 A
˚
3versus 7800 A
˚
3). The
crystallo-graphic structure of the Anabaena complex shows, on the
other hand, different characteristics. For comparison, the
RMSD (a-carbon) between Anabaena complex and Z. Maize
complex or Synechocystis models 1 and 2 are 7.5, 4.0 and
4.7 A
˚ , respectively. The apparent heterogeneity of binding
modes between Fd and FNR from different species may
be a consequence of the low affinity of these transient
com-plexes, mostly optimized for an efficient electron-transfer
turnover. These data are in agreement with the NMR
mapping of the Maize Fd interacting site
[2]
which is
signif-icantly different of that we found for Synechocystis system
(
Fig. 1
).
A detailed analysis of the electron-transfer site shows that
in both Synechocystis models, the two cofactors and NADP
+substrate are in close proximity: the FeS–FAD distance is
approximately 6.0 A
˚ , and the FAD–NADP
+distance is
2.3 A
˚ . As represented in
Fig. 5
, these models suggest that
Fd C39 has an essential role in electron transfer. C39 is
one of the ligands of the FeS center and is positioned at
the complex interface, inaccessible to water molecules and
at 3.8 or 3.4 A
˚ distance from the FAD (in models 1 or 2,
respectively). The cysteine side chain therefore provides a
potential bridge for the electron transfer, between the redox
centers of the two proteins. In a similar way, it was
pro-posed that C44 of Maize Fd is involved in a direct electron
transfer through space between the prosthetic groups
[2]
.
The involvement of C39 in Synechocystis complex or C44
in the Maize complex is certainly due to the different
orien-tations of the two molecules in the complexes. In the current
models of Synechocystis complex, like it was described in the
crystallographic structure of Maize complex
[2]
, the aromatic
residue F63 of Fd, as well as Y37 are found at the interface,
bordering the solvent excluded interface patch. However,
their distances to the FeS cluster or the FAD group are
higher than the FeS–FAD linear distance. It is therefore
difficult to rationalize that these aromatic residues would
provide a more efficient electron-transfer pathway than the
direct through-bond pathway provided by C39. Indeed,
Fig. 4. Two hypothetical models of the Fd/FNR/NADP complex from Synechocystis. Panel A: Combined (intersection) set of docked solutions that fulfill all criteria simultaneously, color-coded according the BiGGER scoring function (red: higher, white: lower). Panel B: ‘‘Best models’’ of the complex FNR/Fd from Synechocystis.
Fig. 5. Detailed view of the electron-transfer site in the two hypothetical models of NADP+/FNR/Fd complex from Synechocystis. FdÕs residues are
NADP
+is relatively buried inside FNR and the structural
models suggest the absence of direct interactions between
Fd and NADP
+.
Acknowledgments: The authors thank Michel Frey for helpful discus-sion on Anabaena FNR/Fd system. This work was supported by Fun-dac¸a˜o para a Cieˆncia e Tecnologia, the French Embassy and ICCTI (no. 316C2) and the PICS program from CNRS and ICCTI (no. 1392). The starting pET vector for over-expression of the truncated petH gene was a kind gift of Dr. J. van Thor.
References
[1] Morales, R., Kachalova, G., Vellieux, F., Charon, M.H. and Frey, M. (2000) Crystallographic studies of the interaction between the ferredoxin-NADP+ reductase and ferredoxin from the cyanobacterium Anabaena: looking for the elusive ferredoxin molecule. Acta Crystallogr. D: Biol. Crystallogr. 56, 1408–1412. [2] Kurisu, G., Kusunoki, M., Katoh, E., Yamazaki, T., Teshima,
K., Onda, Y., Kimata-Ariga, Y. and Hase, T. (2001) Structure of the electron transfer complex between ferredoxin and ferredoxin-NADP(+) reductase. Nat. Struct. Biol. 8, 117–121.
[3] Morelli, X., Czjzek, M., Hatchikian, C., Bornet, O., Fontecilla, J., Palma, P.N., Moura, J.J.G. and Guerlesquin, F. (2000) Structural model of the Fe-hydrogenase/cytochrome c553complex combining
transverse relaxation-optimized spectroscopy experiments and soft docking calculations. J. Biol. Chem. 275, 23204–23210. [4] Morelli, X., Dolla, A., Czjzek, M., Palma, P.N., Blasco, F.,
Krippahl, L., Moura, J.J.G. and Guerlesquin, F. (2000) Heter-onuclear NMR and soft docking: an experimental approach for a structural model of the cytochrome c553–ferredoxin complex.
Biochemistry 39, 2530–2537.
[5] Krippahl, L., Moura, J.J.G. and Palma, P.N. (2003) Modeling protein complexes with BiGGER. Proteins Struct. Funct. Genet. 52, 19–23.
[6] Carrillo, N. and Ceccarelli, E.A. (2003) Open questions in ferredoxin-NADP+reductase catalytic mechanism. Eur. J. Bio-chem. 270, 1900–1915.
[7] Shin, M. and Arnon, D.I. (1965) Enzymic mechanisms of pyridine nucleotide reduction of chloroplasts. J. Biol. Chem. 240, 1405– 1411.
[8] Knaff, D.B. and Hirasawa, M. (1991) Ferredoxin-dependent chloroplast enzymes. Biochim. Biophys. Acta 1056, 93–125. [9] Lagoutte, B., Hanley, J. and Bottin, H. (2001) Multiple functions
for the C terminus of the PsaD subunit in the cyanobacterial photosystem I complex. Plant Physiol. 126, 307–316.
[10] Bottin, H. and Lagoutte, B. (1992) Ferredoxin and flavodoxin from the cyanobacterium Synechocystis sp. PCC 6803. Biochim. Biophys. Acta. 1101, 48–56.
[11] van Thor, J.J., Geerlings, T.H., Matthijs, H.C.P. and Hellingwerf, K.J. (1999) Kinetic evidence for the PsaE-dependent transient ternary complex photosystem I/ferredoxin/ferredoxin:NADP(+) reductase in a cyanobacterium. Biochemistry 38, 12735–12746. [12] Lelong, C., Setif, P., Bottin, H., Andre, F. and Neumann, J.M.
(1995) 1H and 15N NMR sequential assignment, secondary structure, and tertiary fold of [2Fe–2S] ferredoxin from Synecho-cystis sp. PCC 6803. Biochemistry 3, 14462–14473.
[13] Guex, N. and Peitsch, M.C. (1997) An environment for compar-ative protein modeling. Electrophoresis 18, 2714–2723.
[14] Palma, P.N., Krippahl, L., Wampler, J.E. and Moura, J.J.G. (2000) A new (soft) docking algorithm for predicting protein interactions. Proteins Struct. Funct. Genet. 39, 372–384. [15] Marcus, R.A. and Sutin, N. (1985) Electron transfers in chemistry
and biology. Biochim. Biophys. Acta 811, 265–322.
[16] Akashi, T., Matsumura, T., Ideguchi, T., Iwakiri, K., Kawakatsu, T., Taniguchi, I. and Hase, T. (1999) Comparison of the electrostatic binding sites on the surface of ferredoxin for two ferredoxin-dependent enzymes, ferredoxin-NADP(+) reductase and sulfite reductase. J. Biol. Chem. 274, 29399–29405. [17] Lo Conte, L., Chothia, C. and Janin, J. (1999) The atomic
structure of protein–protein recognition sites. J. Mol. Biol. 285, 2177–2198.