Editor
Carla Nunes
Environmentally Friendly and
Safe Technologies for Quality of
Fruits and Vegetables
U N IV ER SIDADE DOALG AR VE 2010
Editor
Carla Nunes, FCT, Universidade do Algarve, Faro, Portugal
Editorial Board
Brion Duffy, Agroscope FAW Wadenswil Bacteriology, Switzerland Carla Nunes, FCT, Universidade do Algarve, Portugal
Christian Larrigaudiere, IRTA-Institut de Recerca i Tecnologia Agroalimentàries, Spain Josef Streif, Inst. Sonderkulturen & Produktsphysiologie, Hohenheim, Germany Maribela Pestana, FCT, Universidade do Algarve, Portugal
Maria Graça Barreiro, Instituto Nacional de Investigação Agrária, Portugal Maria Dulce Antunes, FCT, Universidade do Algarve, Portugal
Miguel Salazar, CICAE, Instituto Universitário Dom Afonso III, Portugal Mustafa Erkan, Akdeniz University, Turkey
Paolo Bertolini, Universita de Bologna, Italy Pol Tijskens, Wageningen University, Netherlands Shimshon Ben-Yehoshua, A.R.O. Volcani Centre, Israel Susan Lurie, A.R.O. Volcani Centre, Israel
The papers contained in this book report some of the peer reviewed Proceedings of the International Conference “Environmentally friendly and safe technologies for quality of fruit and vegetables”, but also other papers related with the subject were included. The manuscripts were reviewed by the Editor and Editorial Board, and only those papers judged suitable for publication were accepted. The Editor wish to thank to all the reviewers and authors for their contribution.
Proceedings of the International Conference “Environmentally friendly and safe
technologies for quality of fruit and vegetables”,
held in Universidade do Algarve, Faro, Portugal, on January 14-16, 2009. This Conference was a join activity with COST Action 924.Convener
Carla Nunes, Universidade do Algarve, Portugal
Scientific Committee
Carla Nunes, Universidade do Algarve, Portugal Amílcar Duarte, Universidade do Algarve, Portugal
Angelos Kanellis, Aristotle University of Thessaloniki, Greece Bart Nicolaï, Katholieke Universiteit Leuven, Belgium
Brion Duffy, Agroscope FAW Wadenswil Bacteriology, Switzerland
Christian Larrigaudiere, IRTA-Institut de Recerca i Tecnologia Agroalimentàries, Spain Domingos de Almeida, Universidade do Porto, Portugal
Josef Streif, Inst. Sonderkulturen & Produktsphysiologie Hohenheim, Germany Krzysztof Rutkowski, Research Inst. of Pomology and Floriculture, Poland Maria Dulce Antunes, Universidade do Algarve, Portugal
Maria da Graça Barreiro, Instituto Nacional de Investigações Agrárias, Portugal Mustafa Erkan, Akdeniz University, Turkey
Paolo Bertolini, Universita de Bologna, Italy Pol Tijskens, Wageningen University, Netherland Shimshon Ben-Yehoshua, A.R.O. Volcani Centre, Israel
Organizing Committee
Carla Nunes, Universidade do Algarve, Portugal Amílcar Duarte, Universidade do Algarve, Portugal Bart Nicolaï, Katholieke Universiteit Leuven, Belgium Maria Dulce Antunes, Universidade do Algarve, Portugal Maria Emília Costa, Universidade do Algarve, Portugal Maribela Pestana, Universidade do Algarve, Portugal
Miguel Salazar, Instituto Universitário Dom Afonso III, Portugal
Sponsors
COST, European Cooperation in the field of Scientific and Technical Research
Fundação para a Ciência e a Tecnologia
International Association of Students in Agriculture and Related Sciences, Faro
Serviço Técnico Pós-colheita do IRTA em Portugal Algarve.resorts.net
Câmara Municipal de Faro Câmara Municipal de Albufeira
Câmara Municipal de Aljezur Câmara Municipal de Lagos
Câmara Municipal de S. Brás de Alportel Crédito Agrícola, Caixa do Algarve A Farrobinha 80 g C.N. Kopke & Cª PrimeDrinks, S.A. Uniprofrutal Frutas Mourinho
TABLE OF CONTENTS
SECtIOn 1. nOn-dEStruCtIvE mEthOdS fOr mEaSurIng qualIty Of fruItS and vEgEtaBlES
10 01. X-ray computed (micro) tomography for detecting internal defects in fruit
20 02. Non-destructive detection of internal defects in apple fruit by Time-resolved Reflectance Spectroscopy
27 03. On the application of spatially resolved reflectance and diffuse light backscattering goniometry to the prediction of firmness in apple ‘Bravo de Esmolfe’
33 04. How to analyse non-destructive data for biological variation 41 05. NIRS detection of moldy core in
apples
45 06. Chlorophyll fluorescence image analysis for non-destructive monitoring of physiological changes in fresh and fresh-cut produce 52 07. Shelf-life of ripening ‘Rocha’
pear: effects of the orchard irrigation regime on quality and fluorescence parameters
SECtIOn 3. qualIty managEmEnt Of fruIt and vEgEtaBlES
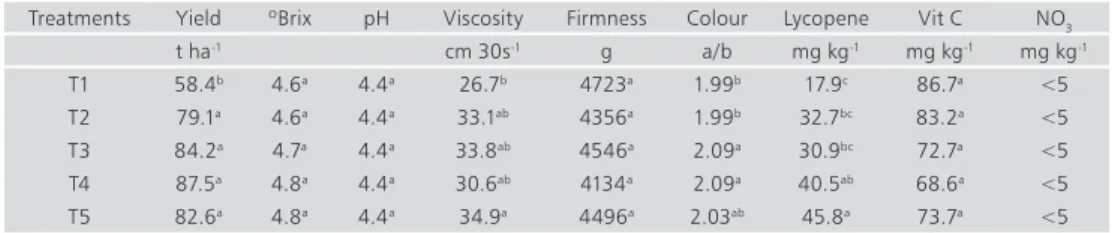
96 15. Quality of two tomato cultivars grown under different agronomical conditions
102 16. Desert plants with medicinal value
108 17. Investigation on the essential mineral element contents of cultivated and wild blueberry fruits in Latvia
113 18. Tomato fruit quality as affected by ripening on- and off-vine
117 19. Quality changes during storage of apricot (Prunus armeniaca L.) cv. ‘Beliana’ and ‘Lindo’ treated with calcium
121 20. Watercore dissipation in ‘Fuji’ apples at different holding temperatures
124 21. Effect of postharvest elicitors on ‘Fuyu’ persimmon quality during cold storage
SECtIOn 2. PrE-harvESt faCtOrS affECtIng POStharvESt qualIty and SafEty
58 08. Advances in practical management of pear ripening capacity and postharvest decay 64 09. Preharvest factors affecting fruit
quality and safety
68 10. Ammonium fertilisers with nitrification inhibitors improve the nutritional quality of horticultural crops for industrial processing 73 11. Variation in apple colour and
maturity. Causes and similarities over orchards, management, cultivars and storage
80 12. Foliar fertilization with
potassium, magnesium and calcium and postharvest fruit quality in plums (Prunus domestica L) 85 13. Effects of nitrogen fertilization
on fruit quality during storage of spanish ‘Piel de Sapo’ melon 90 14. Consequences of iron deficiency
on fruit quality in citrus and strawberry
SECtIOn 4. EnvIrOnmEntally frIEndly and SafE mEthOdS tO COntrOl POStharvESt lOSSES
131 22. New developments in alternative methods to control postharvest fruit decay
144 23. Study of modes of action of the biocontrol agent Metschnikowia
andauensis PBC-2
151 24. Is it possible to improve biocontrol agents to practical applications? The Pantoea
agglomerans CPA-2 example
160 25. Inhibition of postharvest
Penicillium molds of oranges
by antifungal hydroxypropyl methylcellulose-lipid edible composite films and coatings
166 26. Antifungal activity of citrus essential oil components in vitro and
in vivo against Penicillium digitatum
Pers. (Sacc.)
173 27. Sugar variation in healthy, blue mold infected and Aureobasidium
pullulans treated ‘Rocha’ pear
178 28. Effect of coating application on the gas flow and P. digitatum growth in lemon cv. ‘Verna’
183 29. Heat treatment evaluation on quality and safety of whole tomato (Lycopersicum esculentum L.) fruits
SECtIOn 5. nEw aPPrOaChES tO EnhanCE SafEty and qualIty Of mInImally PrOCESSEd fruItS and vEgEtaBlES
190 30. Technological innovations to preserve quality and safety of fresh-cut horticultural products
199 31. Volatile and quality changes in fresh-cut cantaloupe and
honeydew melons stored in modified atmosphere packaging
205 32. Physiological bases for texture and color changes in fresh-cut ‘Rocha’ pear: implications for the development of products and processes
210 33. Photosensitization as novel approach to decontaminate strawberry fruit surfaces
214 34. Effect of electrolyzed water as a disinfectant for fresh-cut fruit 220 35. Novel approach to
decontaminate fruits and vegetables: combined treatment of pulsed light and photosensitization
223 36. Cracked green table olive from the south of Portugal: the influence of diferent brining conditions 230 37. Decontamination of packaging
SECTION 1. NON-DESTRuCTIVE mETHODS FOR
mEASuRINg QuALITy OF FRuITS AND VEgETABLES
En v ir o n m En ta ll y F ri En d ly a n d S a FE tE ch n o lo g iES F o r Q u a li ty o F F ru it S a n d vE g Eta bl ES
01. X-RAy COmPuTED (mICRO)TOmOgRAPHy FOR
DETECTINg INTERNAL DEFECTS IN FRuIT
Pieter Verboven1*, Quang Tri Ho1, Els Herremans2, Bert Verlinden2, Jeroen Lammertyn1, Bart Nicolaï1,2
1Division BIOSYST-MeBioS, K.U.Leuven, W. de Croylaan 42, box 2428, BE-3001 Leuven, Belgium 2Flanders Centre of Postharvest Technology, VCBT vzw., W. de Croylaan 42, BE-3001 Leuven, Belgium
*E-mail: [email protected]
abstract
Internal disorders in horticultural products are not revealed by external visual symptoms. Non-destructive and non-invasive monitoring techniques are required to detect the occurrence and investigate development of internal disorders. X-ray CT allows visualization and analysis of plant materials with a resolution down to a few micrometers, and without sample preparation or chemical fixation. X-ray tomography is based on X-ray radiography: an X-ray beam is sent on a sample and the transmitted beam is recorded on a detector. The level of transmission of these rays depends mainly on the mass density and mass absorption coefficient of the material. The resulting image is superimposed information (a projection) of a volume in a 2D plane. The classical way to retrieve 3D information is to perform a large number of radiographs while rotating the sample between 0° and 180°. The filtered back-projection algorithm can then be used to reconstruct the volume of the sample from these radiographs. Compared to two-dimensional radiography used in medicine and linescan radiography applied on grading machines, X-ray computer tomography (CT) is the most powerful technique from the horticultural research point of view, since two and three dimensional images can be reconstructed from the accumulated data to study internal physical and physiological processes. Most internal disorders like woolliness in nectarines, hollow heart in potato, core breakdown in pears, watercore in apples and spongy tissue in mango affect the density and water content of the internal tissue and, hence, are detectable by means of X-ray measurements. For in vivo observations, high resolution sub-micron tomography has up to recently only been achieved on relatively dry -or hard- biological samples, such as plant seeds. We have shown, however, that by means of synchrotron radiation X-ray sources, it has now become feasible to image plant tissues at a resolution of less than one micrometer.
Internal disorders and fruit microstructure
Fruit and vegetables cover 16.6% of the EU production of agricultural food1. Fruit are, after milk and
leading over cereals, the most important food item consumed in the EU (over 400 g capita-1 day-1). Yearly
the production amounts to 38.3 million tons of fruit and 66 million tons of vegetables. Fresh apple and pear fruit are produced in many countries of the EU, with main production in France, Spain, Italy, Germany, Poland, Austria, Belgium and The Netherlands. Exports (3 billion EUR in 2005) are growing for both fruit and vegetables, but imports are more than four times higher and are competing strongly on the home market.
Fruit are an important category of biological food products with high water content and a cellular microstructure. Their visual, textural and nutritional quality has direct economical impact for fresh consumption as well as processing. A fruit consists of different tissue types such as the epidermis (with cuticle), cortex parenchyma tissue, core tissue and vascular tissue; each with different microstructural composition. From the macro- to the nanoscale, physical properties of fruit are affected by the type of tissue, the geometric properties of the cell, the presence of an adhesive middle lamella between individual cells, the cellular water potential, the mechanical properties of the cell wall, the presence of intercellular spaces
Se c ti o n 1 . n on -d eS tr u c ti v e m et h o d S f o r m ea Su ri n g q u a li ty o f f ru it S a n d v eg et a bl eS
and sub-cellular features such as the plasma-membrane, plasmodesmata and aquaporins. Degradation of the fruit microstructure after harvest quickly leads to interior quality defects. The amount of loss due to internal disorders that develop during storage varies from year to year, but for some cultivars this is always significant. Peak losses have been recorded as high as 20 to 30% of the fruit in some years and locations. Several disorders may occur that reduce the commercial value of the fruit:
Pome fruit are often stored for up to 10 months at a low temperature (typically around 0 °C) in combination with a reduced O2 and increased CO2 partial pressure (so-called “Controlled Atmosphere (CA) storage”) to reduce their respiration rate, and, hence, extend their storage life. However, the optimal gas composition is critical, as too low an O2 partial pressure in combination with too high a CO2 partial pressure may lead to physiological disorders and off-flavours. In fact, under suboptimal conditions some fruit may develop browning and core breakdown. This storage disorder is characterised by the development of brown internal tissue which will further develop into cavities so that the fruit can no longer be commercialised. This disorder has been monitored nondestructively by means of MRI and X-ray CT (Lammertyn et al. 2003). How it relates to microstructure is unknown.
The incidence of senescent breakdown in apple, with symptoms similar to browning varies from year to year, apparently being affected by preharvest growing conditions. This disorder is related to the age of the fruit, and occurs more often in large, over-mature apples. Late harvest, delay in cooling and storage at temperatures above those recommended favor the occurrence. Incidence of scenescent breakdown usually indicates that storage life has passed.
Water core is a disease that appears as hard glassy regions near the core in apples. Apples that have been exposed to high temperatures and sunlight near maturity are more susceptible to develop water core. Water core does not develop in storage and may even disappear when originally present in a mild form.
Bitter pit symptoms are mainly found in the cortex apple tissue near the skin and appear first as soft, brown areas, which eventually become desiccated due to the collapse of surrounding cells, forming a dry cavity or ‘pit’. The disorder is due to preharvest factors including fruit mineral status and climate. The microstructure of fresh pome fruit (apple and pear) has recently been investigated by means of light microscopy (Schotsmans et al. 2004), scanning electron microscopy and confocal microscopy (Veraverbeke
et al. 2001) and -very recently- by X-ray computed microtomography (Mebatsion et al. 2006; Mendoza et al. 2007; Verboven et al. 2008).
Internal disorders in fruit can cause extreme losses during the storage season. Since fruits normally have to be cut to detect internal disorders, they are often only observed upon quality inspection of the whole batch after shipping. This typically leads to refusal and subsequent destruction of the whole batch which may cause large financial losses. Using new microstructure sensors and improved understanding of the effect of microstructure on the disorder, their occurrence may be detected earlier or even in advance, resulting in more high quality fruit.
X-ray Imaging
Principles of X-rays
WC Roentgen discovered a new kind of radiation in 1895. The nature of the radiation was at first unknown, therefore they were called X-rays. X-rays are a form of electromagnetic radiation in the range of wavelengths between 10 and 0.01 nanometers, corresponding to a frequency of 30 PHz to 30 EHz and energies in the range 120 eV to 120 keV. Therefore, X-ray photons are highly energetic and have enough energy to break up molecules and hence damage living cells.
When X-rays hit a material, some are absorbed and others pass through. The higher the energy the more X-rays will pass through (Table 1). This property of X-rays enables us to “see inside” things.
En v ir o n m En ta ll y F ri En d ly a n d S a FE tE ch n o lo g iES F o r Q u a li ty o F F ru it S a n d vE g Eta bl ES
table 1. X-ray transmission through material. Energy carried by
each photon (1pm = 10-12 m)Wavelength Thickness of material to halve number of photons Concrete Lead Human Tissue Aluminium 1keV 1240 pm 0.87 μm 0.117 μm 1.76 μm 2.17 μm 100keV 12.4 pm 17.3 mm 0.110 mm 38.6 mm 15.1 mm 10MeV 0.124 pm 132 mm 12.3 mm 298 mm 111 mm Source: http://www.arpansa.gov.au/radiationprotection/basics/xrays.cfm
X-rays are commonly produced by accelerating electrons through a potential difference and directing them onto a target material (for example the metal tungsten). The electrons that hit the target release X-rays as they slow down (braking radiation or bremsstrahlung). The X-ray photons produced in this manner range in energy from near zero up to the energy of the electrons. When incoming electrons cause electron transfer in the atomic shell of target atoms, X-ray photons of a specific energy (a characteristic X-ray) are produced (Fig 1).
fig 1. Plot of the number of photons against the photon energy for a tungsten target in a X-ray tube (Source: http://www.arpansa.gov.au/ radiationprotection/basics/xrays.cfm).
After passing the material, the X-rays enter crystal scintillators and are converted to flashes of light. The flashes of light are detected and processed electronically. A “single slice” CT has a row of these detectors positioned opposite the X-ray tube and arranged to intercept the fan of X-rays produced by the tube. A “multi-slice” scanner has several rows of these small scintillator detectors.
X-ray radiography
When a single image of the transmitting X-rays is taken of the material, the method is called radiography. An X-ray beam is sent on a sample and the transmitted beam is recorded on a detector (mainly film or CCD based detector for radiography). According to the Beer–Lambert law, the ratio of the number of transmitted to incident photons is related to the integral of the absorption coefficient μ of the material along the path that the photons follow through the sample. The absorption coefficient μ is linked to the density, the atomic number and the energy (when the beam is monochromatic) by using an empirical law. The resulting image is thus a superimposed information or projection of the material volume in a 2D plane (Salvo et al. 2003). Different types of X-ray radiography scanners are given in Fig 2.
Se c ti o n 1 . n on -d eS tr u c ti v e m et h o d S f o r m ea Su ri n g q u a li ty o f f ru it S a n d v eg et a bl eS (a) (b)
fig 2. Types of X-ray scanners that use a radiography method. (a) a X_ray sorter distinguishes foreign material from the product by a difference in density, in addition to differences in size and shape (Source: BEST NV, Heverlee, Belgium). (b) Airport carry-on baggage scanner identifies distinct items and attributes them to ‘Organic’, ‘Inorganic’ and ‘Metal’ categories (Photo courtesy of PerkinElmer Detection Systems).
X-ray Computed tomography
X-ray CT is a relative new technique developed in the late 1970’s, which enables the non-destructive visualisation of the internal structure of objects. These first, mainly medical, CT scanners had a pixel resolution in the order of 1mm. In the 80’s, after some technological advances towards micro-focus X-ray sources and high-tech detection systems, it was possible to develop a micro-CT (or µCT) system with nowadays a pixel resolution 1000 times better than the medical CT scanners. By using projection images obtained from different angles a reconstruction can be made of a virtual slice through the object. When different consecutive slices are reconstructed a 3D visualisation can be obtained (Fig 3).
fig 3. Example of X-ray CT of an apple cylinder in a plastic tube. The cylinder is rotated and projection images are taken. A back propagation algorithm is used to reconstruct the 3D image of the internal structure of the apple sample.
Next to the µCT technology new in-situ stages (rotatable support platforms for the samples) are developed which increase the possibilities of the tomographic systems. An example of such an in-situ stage is the environmental stage (or cooling stage) which is an interesting tool in the study of fresh food products.
µCT as a non-invasive technique has been applied to the study of the internal 3D structures of several food products, e.g, marshmallow, aerated chocolate, chocolate muffin (Lim & Barigou 2004). Kuroki et al. (2004) obtained 3D spatial information about gas-filled intercellular spaces in cucumber fruit. Babin et al. (2005) studied the microstructure of cellular cereal products captured by synchrotron radiation µCT. Leonard
En v ir o n m En ta ll y F ri En d ly a n d S a FE tE ch n o lo g iES F o r Q u a li ty o F F ru it S a n d vE g Eta bl ES
success to more difficult products such as apple and pear, with resolutions below 1 micron (Mendoza et al. 2007; Verboven et al. 2008).
A new challenge in technology is the nano-CT system opening up a new era in X-ray imaging with a spatial resolution in the range of hundreds of nanometers. Proceeding to submicron pixel sizes requires increased performance of the X-ray source, rotation stage and X-ray detector. The fact that the object can be scanned under normal environmental conditions without any coating, vacuum treatment or other preparation techniques makes it an interesting tool as such as well as a reference to interpret the micorstructure measurements with other methods.
Examples of X-ray CT scanners are given in Fig 4.
(a) (b)
fig 4. X-ray CT scanners. (a) High resolution X-ray CT ( to 1 micron image pixel size) (Skyscan 1172, Skyscan, Belgium), (b) Full body medical CT scanner (Siemens, http://www.medical.siemens.com/).
Synchrotron X-ray Ct
Visualization by X-ray microtomography of plant tissues in their natural state has been difficult, because of the low contrast and limited resolution (Westneat et al. 2003; Kuroki et al. 2004; Kim et al. 2006; Rau et al. 2006; Mendoza et al. 2007). Important structural features such as small voids between cells, vascular capillaries or cell walls could therefore not be visualized, rendering incorrect connectivity information (Fig 5A,B).
fig 5. (A) Microfocus X-ray CT of pear at 9.5 μm pixel size, image size 256*256 pixels. (B) High resolution X-ray CT of pear at 4.8 μm pixel size, image size 256*256 pixels. (C) Synchrotron X-ray CT (phase contrast) of pear at 0.7 μm pixel size, image size 256*256 pixels. Dark areas indicate air-filled pores, lighter colored zones are cells.
High resolution tomography using synchrotron radiation offers a means to explore at sub-micrometer resolution 3-D fruit tissues with high water content in their natural state. As explained by Salvo et al. (2003), synchrotron radiation X-ray tomography has important advantages over X-ray tube tomography of conventional X-ray CT equipment. X-ray tube tomography produces a divergent beam; therefore the resolution is limited by the beam angle and the required field of view. The beam angle may also produce artefacts in the reconstructed images. The parallel beam produced by synchrotron radiation with good spatial coherence makes a quantitative reconstruction, free of geometrical and beam hardening artefacts, possible.
Se c ti o n 1 . n on -d eS tr u c ti v e m et h o d S f o r m ea Su ri n g q u a li ty o f f ru it S a n d v eg et a bl eS
These conditions can only be achieved at large scale facilities that produce high energy flux sources and long distances between source and tomography set-up (in the order of 100 m). The facility at ESRF (Grenoble, France) was accessible to the authors on the basis of a successful research proposal (Fig 6).
(a) (b)
fig 6. Synchrotron X-ray facility at ESRF, Grenoble. (a) Aerial view of the facility, (b) Schematic picture of the facility: electrons are fired into a linac, or straight accelerator. They’re boosted in a small ring before entering the storage ring 850 m in circumference. The superfast particles are corralled by a train of magnets. Energy lost by turning electrons emerges as very intense X-rays (http://news.bbc.co.uk/2/hi/science/nature/7501420.stm).
Phase contrast imaging with synchrotron X-rays has been developed for edge enhancement on tomographs with low absorption mode contrast (Davis et al. 1995; Cloetens et al. 1999). High resolution phase tomography of biological tissues at a pixel size close to 1 micrometer has only recently been achieved (Plouraboue et al. 2004; Thurner et al. 2005), but required sample preparation to improve contrast on the images. For in vivo observations, high resolution phase tomography has so far been applied to relatively dry- or hard- biological samples, such as plant seeds (Stuppy et al. 2003; Cloetens et al. 2006), as well as wet, soft samples that are more prone to damage by the X-rays (Cloetens et al. 2006; Verboven et al. 2008). Figure 5C demonstrates the power of the technique for imaging cells, cell walls and pores in pear fruit tissues.
applications of X-ray Imaging for Internal fruit quality assessment
X-ray Sorting Based on X-ray radiography
Jiang et al. (2008) presented an application of X-ray scanners quarantine inspection of fruits, to prevent propagation of foreign insect pests in imported fruits. The X-ray imaging system consisted of a microfocus X-ray source and a line-scan sensor camera, both of which are controlled by a desktop computer. The properties of the system are a divergent beam and polychromatic radiation, therefore quantitative information on the absorption coefficients (and therefore density) of the material is difficult to retrieve. The line detector was 512 mm wide and allowed for a pixel resolution of 1280 pixels. The energy levels that were used were 40–90 kV voltage. Online fruit inspection images of 80×960 pixels were possible at a conveyer belt speed of 1.2 m min-1, including on-line image processing. To accurately determine whether a
fruit has signs of insect infestation, the authors have developed an adaptive image segmentation algorithm based on the local pixels intensities and unsupervised thresholding algorithm. Experimental results revealed that the effect of sub-image size and interpolation grid size has little effect on the computational time when the interpolation grid size is greater than 8×8 pixels. The adaptive thresholding algorithm was stable judging from the insignificant difference of threshold value maps created using various sub-image size
En v ir o n m En ta ll y F ri En d ly a n d S a FE tE ch n o lo g iES F o r Q u a li ty o F F ru it S a n d vE g Eta bl ES
and interpolation grid size. The algorithm resolved the frequent problem of segmenting object from X-ray image using global thresholding approach. However, false identification remained an issue (Fig 7).
fig 7. (a) X-ray image of a guava with pest infection, (b) segmented spots after adaptive thresholding of (a), (c) morphological filtering of (b) with three iterations, (d) X-ray image of a peach with pest infection, (e) segmented spots after adaptive thresholding of (d), and (f) morphological filtering of (e) with three iterations (Source: Jiang et al. 2008).
Ct Imaging of Internal disorders in fruit
Most internal disorders like woolliness in nectarines, hollow heart in potato, watercore in apples and spongy tissue in mango affect the density and water content of the internal tissue and, hence, are detectable by means of X-ray measurements (Brecht et al. 1991; Tollner et al. 1991; Thomas et al. 1993; Sonego et al. 1995; Schatski et al. 1997; Barcelon et al. 1999). Lammertyn et al. (2003a,b) used X-ray CT to study the development of core breakdown disorder in ‘Conference’ pears (Pyrus communis). With image processing of X-ray tomography slices of pears, we were able to measure non-destructively the breakdown development (in terms of area percentage of affected and unaffected tissue as well as the cavity and core area per slice) during storage measured on actual slices with an underestimation of 12% (Fig 8). MRI was proposed as a better method to follow core breakdown during postharvest storage (Lammertyn et al. 2003b). The advantage of X-ray CT is, however, its better resolution over MRI.
fig 8. Comparative overview of the corresponding X-ray CT scans, MRI images and actual photographs of core breakdown of pear tissue (Lammertyn et al. 2003b; used with permission from Elsevier Science Ltd.).
Se c ti o n 1 . n on -d eS tr u c ti v e m et h o d S f o r m ea Su ri n g q u a li ty o f f ru it S a n d v eg et a bl eS
3-d Imaging of fruit microstructure
Cylindrical samples of 5 mm diameter and 1 to 2 cm length were removed from the different tissues of apple ‘Jonagold’ and pear ‘Conference’ using a cork bore in the radial direction on the equator of the fruit. The samples were mounted in a Polymethyl methacrylatetube and covered with polymer foil to avoid dehydration. The experiments were conducted at beamline ID19 of the European Synchrotron Radiation Facility (ESRF, Grenoble, France). The system provided a field of view of 1.43x1.43 mm2 and, at best, an
image pixel size of 0.7 μm. 3-D stacks of 2048x2048x2048 pixels were obtained. Volume renderings and quantitative measurements on the sample were obtained by 3-D image segmentation and isosurface representations with Amira (Mercury Computer Systems, Chelmsford, MA) and dedicated software written for virtual tissue generation (Mebatsion et al. 2009).
Figure 8 shows the microstructure of different tissues of ‘Jonagold’ apple and ‘Conference’ pear obtained by synchrotron radiation X-ray imaging. The dermal tissue presents a dense assembly of cells with little or no voids. Both fruit are aerated by voids in between the cells of the parenchyma that makes up the bulk of the cortex tissue of the fruit. The vascular tissue in the mature fruit contains empty xylem vessels surrounded by dense tissue without any air voids. The parenchyma in the pear fruit consists of smaller cells and air voids than in apple.
The structure of the voids is significantly different in the two fruit. In apple voids have the size of the cells, while in pear the voids are small channel-like structures. The total fraction of voids is also significantly larger in the ‘Jonagold’ apple than in the Conference pear. Verboven et al. (2008) used the microstructure characteristics presented in Fig 3 to interpret the apparent gas exchange properties of the two fruit in relation to storability and internal disorders.
Conclusions
Internal defects in fruits can today only be detected destructively when it is too late; economic risks are therefore high. Early detection of interior defects and/or the aspects that initiate them can prevent severe economical losses. Thereto the role of the fruit microstructure must be understood and measurement of the relevant features online during preservation and transformation of fruits should be targeted. With respect to the first objective, it was demonstrated that the method of synchrotron radiation X-ray tomography provides a suitable tool to probe the microstructure of in vivo tissues. To develop fast and cheap online measurement technologies (such as X-ray radiography, nuclear magnetic resonance relaxometry and diffusometry, diffuse spectroscopy, or optical coherence tomography), the presented method serves as a reference.
fig 9. 3-D microstructure of apple ‘Jonagold’ (left) and pear ‘Conference’ (right) obtained from synchrotron radiation X-ray tomography. Air-filled pores are colored in blue, cells in yellow, cell walls and sclereids in brown. Details of the results are given in Verboven
En v ir o n m En ta ll y F ri En d ly a n d S a FE tE ch n o lo g iES F o r Q u a li ty o F F ru it S a n d vE g Eta bl ES
acknowledgments
The K.U.Leuven Interfaculty Council for Development Co-operation (IRO), the K.U.Leuven Research Council (project OT-08023), the Fund for Scientific Research (project G.06.03.08) and the Institute for the Promotion of Innovation by Science and Technology in Flanders (projects IWT-060720 and IWT-050633) are gratefully acknowledged for financial support. Pieter Verboven is Fellow of the Industrial Research Fund of the K.U.Leuven. The results were obtained with a beam time project of the European Synchrotron Radiation Facility in Grenoble, France (experiment MA222).
references
Babin P, Della Valle G, Dendievel R, Lassoued N, Salvo L. 2005. Mechanical properties of bread crumbs from tomography based finite element simulations. J Mat Sci 40:5867-73
Barcelon EG, Tojo S, Watanabe K. 1999. X-ray CT imaging and quality detection of peach at different physiological maturity.Trans ASAE42:435–41
Brecht JK, Shewfelt RL, Garner JC Tollner EW. 1991. Using X-ray-computed tomography to non-destructively determine maturity of green tomatoes. HortScience 26:45–7
Cloetens P, Ludwig W, Baruchel J, Van Dyck D, Van Landuyt J, Guigay JP, Schlenker M. 1999. Holotomography: Quantitative phase tomography with micrometer resolution using hard synchrotron radiation X rays.
Appl Phys Lett 75:2912-14
Cloetens P, Mache R, Schlenker M, Lerbs-Mache S. 2006. Quantitative phase tomography of Arabidopsis seeds reveals intercellular void network. Proc Natl Acad Sci USA 103:14626-30
Davis TJ, Gao D, Gureyev TE, Stevenson AW, Wilkins SW. 1995. Phase contrast imaging of weakly absorbing materials using hard X-rays. Nature 373:595-8
Jiang JA, Chang HY, Wu KH, Ouyang CS, Yang MM, Yang EC, Chen TW, Lin TT. 2008. An adaptive image segmentation algorithm for X-ray quarantine inspection of selected fruits. Comput Electron Agr 60:190-200
Kim SA, Punshon A, Lanzirotti A, Li L, Alonso JM, Ecker JR, Kaplan J, Guerinot M L. 2006. Localization of iron in Arabidopsis seed requires the vacuolar membrane transporter VIT1. Science 314:1295-8 Kuroki S, Oshita S, Sotome I, Kawagoe Y, Seo Y. 2004. Visualization of 3-D network of gas-filled intercellular
spaces in cucumber fruit after harvest. Postharvest Biol Technol 33:255-62
Lammertyn J, Dresselaers T, Van Hecke P, Jancsok P, Wevers M, Nicolaï BM. 2003a. Analysis of the time course of core breakdown in ‘Conference’ pears by means of MRI and X-ray CT.Postharvest Biol Technol
29:19-28
Lammertyn J, Dresselaers T, Van Hecke P, Jancsok P, Wevers M, Nicolaï BM. 2003b. MRI and X-ray CT study of spatial distribution of core breakdown in ‘Conference’ pears. Magn Reson Imaging 21:805-15 Léonard A, Blacher S, Nimmol C & Devahastin S. 2008. Effect of far-infrared radiation assisted drying
on microstructure of banana slices: An illustrative use of X-ray microtomography in microstructural evaluation of a food product. J Food Eng85:154-62
Lim KS, Barigou M. 2004. X-ray micro-computed tomography of aerated cellular food products. Food Res
Int 37:1001-12
Mebatsion HK, Verboven P, Ho QT, Mendoza F, Verlinden BE, Nguyen TA, Nicolaï BM. 2006. Modeling fruit microstructure using novel ellipse tessellation algorithm.CMES-Comp Model Eng 14:1-14
Mebatsion HK, Verboven P, Melese A, Billen J, Ho QT, Nicolaï BM. 2009. A novel method for 3-D microstructure modeling of pome fruit tissue using synchrotron radiation tomography images. J Food
Eng 93:141-8
Mendoza F, Verboven P, Mebatsion HK, Kerckhofs G, Wevers M, Nicolaï B. 2007. Three-dimensional pore space quantification of apple tissue using X-ray computed microtomography. Planta226:559-70 Plouraboue F, Cloetens P, Fonta C, Steyer A, Lauwers A, Marc-Vergnes J-P. 2004. X-ray high-resolution
vascular network imaging. J Microsc–Oxford 215:139-48
Rau C, Robinson IK, Richter CP. 2006. Visualizing soft tissue in the mammalian cochlea with coherent hard X-rays. Microsc Res Techniq 69:660-5
Salvo L, Cloetens P, Maire E, Zabler S, Blandin JJ, Buffière JY, Ludwig W, Boller E, Bellet D Josserond C. 2003. X-ray micro-tomography an attractive characterisation technique in materials science. Nuclear
Instruments and Methods in Physics Research Section B: Beam Interactions with Materials and Atoms
200:273-86
Schatzki TF, Haff RP, Young R, Can I, Le LC, Toyofuku N. 1997. Defect detection in apples by means of X-ray imaging.Trans ASAE40:1407–15
Se c ti o n 1 . n on -d eS tr u c ti v e m et h o d S f o r m ea Su ri n g q u a li ty o f f ru it S a n d v eg et a bl eS
Schotsmans W, Verlinden BE, Lammertyn J, Nicolaï BM. 2004. The relationship between gas transport properties and the histology of apple.J Sci Food Agr 84:1131-40
Sonego L, Ben-Arie R, Raynal J, Pech JC. 1995. Biochemical and physical evaluation of textural characteristics of nectarines exhibiting woolly breakdown: NMR imaging, X-ray computed tomography and pectin composition. Postharvest Biol Technol 5:187–98
Stuppy WH, Maisano JA, Colbert MW, Rudall PJ, Rowe TB. 2003. Three-dimensional analysis of plant structure using high-resolution X-ray computed tomography.Trends Plant Sci 8:2-6
Thomas P, Saxena SC, Chandra R, Rao R, Bhatia CR. 1993. X-ray imaging for detecting spongy tissue, an internal disorder in fruits of ‘Alphonso’ mango (Mangifera indica L.). J Hort Sci 68:803–6.
Thurner P, Muller R, Raeber G, Sennhauser U, Hubbell J. 2005. 3D Morphology of cell cultures: A quantitative approach using micrometer synchrotron light tomography.Microsc Res Techniq 66:289-98
Tollner EW, Hung YC, Upchurch BL, Prussia SE. 1992. Relating X-ray absorption to density and water content in apples.Trans ASAE 35:1921–8
Veraverbeke EA, Van Bruaene N, Van Oostveldt P, Nicolaï BM. 2001. Non destructive analysis of the wax layer of apple (Malus domestica Borkh.) by means of confocal laser scanning microscopy.Planta 213:525-33
Verboven P, Kerckhofs G, Mebatsion H, Ho Q, Temst K, Wevers M, Cloetens P, Nicolaï B. 2008. Three-dimensional gas exchange pathways in pome fruit characterized by synchrotron x-ray computed tomography. Plant Physiol 147:518-27
Westneat MW, Betz O, Blob RW, Fezzaa K, Cooper WJ, Lee W-K. 2003. Tracheal respiration in insects visualized with synchrotron X-ray imaging. Science 299:558-60
En v ir o n m En ta ll y F ri En d ly a n d S a FE tE ch n o lo g iES F o r Q u a li ty o F F ru it S a n d vE g Eta bl ES
02. NON-DESTRuCTIVE DETECTION OF INTERNAL
DEFECTS IN APPLE FRuIT By TImE-RESOLVED
REFLECTANCE SPECTROSCOPy
Maristella Vanoli1, Anna Rizzolo1*, Paola Eccher Zerbini1, Lorenzo Spinelli2, Alessandro Torricelli2 1CRA-IAA Agricultural Research Council – Food Technology Research Unit, via Venezian 26, I-20133 Milano, Italy
2ULTRAS-CNR-INFM and CNR-IFN, Politecnico di Milano, Dep. Physic, Piazza Leonardo da Vinci 42, I-20133 Milano, Italy
*E-mail: [email protected]
abstract
In the present research Time-resolved Reflectance Spectroscopy (TRS) technique was tested to detect some internal defects in different apple cultivars. The absorption (μa) and the reduced scattering (μs’) coefficients were measured at different wavelengths in ‘Braeburn’ (mealiness), ‘Granny Smith’ (internal browning) and ‘Fuji’ (watercore) apples. Afterwards, each fruit of ‘Granny Smith’ and ‘Fuji’ were cut and evaluated for internal defects. ‘Braeburn’ apples were submitted to sensory analysis (firm, crispy, mealy and juicy), percent juice and relative intercellular space volume (RISV) determinations. In addition, for ‘Granny Smith’, the colour of the pulp was measured. ‘Granny Smith’ sound fruits on average showed μa750=0.029 cm-1
and μs’750=12.2 cm-1; with the development of internal browning, μ
a750 increased to values >0.04 cm-1
and μs’750 decreased to values <10 cm-1 in severely affected fruit. Non-mealy ‘Braeburn’ apples were
characterized by significantly lower μs’790, μs’912 and higher μa912 than mealy ones. Sensory mealiness was positively related to μs’790 and μs’912 and negatively to μa912. The regions of ‘Fuji’ apples affected by watercore showed significantly higher μa790 and lower μs’790 values than the healthy regions. Results confirm the suitability of the TRS technique to inspect apples for internal defects, highlighting the need of determining the TRS threshold values as well as the number of measurement points specific to the cultivar and disorder.
Keywords: absorption coefficient, internal browning, mealiness, scattering coefficient, watercore
Introduction
Under specific conditions, apples (Malus domestica Borkh.) may develop internal physiological disorders which are only visible after cutting. Among them, internal browning may show symptoms at different locations, related to different factors, such as diffuse flesh browning, radial browning (related to senescent breakdown) and brown heart (related to CO2 injury). Watercore develops in some cultivars at harvest, often on the sunny side of the fruit; the affected areas look glassy due to the presence of water instead of air in the intercellular spaces. The water-soaked tissue is usually located around the vascular bundles or the core area. Mealiness is an internal quality defect which develops during storage and shelf life, when fruit flesh softens more by the weakening of middle lamella than of cell wall, producing more cell separation than cell breakages. The intact cells are responsible for the dry feeling in the mouth during mastication associated to the mealy texture (Harker et al. 2002).
Time-resolved Reflectance Spectroscopy (TRS) is a non-destructive optical technique by which the optical parameters of absorption coefficient (μa, related to chemical composition) and reduced scattering coefficient (μ’s, related to physical parameters) are estimated. The technique explores a banana-shaped volume of tissue at a depth of 1-2 cm depending on the distance between the injecting and collecting optical fibres (Cubeddu et al. 2001).
TRS has been successfully used to detect some internal defects in pears, kiwifruits and apples. In ‘Conference’ pears brown heart was detected by using μa690 and μa720, while the presence of translucent tissue, related to overripening and bruises, was detected by μ’s690 (Eccher Zerbini et al. 2002). In kiwifruit, by measuring μ’s630, it was possible to distinguish the sound region of fruit from that affected by Botrytis,
Se c ti o n 1 . n on -d eS tr u c ti v e m et h o d S f o r m ea Su ri n g q u a li ty o f f ru it S a n d v eg et a bl eS
the latter characterized by the higher translucency, which corresponded to a lower μ’s630 (Eccher Zerbini
et al. 2008). As for apples, Vanoli et al. (2007) found, for ‘Jonagored’, that μ’s780 increased with increasing mealiness while firmness, per cent juice and sensory crispness were negatively correlated to μ’s780. To identify mealiness in ‘Golden Delicious’ and ‘Cox’ apples, Valero et al. (2005) studied classification models based on TRS measurements at 672, 750, 818, 900 and 950 nm, with model performances ranging from 47 to 100% of correctly identified mealy versus non-mealy apples.
This work aims at applying TRS as a nondestructive method to inspect apples for internal defects, by studying the relationships between reduced scattering and absorption coefficients and mealiness in ‘Braeburn’, watercore in ‘Fuji’, and internal browning in ‘Granny Smith’ apple.
material & methods
Two batches of ‘Granny Smith’ apples from Laimburg (Bolzano province, Italy) with different sensitivity to internal browning were examined after storage at the end of May 2000. Twenty fruits per batch were used. On the equator (the largest transverse circumference) of each fruit, eight equidistant reference points (A–H) were marked. ‘Braeburn’ apples harvested on 20 September, 2000 in Toggenburg (Bolzano province, Italy) and stored in normal atmosphere (NA) and ultra-low oxygen (ULO) till the end of March. Thirty fruits stored in NA (mealy) and sixteen stored in ULO (non-mealy) were used. On the equator of each fruit two equidistant reference points were marked. ‘Fuji’ apples were harvested in Laimburg (Bolzano province, Italy) on 7 November, 2000 (corresponding to the late harvest date), transported to CRA-IAA in Milano. On the equator of 30 fruits four equidistant reference points (A-D) were marked.
The TRS measurements were carried out using the system described in Eccher Zerbini et al. (2002) at 670 nm (‘Fuji’), 750 nm (‘Granny Smith’), 790 nm (‘Braeburn’ and ‘Fuji’), and 912 nm (‘Braeburn’). For each of the reference point, four measurements were performed using two optical fibers along the axial direction with an acquisition time of 1 s and averaged. For all the apple cultivars, the average of all points/fruit were computed before submitting the optical data to ANOVA.
‘Granny Smith’ fruit were cut equatorially, the equatorial section of each fruit was photographed, and the presence and position of disorder in the internal tissue were recorded. Browned fruit were divided into: ‘brown core’ (BC) when internal browning affected only the core and the flesh was healthy, and ‘brown pulp’ (BP) when the disorder affected either only the pulp or both the pulp and the core. Colour of the pulp was measured on all the browned apples and on five out of the twenty healthy (H) ones (randomly chosen) at the positions correspondent to the maximum and minimum μa750 measured values within the same fruit at a distance of 15 mm from the skin, with a Minolta Chroma Meter CR-300. ‘Braeburn’ apples were submitted to sensory analysis using a panel of eight semi-trained judges evaluating the intensity of the firm, crispy, mealy, and juicy sensory attributes on an unstructured graphic scale with anchors near the extremes (“low”, “high”), to measurement of percent juice (Eccher Zerbini et al. 1999) and of relative intercellular space volume (RISV, Baumann & Henze,1983). As for the ‘Fuji’, the equatorial section of each fruit was photographed and the presence (W: watercore) or absence (H: healthy pulp) of watercore for each measurement point was coupled to its own μa670, μa790 and μ’s790; the presence of affected tissue close to the measurement point (HW) was also considered.
Statistical analyses were performed using the SAS/STAT (SAS Institute Inc., Cary, NC, 1999) software package. For all the cultivars, data of TRS measurements were submitted to analysis of variance (PROC GLM) considering the internal disorder as factor. Sensory, percent juice and RISV data of ‘Braeburn’ apples were submitted to analysis of variance (PROC GLM) considering mealiness as factor. Colour data of ‘Granny Smith’ apples were submitted to analysis of variance considering the browned region as a factor (PROC GLM). Means were compared by Tukey’s test at P
(‘Braeburn’) and optical and colour data (‘Granny Smith’) were studied using the PROC CORR procedure. Significance of P-value and r are indicated as follows: ns=not significant;* P P P
En v ir o n m En ta ll y F ri En d ly a n d S a FE tE ch n o lo g iES F o r Q u a li ty o F F ru it S a n d vE g Eta bl ES
results
Internal BrowningThe μa750 increased with the development of internal browning, with H fruits showing the lowest values of μa750 and BP ones the highest. On average, μs’750 was higher in H and BC than in BP apples (Table 1). Considering the pulp colour, H fruit had the highest hue and the lowest a*, b* and C* values (Table 1).
table 1. Mean values of μa750, μ’s750 and colour parameters of the pulp in healthy (H) and browned (brown core, BC;
brown pulp, BP) ‘Granny Smith’ apples.
H BC BP Sign. Tukey Optical properties μa750 (cm-1) 0.029 0.033 0.039 *** c b a μ’s750 (cm-1) 12.22 11.78 10.86 *** a a b Colour parameters L* 80.95 79.47 77.21 ** a a b a* -4.90 -3.70 -2.13 *** c b a b* 15.60 18.10 19.03 *** b a a C* 16.38 18.49 19.15 *** b a a Hue (degree) 107.48 101.43 96.33 *** a b c
The μa750 was positively correlated to a*, b* and C* and negatively correlated to hue and L*, while μs’750 was significantly correlated only to a* and L* (Table 2).
table 2. ‘Granny Smith’ apples: correlation coefficients of μa750 and μ’s750 with colour parameters.
μa750 μ’s750 L* -0.659 *** 0.543 ** a* 0.867 *** -0.573 ** b* 0.669 *** -0.221 hue -0.855 *** 0.502 C* 0.606 ** -0.158
The μa750 was able to distinguish H fruit from BP ones, as the former showed μa750 values below 0.030 cm-1
and the latter values above 0.033 cm-1. When internal browning affected only the core region of the apple,
μa750 ranged from 0.030 to 0.035 cm-1 (Fig 1).
Se c ti o n 1 . n on -d eS tr u c ti v e m et h o d S f o r m ea Su ri n g q u a li ty o f f ru it S a n d v eg et a bl eS
Examples of results of TRS measurements on the eight points around the equator of H, BC and BP fruit are reported in Fig. 2. Point F of μa graph for the BP panel has a low value due to an axial zone of pulp with no browning.
fig 2. ‘Granny Smith’ apples: μa750 (left) and
μ’s750 (centre) as a function of the position
around the equator in a healthy fruit (H), in a fruit affected by brown core (BC) and in a fruit affected by brown pulp (BP). The equatorial sections of fruit are shown in the panels (right). Units for absorption and scattering are cm .
mealiness
Non-mealy ‘Braeburn’ apples were characterized by significantly lower μs’790, μs’912 and higher μa912 than mealy ones (Table 3).
table 3. Mean values of μa790, μ’s790, μa912, μ’s912, scores of sensory attributes per cent juice and RISV in non-mealy
and mealy ‘Braeburn’ apples.
non mealy mealy Sign
Optical properties μa790 (cm-1) 0.037 0.037 ns μa912 (cm-1) 0.091 0.084 *** μ’s790 (cm-1) 16.41 20.13 *** μ’s912 (cm-1) 16.26 19.47 *** Sensory attributes firm 83.9 48.3 *** juicy 81.9 49.6 *** mealy 38.4 70.6 *** crispy 83.0 48.8 *** Quality parameters % juice 33.1 17.6 *** RISV(%) 20.7 17.1 ***
En v ir o n m En ta ll y F ri En d ly a n d S a FE tE ch n o lo g iES F o r Q u a li ty o F F ru it S a n d vE g Eta bl ES
Mealy apples had significantly lower percent juice and RISV than non-mealy ones, and were described at sensory analysis as less firm, less juicy, less crispy and more mealy than non-mealy fruit (Table 3).
The μa790 did not correlate with any of the sensory attributes and quality parameters, while μa912 was positively correlated to firmness, crispness, juiciness and percent juice and negatively correlated to mealiness and RISV. The μs’790 and μs’912 were positively correlated to mealiness and RISV, while they were negatively correlated to the other sensory attributes and percent juice (Table 4). For μs’790 and μs’912 values above 19 cm-1 and for μ
a912 values below 0.09 cm-1 mealy, non-crispy and non-juicy apples were found (Fig 3). table 4. ‘Braeburn’ apples: correlation coefficients of μa and μ’s at 790 and 912 nm with sensory attributes and quality
parameters (sensory attributes and %juice n=46; RISV n=20).
μa790 μa912 μ’s790 μ’s912 firm 0.114 0.781 -0.750 -0.742 juicy 0.057 0.746 -0.758 -0.747 mealy -0.042 -0.720 0.713 0.717 crispy 0.148 0.706 -0.732 -0.734 %juice 0.095 0.759 -0.833 -0.867 RISV -0.087 -0.664 0.687 0.647 significance of r: grey:***; pale grey**
fig 3. ‘Braeburn’ apples: correlations of μa912 (right) and of μ’s790 (left) with mealiness (mealy, diamond; non-mealy, triangle).
watercore
Healthy ‘Fuji’ pulp was characterized by significantly lower μa790 and higher μs’790 than zones affected by watercore. If the tissue affected by watercore was near the point of measurement of the optical properties,
μa790 was on average slightly higher and μs’790 slightly lower than the healthy points (Table 5). Examples of TRS results on the four points around the equator of H, HW and W fruit are shown in Fig 4.
table 5. Mean values of μa670, μa790 and μ’s790 in ‘Fuji’ apples (H, healthy; HW, watercore near the position of
measurement; W, watercore).
H (n=42) W (n=33) HW (n=5) sign Tukey
μa670 (cm-1) 0.079 0.096 0.112 * a a a μa790 (cm-1) 0.049 0.059 0.053 *** b a ab μ’s790 (cm-1) 8.99 8.21 8.68 *** a b ab
Se c ti o n 1 . n on -d eS tr u c ti v e m et h o d S f o r m ea Su ri n g q u a li ty o f f ru it S a n d v eg et a bl eS
fig 4. ‘Fuji’ apples: μa790 (top column left) and
μ’s790 (bottom column left) as a function of the
position around the equator in an healthy fruit (diamond, H), in a fruit with watercore near the position of measurement (square, HW) and in a fruit affected by watercore (triangle, W). The equatorial sections of fruit are shown in the panels on the right column.
discussion
Using TRS it was possible to detect some of the internal disorders of apples related to changes in colour (browning) or texture (mealiness, watercore) of the pulp. It was confirmed that internal browning is more related to the absorption coefficient as shown by the high correlation coefficients with colour parameters. In fact, using μa750, healthy fruit could be distinguished from those affected by internal browning both in the core and in the pulp, whereas using μ’s750 fruit affected by internal browning in the core could be classified as healthy.
The positive correlation between μs’ and mealiness, already found in ‘Jonagored’ apples (Vanoli et al. 2007) was confirmed. The threshold value above which only mealy ‘Braeburn’ apples are found is μs’790>19 cm-1
vs μ’s780>11 cm-1 found by Vanoli et al. (2007) for ‘Jonagored’, underlining the need of determining the TRS
threshold values specific to the cultivar. Moreover, in this work, high correlations were also found between mealiness and the optical properties measured at 912 nm, near the absorption peak of water.
Tissue affected by watercore can be distinguished by the healthy ones using both μa790 and μs’790. Differently from what found in pears (Eccher Zerbini et al. 2002) and kiwifruits (Eccher Zerbini et al. 2008), where using the absorption coefficient measured near the chlorophyll peak (690 and 630, respectively) it was possible to detect translucent tissue, in this experiment no relationships were found between μa670 and watercore.
Our results stressed that to make certain the detection of the defect, the number of measurement points has to be suited to the localization and distribution of the affected tissue. In fact, to detect internal defects involving all the pulp, such as mealiness, two measurement points were sufficient, while to detect defects involving only part of the pulp, such as watercore, four points at a distance of 90° were not enough.
acknowledgements
We would like to thank Dr. Angelo Zanella from Agricultural Research Centre of Laimburg, Auer, Italy for the management of fruits.
En v ir o n m En ta ll y F ri En d ly a n d S a FE tE ch n o lo g iES F o r Q u a li ty o F F ru it S a n d vE g Eta bl ES
references
Baumann H, Henze J. 1983. Intercellular space volume of fruit. Acta Hort 138:109-11
Cubeddu R, D’Andrea C, Pifferi A, Taroni P, Torricelli A, Valentini G, Dover C, Johnson D, Ruiz-Altisent M, Valero C. 2001. Non-destructive quantification of chemical and physical properties of fruits by time-resolved reflectance spectroscopy in the wavelength range 650-1000 nm. Appl Opt 40:538-43 Eccher Zerbini P, Grassi M, Grazianetti S. 1999. Operating parameters for instrumental measurement of
juiciness in fruits. pp:290-3. In: Agri-Food Quality II: Quality Management of Fruits and Vegetables, Hägg M, Ahvenainen R, Evers AM, Tiilikkala K (eds), Special Publication n. 229. The Royal Society of Chemistry. London
Eccher Zerbini P, Grassi M, Cubeddu R, Pifferi A, Torricelli A. 2002. Nondestructive detection of brown heart in pears by time-resolved reflectance spectroscopy.Postharvest Biol Technol 25:87-97
Eccher Zerbini P, Vanoli M, Rizzolo A, Cubeddu R, Spinelli L, Torricelli A. 2008. Time-resolved Reflectance Spectroscopy: a non-destructive method for the measurement of internal quality of fruit. Acta Hort 768:399-406
Harker FR, Maindonald J, Murray SH, Gunson FA, Walker SB. 2002. Sensory interpretation of instrumental measurements 1: Texture of apple fruit. Postharvest Biol Technol 24:225-39
Vanoli M, Rizzolo A, Grassi M, Zanella A, Torricelli A, Spinelli L, Eccher Zerbini P. 2007. Relationship between scattering properties as measured by time-resolved reflectance spectroscopy and quality in apple fruit. (13 pages) CD-ROM Proc 3rd Int Symp CIGR Section VI “Food and Agricultural Products: Processing and
Innovation” Napoli, Italy, 24–26 September
Valero C, Barreiro P, Ruiz-Altesent M, Cubeddu R, Pifferi A, Taroni P, Torricelli A, Valentini G, Johnson D, Dover C. 2005. Mealiness detection in apples using time resolved reflectance spectroscopy.J Texture Studies 36:439-58
Se c ti o n 1 . n on -d eS tr u c ti v e m et h o d S f o r m ea Su ri n g q u a li ty o f f ru it S a n d v eg et a bl eS
03. ON THE APPLICATION OF SPATIALLy RESOLVED
REFLECTANCE AND DIFFuSE LIgHT BACkSCATTERINg
gONIOmETRy TO THE PREDICTION OF FIRmNESS IN
APPLE ‘BRAVO DE ESmOLFE’
Rui Guerra1*, Sandro Almeida1, Ana Cavaco1, Dulce Antunes2
1Centro de Electrónica, Optoelectrónica e Telecomunicações (CEOT), Universidade do Algarve, Campus de Gambelas,
8005-139 Faro, Portugal
2IBB-CBV, Universidade do Algarve, FCT, Ed 8, Campus de Gambelas, 8005-139 Faro, Portugal
*E-mail: [email protected]
abstract
In this study we have made exploratory tests on a set of 40 apples (Malus domestica Borkh.) ‘Bravo de Esmolfe’, using spatially resolved reflectance (SRR) and diffuse light backscattering goniometry (DLBG). The objective was to test the potential of DLBG for firmness prediction, as compared with SRR, whose potential has been already proved in the literature. SRR is performed with a red diode laser and a CMOS camera. DLBG uses the same laser shining on the apple and a photomultiplier tube collecting the light reemitted from a small area, at angles ranging from 90 deg (tangent to the surface) to 180 deg (normal to the surface). From the measurements several parameters have been calculated (e.g. decay exponent for SRR profiles, anisotropy factor for the DLBG angular distributions) and Partial Least squares (PLS) models for the prediction of firmness were build. The model based on DLBG variables (only) and on SRR variables (only) gave similar results. From here we conclude that, within the obvious statistical limitations of the test, DLBG seems to match the potential of SRR for firmness prediction. The possibility of combining both measures in one model is also discussed.
Introduction
Several optical non-destructive optical techniques (NDOT) for fruit quality assessment are based on the fundamental phenomenon of light propagation, absorption and scattering in random media. Traditional approaches like Near Infra Red Spectroscopy (NIRS) rely on the physics of this process but the analysis is rather heuristic, taking the spectra “as they are” and relating them directly with the fruit physiological attributes of interest. Nevertheless, it is always important to consider the basic aspects of the theory, trying to understand if a more deep knowledge of the optical processes may lead to improved methods in NDOT for fruit quality assessment. The above argument serves the purpose of remembering that in general the propagation of light in a complex media is described by the specific intensity I(r, ) [units: Wm-2sr-1Hz-1],
where r stands for the position of a given point in space and is a specific direction for energy flow. In other words, the intensity of light in a given point depends on the spatial location of that point and on the direction considered for energy flow. The specific intensity depends further on the wavelength considered. Thus, the most general approach in NDOT would have to discriminate spectral, spatial and angular variations of the light signal.
The investigation of the angular dependency has not attracted attention in NDOT, since all the current methods integrate the angular components or, at least, choose one. The reasons for the lack of data on angular measurements are multiple: i) angular measurements (goniometry) are slow and time-consuming; ii) there are no commercial systems available; and iii) if the conditions for the validity of the so-called “diffusion approximation” (DA) are valid, the angular distribution of light inside the tissue is expected to be nearly isotropic and that emerging from the tissue expected to be Lambertian [dependence of intensity on cos( being the angle between the normal to the surface and the direction of observation]. Hence, angular data would be expected to provide poor additional information. We have overcome the two first
En v ir o n m En ta ll y F ri En d ly a n d S a FE tE ch n o lo g iES F o r Q u a li ty o F F ru it S a n d vE g Eta bl ES
issues by using a light scattering goniometer set up in our laboratory and used already in previous studies (Pinto et al. 2007). The answer to the third objection is also twofold: i) there is no evidence that DA is always valid; ii) even when DA is valid the assumption of Lambertian radiance emerging from the tissue may be false (see Li et al. 2000 and also our results below).
The objective of this work was then to investigate the potential of angularly resolved light measurements as a possible NDOT for fruit firmness assessment. The technique we will be employing was named Diffuse Light Backscattering Goniometry (DLBG). In this technique a laser beam is incident upon the fruit and the light re-emerging from a nearby small surface is measured as a function of the angle between the normal to the surface and the direction of observation. In parallel to DLBG we have performed measurements of Spatially Resolved Reflectance (SRR), whose applicability for fruit firmness prediction been proven in the literature (Lu 2004). SRR results will be used for comparison with DLBG results. The preliminary results presented here are only indicative, since the reduced number of samples (40 apples) is far from the minimum statistically acceptable when working with biological material. However, the comparison with SRR on the same conditions compensates in part for the sample small size.
material & methods
fruit
Forty ‘Bravo de Esmolfe’ apples (Malus domestica Borkh.) were bought in a local supermarket and kept under shelf-life conditions (70% RH, 23±2 ºC) in dark. In each measurement session, ten apples were followed optically and at the end used to perform destructive measurements of firmness. The four measurement sessions spanned a period of 20 days.
Spatially resolved reflectance
A diode laser (Hitachi HL6314MG, Hitachi, Tokyo, Japan, housed in a Thorlabs TCLD M9-TEC mount and coupled to a Thorlabs laser diode controller LDC 205 and to a TED 200 temperature controller, Thorlabs, Newton, USA) emitting at 635 nm was coupled to an optical fiber of 1 mm diameter whose other end was held in contact with the apple skin (this insures that all re-emitted photons travel through the interior of the fruit). The light halo on the apple surface was imaged through an 8 bit CMOS camera (BCi4 CMOS Camera, C-Cam Technologies, Belgium) and appropriate lens. A neutral density filter wheel (Edmund Optics M54-080) was placed in front of the camera and for each halo three photos were taken with different attenuation factors (exposure and gain always kept at the same level). The lowest attenuation provided detail on the most exterior areas of the halo (and the image was saturated on the center of the halo), while the highest attenuation provided detail on the center of the halo (loosing definition in the exterior areas). The intermediate attenuation served to provide a bridge between the extreme attenuation photos. Dark photos (laser off) were subtracted in order to eliminate the ambient and shot noise. The photos were further analyzed through the Matlab software (MATLAB 7.7 (R2008b)®, The MathWorks, Inc., Natick, USA, 2008).
diffuse light Backscattering goniometry
The same diode laser, with horizontal polarization, was sent through an opaque tube of 8 mm diameter whose other end was held in contact with the apple skin (this insures that all re-emitted photons travel through the interior of the fruit). The light halo on the apple surface was blocked through the application of opaque adhesive tape, except in a small square area of 1 cm2 adjacent to the tube. The angular dependence
of the light re-emitted by this area was measured by a light scattering goniometer. This was constituted by a motorized rotational stage (Newport URS100PP rotation stage and Newport ESP 300 motion controller, Newport Corp., Irvine, USA) attached to a rotating arm holding a polarizer and a collecting lens. The arm rotates between 0 º (normal to the halo) and 90 º (tangent to the halo) in steps of 5 º, collecting the light re-emitted at different angles. The lens (74-UV, Ocean Optics, Dunedin, USA) focuses the light on
Se c ti o n 1 . n on -d eS tr u c ti v e m et h o d S f o r m ea Su ri n g q u a li ty o f f ru it S a n d v eg et a bl eS
an optical fiber coupled to a photomultiplier tube (PMT) (H5784-20, Hamamatsu, Shizuoka, Japan). The polarizer was used in two positions: vertical and horizontal polarization. The signal from the PMT was low-pass filtered (SR650 dual channel filter, Stanford Research Systems, Sunnyvale, CA, USA) and acquired by a digital oscilloscope (Picoscope 3206, Pico Technology, Cambridgeshire, UK). Dark measurements (laser off) were subtracted in order to eliminate the ambient and instrumental noise. All the system is automated and controlled through a PC via the Labview software (Labview 7, Austin, USA, 2004).
fruit attributes
Firmness was measured destructively immediately after the optical assay in two opposite sites along the fruit equatorial line by puncture, after skin removal, with a fruit pressure tester (FT 327, Italy).
results
Spatially resolved reflectance
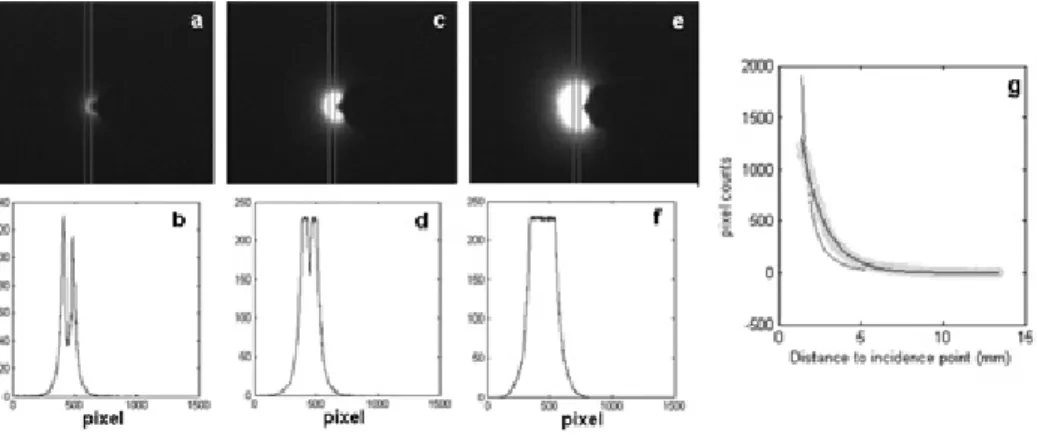
The results of SRR are depicted in Fig 1. The three profiles obtained with the three attenuations were normalized through a Matlab script. Basically, it was applied to two pictures at a time and looks for a pixel range where the counts of both pictures are in the range [p; 255-q], where p and q are “safety” constants that prevent distortions in linearity due to proximity to the noise floor (p) or to the saturation level (q). The ratio count (Photo 1)/count (Photo 2) was approximately constant under the above condition and that constant was used to normalize the counts of Photo 1 to those of Photo 2. The process was then repeated for Photo 3. A typical final result is depicted on Fig 1g (conversion pixel/distance also made). Noteworthy, the profiles did not obey the classical result from the diffusion approximation (DA) (Contini et al. 1997). In Fig 1g the DA best fit was the line that fails most of the experimental data. The experimental points (dense dots, defining a broad line) were much better fitted by a simple exponential decay (line passing through the points).
fig 1. Results of SRR. a) image of the light halo (and of the optical fiber tip) in one of the pears with the highest attenuation; b) intensity profile corresponding to the box represented in a); c) same as a) with intermediate attenuation; d) same as b) with intermediate attenuation; e) same as a) with lowest attenuation; f) same as b) with lowest attenuation; g) full profile for the left wing, obtained after merging the three preceding profiles (detail of the merging procedure in the text).
diffuse light Backscattering goniometry
The results of DLBG are depicted in Fig 2. The phase functions presented are simply proportional to the PMT output at the different angles of measure. The phase functions were not found to follow the uninteresting