Integration of Fire Risk in a Sustainable Forest
Management Model
Maria de Belém Costa Freitas1, António Xavier2,* and Rui Fragoso3 ID
1 ICAAM (Institute of Mediterranean Agricultural and Environmental Sciences),
Sciences and Technology Faculty, Universidade do Algarve, Gambelas Campus, Edf. 8, 8005-139 Faro, Portugal; [email protected]
2 CEFAGE-UE (Center for Advanced Studies in Management and Economics), Universidade do Algarve, Gambelas Campus, Edf. 8, 8005-139 Faro, Portugal
3 CEFAGE-UE (Center for Advanced Studies in Management and Economics), Management Department, Universidade de Évora, N◦2, Apt. 95, 7002-554 Évora, Portugal; [email protected]
* Correspondence: [email protected]; Tel.: +351-289-800-900 (ext. 7391) Academic Editor: Dave Verbyla
Received: 21 June 2017; Accepted: 25 July 2017; Published: 29 July 2017
Abstract:In Mediterranean areas, forest fires are a considerable risk most years. The seasonality of the climate with a dry summer, high temperatures and low rainfall (which implies increased flammability of materials) is one of the main factors in the ignition and progression of fires. This factor conjugated with more favourable biophysical conditions (e.g., high slopes, aspect) leads to easy propagation and the increasingly destructive power of such phenomena. To prevent and reduce the consequences of forest fires, it is necessary to simulate and forecast the territory use and management, not only focused on forest areas, but also on all land uses and agricultural activities that may coexist there, considering the probability of fire occurrence. The objective of this paper is to present a methodological approach to address the integration of fire risk in integrated Mediterranean forest management models. The methodological approach considers simultaneously the climatic conditions through different times of the year (more or less favourable to forest fire damage) and structural conditions addressed to land uses, aspect, slope, roads and demographic density. The methodological approach was implemented in a management area located in the Algarve, in southern Portugal. The results for the Algarve region showed that the proposed approach is very useful for managers, since it allowed the calculation of fire susceptibility, vulnerability and fire damage, according to several climatic scenarios. It also allowed the incorporation of different paths regarding different fire risk conditions and the minimization of risk due to fire damage through different management responses.
Keywords:fire risk; fire damage; forest fires; decision support tools; Mediterranean forests
1. Introduction
Mediterranean Forests are ecosystems of great ecological value and although they represent less than 2% of the continental area, 20% of the world’s flora is included in these ecosystems [1,2]. This diversity, compared to Nordic forests, reveals a relatively high genetic variability due to the survival of many conifers and broadleaf species [3,4].
In these ecosystems, one of the major threats is forest fires. In fact, losses caused by fires are frequent and some authors [5,6] consider fires as one of the most perceptible risks faced by farmers, mainly due to the special situations that increase this phenomenon. The dry, hot summers that characterize the Mediterranean climate lead to increased fire risk and ecosystem fragility [2].
Fire is a natural phenomenon, being part of the development strategy of some species and landscape renovation, it models the forests and is prior to Man’s attempts to confront it [7].
Forests 2017, 8, 270 2 of 20
Nevertheless, society’s development and human settlement have increased the occurrence of this phenomenon. Growing human populations have led to an increasing demand for several forest products, while there is a need to maintain the integrity of a multi-functional forest [8]. In this context, the relevance of fire as an element in the forest’s evolution is considerable. Fire has multiple environmental impacts, which depend essentially on several factors regarding its characteristics, such as size and intensity [5,9].
Forest fires are one of the most important agents of land use change in Portugal, being a threat to forests [10] and one of the most important natural risks affecting the country, especially in summer, with adverse economic impacts and consequences [11].
Sustainable forest management is concerned with the enhancement of various forest-related functions (biodiversity conservation, soil maintenance, habitat, etc.) and whatever the purpose given to a forest and its products and services it is undeniable that the end result should generate maximum utility. Managers’ choices are conditioned by economic issues and often change the ability of forests to produce resources for future generations, to protect the flora and fauna [12] and to be more resilient to forest fires. Therefore, forest management models must consider fire risk and fire losses.
Several studies carried out in the forest sector provide a considerable number of fire risk indicators [13–17]. However, integration of such approaches in a management model always excludes a holistic approach, since they are only focused on forest stands [6,10] or do not connect existing approaches in a systemic way, as an optimization model [14–16]. One question remains: What are the main aspects of risk evaluation that should be considered when the objective is to manage areas where forest coexists with agriculture, husbandry, shrubs, agricultural facilities, and villages?
The objective of this paper is to propose a methodological approach that integrates the fire risk in Mediterranean forest management models. This approach allows to assess the susceptibility to forest fire and fire damage and the subsequent economic variability. All components in the system are considered simultaneously (agriculture, forest, buildings, roads) and the climatic and structural determinants of fire are considered in the management of forest areas. To illustrate the approach proposed, we applied it in the Algarve region of southern Portugal, with its results being promising. The remainder of this paper is presented as follows: in Section two, the theoretical framework is presented and existent studies analysed; in Section three, the formulation of the proposed approach is analysed; in Section four, the empirical implementation is described; and in Section five, the results are presented and discussed. Finally, Section six presents the main conclusions of this work.
2. The Methodological Background
2.1. Forest Fire Occurrence and Propagation Causes
Risk is often a problem that influences decisions [18]. Many people are averse to risk when facing reality [19]. In Mediterranean forests, losses caused by fires are frequent and some authors [5,6] consider fires as one of the most perceptible risks faced by farmers. What are the distinguishing characteristics of this risk?
In the Mediterranean area, the long dry period in summer tends to increase fire occurrences, with severe damage to agriculture and forests concerning production, but also to the infrastructure needed to manage the forest—with fires, losses are linked not only to living species but also to farm structure. Therefore, the causes of risk may be divided into two distinct groups: climatic causes and structural causes.
Regarding the first group, Mediterranean forests are exposed to extreme climatic constraints such as prolonged drought, but also heavy thunderstorms. Several studies analyse and try to establish relations among the synoptic and weather conditions and fire occurrence [20,21].
Forest wildfires are dependent on the summer drought and tend to be associated with high temperatures [22]. These authors underline that the increase in temperature promotes a greater frequency of fires, due to the effects of temperature on the flammability of fuel. Lower precipitation
and higher temperatures reduce moisture availability, increasing the risk of fire in areas where the flammability of fuel can be less important than fine fuel availability [23]. Forest fires tend to be concentrated in summer when the temperature is high and humidity and fuel moisture are lower [24].
An increase in temperature will increase the dryness of the fuel and reduce relative humidity, the risk factors associated with low precipitation [25]. More recently, for instance, studies such as [26] try to identify the most suitable weather conditions for fires using different combinations of input variables.
In Portugal, large forest fires result from many days with high temperatures, severe dryness and favourable conditions for wind propagation, after long periods without rainfall [23,27]. Wind behaviour is important in explaining each fire evolution, namely when large fires occur with a predominance of wind circulation from the N-NW quadrant or E-SE quadrant [28]. These two main wind directions are considered responsible for large fires. There is also a strong relationship between days of high maximum temperature and the occurrence of forest fires [5]. The days which concentrate the large forest fires are those which combine high temperatures, severe dryness and favourable conditions for wind propagation, after long periods without rainfall [23,27]. According to the authors of [28], wind behaviour is important in explaining each fire evolution. They concluded that large fires occurred when there was a predominance of wind circulation from the N-NW quadrant or E-SE quadrant. These two main wind directions are considered responsible for large fires. Nevertheless, the authors of [5] identified a clear relationship between days of high maximum temperature and the occurrence of forest fires. More recently, the authors of [29], for the period 1970–2010, analyse the relationship between meteorological variables expressed by the temperature and precipitation in Portugal, and identified a strong correlation between the weather conditions and the occurrence of forest fires. Factors such as high temperatures and low relative humidity are propitious for forest fires.
Therefore, the most relevant climatic determinants for the occurrence of fires depend on temperatures (high), relative humidity of the air (low), precipitation (absence), and wind (existence, northern or intensity of this quadrant) [23].
Regarding structural factors, there are many factors influencing the probability of forest fires. Some can be controlled, such as land use, composition of species and stand structure [30]. However, factors not controllable by the manager should also be considered, such as topography and factors relating to human activity, such as population density or type of land use [10].
Previous studies demonstrate the importance of these factors in the occurrence of forest fires. According to [31], to foresee fire behaviour over time, it is necessary to consider variables such as vegetation, topography and a local model of fire propagation or behaviour. The relevant structural variables are vegetation, forest species, land use, altitude, slope, aspect, proximity to roads and urban areas, population density, road network, and historical aspects [13–16,32]. These factors are usually included in fire risk indexes.
The importance of each of these structural factors is described as follows (for a more detailed review of these factors, see, for instance, [14] or [33]).
Topography, which includes slope, aspect and elevation has a great impact on increasing or decreasing the rate of fire spread when there is an ignition source and it affects the way in which fuel and weather change [14,33]. The slope is considered a critical factor, since steep slopes increase the rate of ignition and the speed and spreading of fire. Also, the authors of [34] highlight that fire always spreads faster up-slope. On the other hand, aspect is related to insolation and the rate of moisture [14]. In the northern hemisphere, the south and southwest aspects are favourable for fire to start and spread, because they receive more sunshine and have lower humidity and higher fuel temperatures [35]. Elevation is related to rain availability and wind behaviour, with the probability of fire being lower in areas of higher elevation [33].
Land use is also important and human occupation roads and urban areas can either serve as firebreaks or result in an increased forest fire occurrence, due to a more intense human activity. Human factors are relevant to explain fire occurrence globally and also in the Mediterranean area [36,37].
Forests 2017, 8, 270 4 of 20
Finally, vegetation is also important, because it is the fuel available for the fire, leading to different fire ignition and spread conditions [14].
The above considerations determine different consequences concerning losses, depending on the different meteorological conditions faced by farmers and the structural aspects of forest areas. 2.2. Fire Indexes
A fire risk index is a general term used to express an assessment of factors that determine the ease of ignition, rate of spread, difficulty of control and impact of fires [38]. However, the mapping of forest fire risk is not a new procedure and has been used by various agencies responsible for preventing and fighting forest fires [31]. Before analysing several fire indexes, the following concepts must be discussed and defined: fire risk, fire danger and fire hazard. The term ‘fire risk’ refers to the possibility of fire starting due to the presence of causative agents. Usually, it describes the physical probability that a natural event occurs’, and its potential damage to people and the environment [39]. Fire danger describes the ‘factors affecting the inception, spread and resistance to control, and often are expressed as an index’, including the weather conditions. Fire hazard refers to the potential fire behaviour related with the ‘static’ properties of fuel [39,40]. It describes the potential fire behaviour, without regarding the influence of weather state on the fuel moisture [41]. For a deeper review of these concepts, see [42]. Several solutions for classification of fire indexes have been proposed: (1) strictly meteorological methods, which are based exclusively on weather data (temperature, humidity, precipitation . . . ); and (2) integrated methods, which include as input the state of vegetation and its moisture content [38,43].
One of the most recent approaches to classifying these methods is proposed by the European Union Joint Research Centre [44] and suggests a classification following a time scale: (i) Structural or long term, derived from relatively stable factors, such as topography or land use; (ii) Dynamic or short term, based on parameters that vary almost continuously; and (iii) Integrated, including structural and dynamic variables [31,38,43].
Regarding type (i) indicators, the first structural index was created by [13] and identifies the most relevant factors in the Mediterranean basin: altitude, orientation, slope, proximity to major and minor roads and the vegetation classes representing different types of fuels. Other approaches include the National Fire Rating System (NFDRS), which was used in the model developed by [30], to predict the degree of probability in any place. An approach for analysing fire risk and creating synthetic indexes was created by the authors of [39]. This approach is divided into two main components: danger and vulnerability and it was applied to the whole Spanish Iberian territory.
In Portugal, the authors of [14,38] proposed an additive indicator, which is based on the studies by the authors of [13] and considers altitude, slope, aspect, proximity to roads, trails and urban areas and fuel-oriented vegetation classes.
Recent studies in Portugal developed other structural indicators, such as the one used to create the Fire Risk Cartography (CRIF) [15,45]. The CRIF is produced by a model using physiographic variables, which explain the spatial variability of forest fire risk within each county area [15]. More recently, this methodology has been updated, taking into account different items and their respective weightings-exposure, slope, demography (population density per km2), road network (density of forest roads and distance to roads) and vegetation (soil use and occupation) [15].
Another approach was proposed by the authors of [16] to provide guidelines for the elaboration of Municipal Fire Prevention Plans. This indicator considers several components: the probability, susceptibility and hazard (resulting from the first two) and the potential damage. In detail, probability regards the possibility of yearly occurrence of a fire in a certain location, in this case a forest pixel area [16]. The susceptibility of a territory expresses its potential conditions for the occurrence of a damaging phenomenon. Finally, the hazard is the product of probability and susceptibility. Hazard is the probability of occurrence in a given time interval of a potentially damaging phenomenon. Combined with the potential damage, which results from a weighting between vulnerability and economic value, the “risk” or expected damage is calculated [16].
Methods based on logistic regression and Bayesian probabilities to identify fires of great magnitude were also developed, considering the mapping of burnt areas in the period from 1990 to 2007 in the district of Castelo Branco (inland of Portugal) [17].
Regarding type (ii) indicators, there are several approaches worldwide. For instance, very recently, the authors of [46] reviewed the meteorological danger indexes and the correlations of these causative attributes with fire occurrence are studied in order to develop the fire danger index [46]. Other well-known approaches include the Canadian Fire Weather Index (FWI) [47] and the Indice di Riduzione Evapotraspirazionale del Pericolo di Incendio (IREPI; “Fire Risk Evapotranspiration Reduction Index”) [48].
In Portugal, dynamic danger indices based on various meteorological indicators have also been developed [23]. Since 1998, the Institute of Meteorology (IM) has used the meteorological fire danger index system of the Canadian FWI. This index estimates fire danger considering the state of the various fuels present in forest soil, which is determined indirectly through observations of meteorological elements [49,50]. In Portugal, the FWI system was implemented and calibrated by the authors of [51]. More recently, the authors of [52] calibrated the FWI for two Mediterranean areas (Algarve, Portugal and Peloponnese, Greece) by using experimental data collected for the forest fuel moisture content. 2.3. Integration of Fire Risk on Management Models
In order to integrate fire risk in forestry management, a method able to analyse risk must first be defined.
The modelling process in the forestry sector has progressed greatly over the last 30 years [12,53]. The first papers using linear programming in forest management were published in the 1960s [54,55]. Regarding the inclusion of fire risk in management models, the first approaches emerged in the USA in the early 1980s [6].
Nevertheless, the risk of fire is just one of many factors that managers should consider in managing forests. Therefore, the development of an integrated strategy for fire management should start with a division of the territories and specification of their particular fire regime. This fire regime should then be transmitted to specialized managers, who can respond with a program to minimize the cost of intervening, together with an assessment of the potential impact of its proposals for the fire protection program on public property, safety and preservation of ecosystems [56].
The causes of fires were studied by the authors of [57], who showed that it is reasonable to consider a Poisson distribution of probabilities when fires have human causes.
According to the authors of [6], studies that incorporate fire risk are divided into two groups: those that consider forest management at the scale of stands and those that consider forest management at the scale of the landscape.
Examples of the investigation developed in these studies are presented now. The probability of a catastrophic fire was considered in a discrete time by the authors of [58] and the risk of fire was considered associating probabilities of fire independent from forest age. A discrete stochastic model was developed by the authors of [59], considering that risk was forest age dependent, to analyse the impacts of fire risk on stand management [6]. Also, in [60], the effects of forest fire on long-term equilibrium timber supply were incorporated, analysing the consequences of forest fires in wood production considering the proportion of burnt area [6,60]. In other studies [61], a strategic initial attack simulation model was developed to help the decision on how many and what type of air tankers should be acquired to satisfy the requirements an initial intervention [6,61].
More recently, in Portugal, the authors of [6] use risk models and damages, based on the results of a logistic regression model [10], and integrate them in a forest management model. The risk model calculates the probability of occurrence of fire in the forest stands, while the damage model estimates the probability of mortality after the occurrence of fire and quantifies the percentage of dead trees in stands where mortality was found.
Forests 2017, 8, 270 6 of 20
3. The Methodological Approach 3.1. General Design of the Approach
The methodological approach was developed, considering previous studies and the specificity of our problem in which all the farms’ activities are accounted in an interconnected way.
Given the special nature of risk related to forest fires, the methodology used must allow risk quantification considering land use, biophysical characteristics and type of years associated with different climatic situations that favour forest fires and their effects on income variability.
Stochastic mathematical programming models are very useful to analyse the variability of farm income, allowing the incorporation of risk relative to uncertainty and the adjustment of the input–output coefficients [19]. A general guideline of how to model risk in forestry and the use of stochastic models are provided by the authors of [62]. In this type of model, each type of year is represented by a state of nature, in which conditions are described by a specific set of input–output coefficients that determine the respective income for each alternative plan. To each state of nature, an occurrence probability can be assigned [63].
Stochastic programming was developed by the authors of [64,65] and requires the problem to be formulated as a constrained optimization problem. Stochastic programming models allow consideration of different risk sources that influence the objective function and constraints. As the decisions related to farm planning and management consider several levels, discrete stochastic programming is the best approach [19].
Mathematical programming models easily consider the variability inherent to risk in the model parameters [18]. One of the most used methods is the minimization of total absolute deviations (MOTAD) model [66].
Thus, inspired by [23], a model based on a combination of the discrete stochastic programming approach of [64] and the approach to calculating fire damage [16] is proposed. Its simplified mathematical formulation is presented as follows:
Max UT= E−θ.RSK (1) Subject to EE=
∑
sn prsn(pSn−TCsn−DTsn) (2)∑
j Xjsn≤qj (3)∑
j AXsnj =Ssn+Usn (4)where UT is the objective function, E is the expected farm income, RSK is a variable that computes the total expected deviation of income, θ is a coefficient of risk aversion, p are product prices, TCsn are the costs in each state of nature sn, DTsnis the total damage of forest fires in each state of nature sn, prsnis the probability of occurrence of each state of nature sn, Xsnj is a variable that represents the area or livestock heads of j agro-forest activities (forest, permanent and temporary crops and livestock) according to production technology, farm type, biophysical unit and state of nature, Ssnand Usnare the selling and in farm use variables of agro-forest products, qjis the upper bound of land allocated to each Xsnj agro-forest activity, and A is a matrix of the productivity coefficients for each agro-forestry activity, respectively.
Equation (1) represents a utility function, which comprises the total expected income less the expected risk. The expected income is calculated as the weighted farm income, considering the different states of nature and the respective probability of occurrence. The expected risk is the resulting total absolute deviation of farm income, in all states of nature, scaled by a coefficient of risk aversion, which
represents the marginal rate for replacing a given production plan by other riskier. This procedure of considering risk in the objective function allows the trade-off problem between income and risk in a multi-criteria framework to be solved.
The objective function is subject to the set of constraints (3) and (4) established per state of nature. The former is associated with the allocation of activities according to the different biophysical and historical restrictions and the latter with the agro-forest and livestock production for sale or in farm use. Farm income per state of nature is calculated in Equation (2).
Significant questions still remain, such as: (1) How can we integrate risk? (2) How should the states of nature be considered?
3.2. Fire Damage
Fire damage is calculated according to the methodological approach proposed by [16], which considers two main components: the hazard indicator and the potential damage. These are structural indicators of fire risk.
This approach is used by all Portuguese municipalities, and the authors of [67] state that despite some questions about its operational application in the field, this approach is able to properly differentiate the actual loss for different elements that have the same vulnerability.
Thus, the expected total damage map shows the reader the potential loss of each charted place, and its value is calculated as follows:
DTsn= FRsn×DPsn (5)
where, FRsnand DPsnare the fire hazard and the potential damage in each state of nature sn, and result from the sum of the values of all biophysical units, with different land uses and characteristics. The calculation is explained and presented in detail next.
The hazard indicator reflects the product of probability and susceptibility, sometimes called the fire risk. Hazard is the probability of occurrence in a given period of time and within a given area, of a potentially damaging phenomenon or a potentially damaging event that may cause loss or economic interference or environmental degradation [16]. The Forest Fire Hazard Map shows a territory’s potential for fire occurrence and this territory’s suitability for a preventive action [16,68].
This is the hazard indicator chosen since it may represent the territorial susceptibility to forest fires. Thus, considering the territory is composed of several different biophysical units (different soils and slopes) the hazard indicator, in each state of nature sn, for a given biophysical unit b (FRb) was calculated as [68]: FRb= ∑b Xbjrbb ∑bX j b
+EXPb+Vb+DECb+POPb (6)
where Xbj is a variable that represents the area of j agro-forest activity (forest, permanent and temporary crops and livestock) under each production technology and each farm type, in biophysical unit b;rbbare the technical coefficients used to calculate the fire risk indices; and EXP, V, DEC, POP are exogenous structural fire risk parameters related to the aspect, roads network, slopes and population density respectively;
The contributions of the various indicators/parameters to the hazard indicator are presented in the next table (Table1).
The hazard indicator is classified according to [70] as: class I–Low (1–103); class II–Moderate-Low (103–301); class III–Moderate (301–538); class IV–High (538–702); class V–Very high (702–1000).
Although the hazard indicator is a structural indicator, for the same location its value is different depending on the land use.
Forests 2017, 8, 270 8 of 20
Table 1.Criteria used to build the Fire hazard (FR) indicator.
Indicator Different Contributions of Each Element Contribution to the Hazard Indicator— Maximum Value of the Criteria Land Uses Different contributions of each land use
(according to a defined hazard level 1–7) 590 Aspect Different contributions according to
orientation (to south maximum values) 60 Slope The higher the slope, the higher
the contribution 210
Roads
Proximity to the
road network Defined according to proximity 90 Density of agricultural
and forestry pathways Defined according to density
Demographic density Value of the indicator 50 Source: Fire Risk Cartography (CRIF) and [69].
The second main component for calculating the expected fire damage is the potential damage resulting from the combination of vulnerability and economic value. For each state of nature sn, it is calculated as the product of economic value by vulnerability:
DPb,j = VRb,j × EVb,j (7)
where VRb,jis the vulnerability of activity j in biophysical unit b; EVb,jis the economic value of activity j in biophysical unit b. As a result, DPb,jis the potential damage for activity j in biophysical unit b.
Vulnerability expresses the degree to which an element is exposed to risk and designates its resilience to the phenomenon and recovery after it. Vulnerability is analysed on a scale of zero (0) to one (1), where zero (0) means the element is resistant to the phenomenon (no damage occurrence) and one (1) means the element is completely destroyed [16,68].
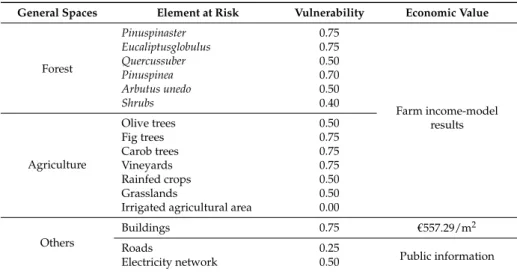
Vulnerability indicators were defined by analysing several Municipal Plans for Defence Against Fires (MPDAF) and consulting [16]. The National Forests authority provides in its guideline [16] several standard values for Portugal, regarding the several land uses, which are the main reference to define the municipal vulnerability values in more than 300 Portuguese municipalities. For constructing the vulnerability indicators, each municipality carries out an analysis using a team of experts and information of the area available in their databases. Table 2 shows the default values regarding vulnerability and economic value, based on Agriculture Economic Accounts, municipalities’ information and public information.
Table 2.Vulnerability indicators to be considered in the Forest Intervention Zone (FIZ).
General Spaces Element at Risk Vulnerability Economic Value
Forest Pinuspinaster 0.75 Farm income-model results Eucaliptusglobulus 0.75 Quercussuber 0.50 Pinuspinea 0.70 Arbutus unedo 0.50 Shrubs 0.40 Agriculture Olive trees 0.50 Fig trees 0.75 Carob trees 0.75 Vineyards 0.75 Rainfed crops 0.50 Grasslands 0.50
Irrigated agricultural area 0.00 Others
Buildings 0.75 €557.29/m2
Roads 0.25
Public information Electricity network 0.50
The economic value in euros allows calculation of the investment required to restore an element, or in our case the revenue lost due to forest fires.
Thus, the expected total damage combines the hazard components with the potential damage to indicate the potential loss due to the phenomenon. This means the expected total damage, or risk, depends on the hazard, vulnerability and economic value, and if any of the three risk factors changes, then the risk will change too.
3.3. Climatic Variability and States of Nature
In the case of Mediterranean forests, there is a marked annual climate variability that determines the risk of different potential damage. Under these conditions, the stochastic programming model is clearly superior to deterministic approaches.
Stochastic programming allows adaptive decisions to address the stochastic events and therefore may represent a more realistic and flexible way to take into account the impact of possible severe adverse events [16]. Stochastic models are still very useful to analyse income variability as a result of uncertain resource availability and the adjustment of input–output coefficients [19]. In Portugal, there are several examples of these models [71,72].
Decisions on planning and management of agriculture and forestry require the use of several decision points. For this reason, the discrete stochastic programming approach is particularly suited to this type of planning and management problem. As represented in decision trees, these problems tend to have many ramifications. Thus, to solve them using discrete stochastic programming, it is often necessary to restrict the number of sequential decision states and limit the number of events or states of nature in each of them.
The stochastic approach implies the definition of states of nature according to the favourable period for the occurrence of fires (over a historical sequence of 30 years’ data), classifying the types of years according to the risk index for forest fire progression (IRFFPLL), given the conditions for the outbreak of forest fires and the conditions that favour the spread [73,74]:
IRFFPLL = T U+
V
100 (8)
where T is the air temperature in◦C; U is the relative humidity in%; V is the wind speed in km/h, when its course is between quadrants 350–360◦and 0–180◦. This indicator can be simplified in a deflagration index eliminating the wind component and may also be used to identify the days when forest fires tend to occur by relating the maximum temperature and the minimum relative humidity (IRMAXLL):
IRMAXLL= Tmax
Umin (9)
To define the types of years corresponding to states of nature, an average daily risk of fire (using the IRMAX and adapted IRMAX, for which there is a more complete series), for the fire season, is considered and transformed in values from the qualitative scale proposed by the authors of [73]. This scale considers the following five degrees of risk: (1) reduced risk (0 to 0.49); (2) moderate risk (0.5 to 0.99); (3) high risk (1 to 1.49); (4) very high risk (1.50 to 1.99); (5) maximum risk (>1.99). Then, an empirical analysis of these results is carried out, for adjustments in the states of nature to be considered. Several steps followed, including: (1) Implementation of the indicators; (2) Empirical analysis and comparison with other climatic variables; (3) Validation, by comparing with burnt areas in each year. This leads to the identification of three states of nature [23].
Having defined types of years, it is essential to relate them with potential damage. This was done by determining allocation coefficients cesnwith the use of cartographical information on land use, burnt area and propagation and outbreak of fires [73] for each year individually. The coefficients are calculated using historical information of land use and burnt areas over a 20-year period for which
Forests 2017, 8, 270 10 of 20
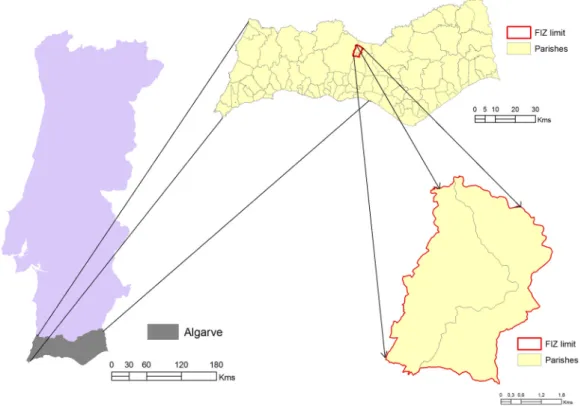
information is available. Therefore, a coefficient by sn, i.e., cesn, considering the average or maximum values of the various burnt land uses by state of nature is built. Thus, Equation (7) can be rewritten as: DPsn,bj =VRjsn,b × EVsn,bj × ceasn (10) This stochastic approach was tested in a Forest Intervention Zone (FIZ) in the Algarve, southern Portugal, which is a delimitated area with common management, composed mainly of forest spaces, and subject to a forest management plan and a specific plan of forest intervention [69]. This FIZ has management problems associated with the integration of agricultural, forestry and livestock breeding activities and is located in the inland Algarve in a demographically declining area [75]. Figure1
presents the location of the FIZ selected for this study in the context of Portugal and of the Algarve region (the grey piece in the map and the first yellow map).
Forests 2017, 8, 270 10 of 20 information is available. Therefore, a coefficient by sn, i.e., , considering the average or maximum values of the various burnt land uses by state of nature is built. Thus, Equation (7) can be rewritten as: , , , (10) This stochastic approach was tested in a Forest Intervention Zone (FIZ) in the Algarve, southern Portugal, which is a delimitated area with common management, composed mainly of forest spaces, and subject to a forest management plan and a specific plan of forest intervention [69]. This FIZ has management problems associated with the integration of agricultural, forestry and livestock breeding activities and is located in the inland Algarve in a demographically declining area [75]. Figure 1 presents the location of the FIZ selected for this study in the context of Portugal and of the Algarve region (the grey piece in the map and the first yellow map).
Figure 1. The location of the selected FIZ.
For this FIZ, it was possible to identify and characterize the following three states of nature:
SN1—years with a moderate low risk (less than 0.8 IRMAXLL) and 53% of occurrence probability;
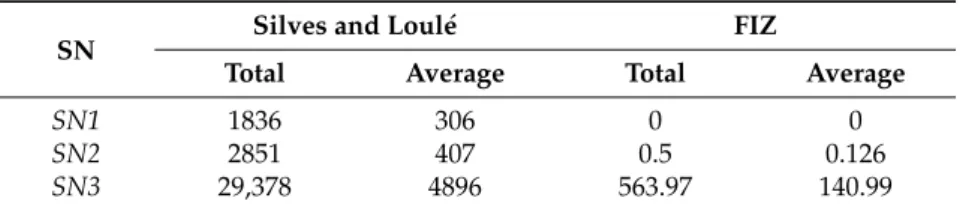
SN2—years with a moderate to high fire risk (IRMAXLL between 0.8 and 0.949) and 30% of occurrence probability; and SN3—years with a high risk of fire (IRMAXLL greater than or equal to 0.95) and 17% of occurrence probability. The establishment of these states of nature has been validated using information on the 1993 to 2010 burned areas in the Algarve region and in the municipalities of Loulé and Silves (where the FIZ is located) according to data from the National Statistics Institute (INE) [23]. A correlation coefficient for these municipalities of 0.56 was obtained. Also, a comparison of the burned area for the FIZ using data of the fire occurrences was done for the FIZ for a lower sequence of years (2001–2009). Table 3 presents the burnt area per state of nature for the municipalities and for the FIZ.
Figure 1.The location of the selected FIZ.
For this FIZ, it was possible to identify and characterize the following three states of nature: SN1—years with a moderate low risk (less than 0.8 IRMAXLL) and 53% of occurrence probability; SN2—years with a moderate to high fire risk (IRMAXLLbetween 0.8 and 0.949) and 30% of occurrence probability; and SN3—years with a high risk of fire (IRMAXLLgreater than or equal to 0.95) and 17% of occurrence probability.
The establishment of these states of nature has been validated using information on the 1993 to 2010 burned areas in the Algarve region and in the municipalities of Loulé and Silves (where the FIZ is located) according to data from the National Statistics Institute (INE) [23]. A correlation coefficient for these municipalities of 0.56 was obtained. Also, a comparison of the burned area for the FIZ using data of the fire occurrences was done for the FIZ for a lower sequence of years (2001–2009). Table3
Table 3.Total and average burnt area by state of nature (SN) (hectares).
SN Silves and Loulé FIZ
Total Average Total Average
SN1 1836 306 0 0
SN2 2851 407 0.5 0.126
SN3 29,378 4896 563.97 140.99
Source: National Statistics Institute (INE), National Forestry Authority (NFA) and own elaboration.
The allocation coefficients are obtained by a yearly analysis from 1990 to 2009, using land use data and the burned area cartography as a basis, which has a lower resolution for the landscape homogeneous area in which the FIZ is located. Therefore, for the set of years corresponding to each state of nature, the burnt area per land use was calculated. The weight of the burned area for each land use was calculated. The final allocation coefficient is the average and the maximum weight of burned area per land use and state of nature. These final allocation coefficients represent the general situation for the average biophysical conditions of the FIZ.
3.4. Reduced Income Risk
One of the main interests of the proposed approach is the possibility of minimizing fire risk losses within states of nature (sn), since agro-forestry producers generally have an attitude of risk aversion. In this model, minimizing the “risk of fire” (total damage) is a critical aspect. A review on the use of various risk assessment methods in mathematical programming models applied to agriculture are presented in [63].
The mean-variance model [76], the most common risk model, assumes that preferences rely on the expected yield (E) and the respective variance (V). The EV decision rule assumes a quadratic utility function, which was hard to compute [66]. Thus, various approaches were developed using linear programming [18].
The MOTAD model was presented by the authors of [66]. In this model, the quadratic programming restriction is replaced by a constraint in the mean absolute deviation. The advantage of this approach is that it can be developed as a linear expression and can be solved using only linear programming models.
This formulation allows calculation of the efficient income/risk threshold. The model generates an income/risk frontier that comes close to the expected value/variance boundary, but is slightly less likely to contain the solution that maximizes the expected utility [19]. In the absence of a real utility function, the final business plan selection should be left to the farmer [66].
Other developments occurred: models that integrate a predominant perspective of security [63] such as that proposed by the authors of [77] who presented the Target MOTAD introducing a restriction in performance variances from a given target level. Others integrate multi-criteria techniques, such as a mean variance model based on the Target MOTAD formulations [78]; an approach in which risk is considered a multi-criteria approach [79]; and an approach based on compromise programming [80]. The approach selected was the MOTAD [66], considering that it can be further integrated in a multi-criteria framework which uses the total absolute deviation as a linear estimator of variance and allows calculation of a Risk/Income efficient frontier using linear programming [19,23,71].
In our approach, the income risk is measured by the total absolute income deviation (RSK), which is scaled by a coefficient of risk aversion θ in the objective function (1). Thus, the RSK variable is endogenous in the model and its calculation is as follows:
Esn−E+Nsn≥0 (11)
RSK=
∑
snForests 2017, 8, 270 12 of 20
where Nsnare endogenous variables that account for the negative deviations of farm income in each state of nature (Esn) from its average expected value E.
4. Results and Discussion
Model results were obtained considering two alternative scenarios for the allocation coefficient used to calculate potential damage (DP). The first scenario (Ace) regards the average value of this allocation coefficient, and the second scenario (Mce) considers the maximum value that this allocation coefficient can take.
For both scenarios, the model was run considering first the maximization of expected farm income as the optimization criterion (Model 1) and then the minimization of risk as the optimization criterion (Model 2).
Thus, the results were analysed in terms of farm income, risk, fire damage and hazard indicator. In this analysis, it is important not only to show the expected figures, but also the values of variables that are obtained in each state of nature.
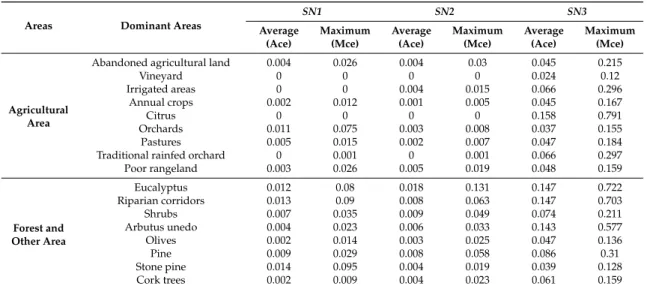
As stated before, allocation values for each state of nature were calculated using cartographical information on land use, burnt area and propagation and outbreak of fires. Table4presents the final allocation coefficients for the two scenarios considered (Ace and Mce).
Table 4.Allocation coefficients for each state of nature (Ace and Mce scenarios).
Areas Dominant Areas
SN1 SN2 SN3 Average (Ace) Maximum (Mce) Average (Ace) Maximum (Mce) Average (Ace) Maximum (Mce) Agricultural Area
Abandoned agricultural land 0.004 0.026 0.004 0.03 0.045 0.215
Vineyard 0 0 0 0 0.024 0.12 Irrigated areas 0 0 0.004 0.015 0.066 0.296 Annual crops 0.002 0.012 0.001 0.005 0.045 0.167 Citrus 0 0 0 0 0.158 0.791 Orchards 0.011 0.075 0.003 0.008 0.037 0.155 Pastures 0.005 0.015 0.002 0.007 0.047 0.184
Traditional rainfed orchard 0 0.001 0 0.001 0.066 0.297 Poor rangeland 0.003 0.026 0.005 0.019 0.048 0.159 Forest and Other Area Eucalyptus 0.012 0.08 0.018 0.131 0.147 0.722 Riparian corridors 0.013 0.09 0.008 0.063 0.147 0.703 Shrubs 0.007 0.035 0.009 0.049 0.074 0.211 Arbutus unedo 0.004 0.023 0.006 0.033 0.143 0.577 Olives 0.002 0.014 0.003 0.025 0.047 0.136 Pine 0.009 0.029 0.008 0.058 0.086 0.31 Stone pine 0.014 0.095 0.004 0.019 0.039 0.128 Cork trees 0.002 0.009 0.004 0.023 0.061 0.159
Source: Instituto da Água (INAG) and own elaboration.
In scenario Ace, the average value of allocation coefficients is 0.005176 in state SN1, 0.004647 in state SN2 and 0.07529 in state SN3. As expected, the average value of allocation coefficients is higher in state of nature SN3. In scenario Mce, the allocation coefficients are generally larger than in scenario Ace, but are less scattered.
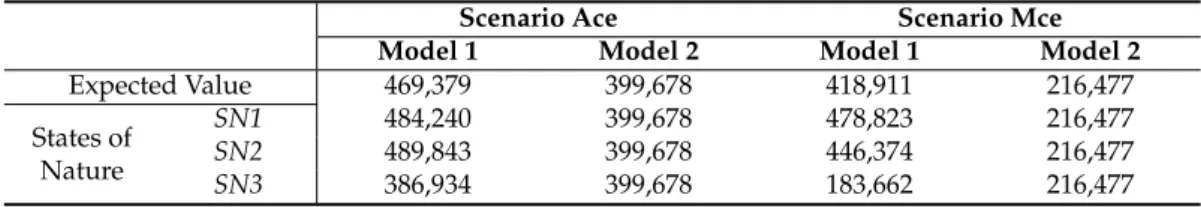
Table5presents the expected and stochastic farm income by state of nature obtained under scenarios Ace and Mce for Model 1 and Model 2.
Table 5.Expected and stochastic farm income (Euros).
Scenario Ace Scenario Mce
Model 1 Model 2 Model 1 Model 2
Expected Value 469,379 399,678 418,911 216,477 States of Nature SN1 484,240 399,678 478,823 216,477 SN2 489,843 399,678 446,374 216,477 SN3 386,934 399,678 183,662 216,477
Source: model results.
In scenario Ace, the expected farm income is€469,379 in model 1. However, due to fire risk, this result can be higher or lower according to the pay-off of each state of nature.
In state of nature SN1, farm income is€484,240, which represents 3% more than the expected value. This state of nature has a moderate low fire risk, average relative humidity for the fire season being 70% and average temperature (from May to October) 21.2◦C. The fire season also presents 4.1 dry months, an average monthly rainfall of 33 mm and the months preceding the time of fires are very dry.
In state of nature SN2, farm income (€484,240) is higher than the expected value by more than 4%. In this case, fire risk conditions are less favourable than in state SN1, since average relative humidity is 60%, average temperature from May to October is 21.3◦C, average rainfall in these months is 29.4 mm and during the critical period of fires 4.2 dry months were recorded. Moreover, in some years, there is a dry period preceding the critical fire season. However, due to the damage allocation coefficient, farm income is greater than in state SN1.
State of nature SN3 presents the lowest farm income, which is 17.6% smaller than the expected value and is 20% less than farm income in state SN1 and state SN2. These worst results are related to the riskier conditions of state SN3. This state is characterized by over 50 days of high fire risk. Average relative humidity is 55.7%, average monthly temperature from May to October is 21.6◦C and average total monthly precipitation for these months is 28.6 mm.
In scenario Ace in model 2, instead of maximizing farm income, the objective is the minimization of fire risk. In this case, the expected farm income drops to€399,678, that is, almost 15% less than in model 1. Here, farm income does not vary according to the state of nature considered and is equal to its expected value. Please note that when minimizing fire risk, the model will allocate more inputs, in cleaning and other fire prevention activities which have influences on the amount of shrubs, thus leading to a lower fire risk. It is the cost of these cleaning and fire prevention activities that lead to a lower farm income, but that also lead to a null economical variability of income among states of nature (i.e., a stable income). Thus, it represents 17.5% and 18.5% less than the farm income obtained in model 1 for states SN1 and SN3. In state of nature SN3, the farm income of model 2 is 3.3% more favourable than in model 1.
In scenario Mce, model 1 presents a farm income of€418,911. This value is 14% and 6.6% greater than that in states SN1 and SN2. However, in state SN3, where fire risk is the highest, farm income only attains 56% of its expected value (€183,662). These results are above those obtained with model 1 under scenario Ace. The expected farm income is 10% less and stochastic values vary between 1.1% less in state SN1 and 52% less in state SN3.
Thus, farm income considers the damage caused by fire and its variability is due to the different expected fire damage in the states of nature. For both scenarios considered, farm income is higher in SN1 and SN2, while SN3 presents the lowest results because fire risk is more intense in this state of nature. Changes in damage allocation coefficients do not affect the distribution of risk consequences among states of nature. They only influence the amplitude of farm income.
As stated before, the expected damage greatly influences farm income and it is an indicator of the economic damage from fire that reflects actual and potential losses in the territory.
Table6shows the expected and stochastic values of fire damage obtained for model 1 under Ace and Mce scenarios.
Forests 2017, 8, 270 14 of 20
Table 6.Expected and stochastic fire damage for Model 1 (Euros).
Scenario Ace Scenario Mce
Expected Value 18,581 67,917
States of nature
SN1 915 4223
SN2 1185 44,654
SN3 104,236 307,513
Source: model results.
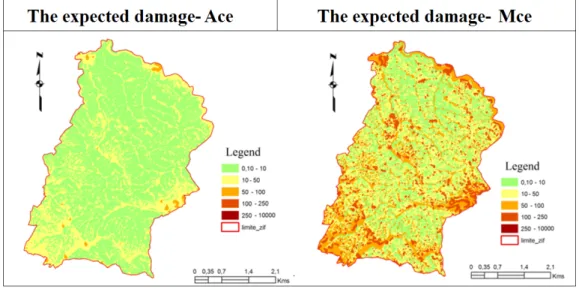
In scenario Ace, the expected value of fire damage is€18,581. Regarding distribution among states of nature, the damage indicator tends to be low in states SN1 and SN2 but it is high in state SN3. For instance, while the damage indicator represents only 5% and 6% of its expected value in states SN1 and SN2, it is more than five times greater in state SN3. In scenario Mce, as was expected, the fire damage indicator is higher than in scenario Ace. Its expected value is almost three times greater and the stochastic value in state SN3 is almost four times higher. Thus, it can be concluded that fire damage presents residual values in scenario Ace, being concentrated in state SN3. In scenario Mce, the damage is also concentrated in state SN3, but state SN2 presents considerably higher damage than state SN1. Figure2shows the average damage situation and Figure3shows damage distribution among states of nature.
The approach used for the hazard indicator allows consideration of different damage scenarios and results in a detailed analysis by land use, which may provide important guidelines for management.
Forests 2017, 8, 270 14 of 20
SN3. For instance, while the damage indicator represents only 5% and 6% of its expected value in
states SN1 and SN2, it is more than five times greater in state SN3. In scenario Mce, as was expected, the fire damage indicator is higher than in scenario Ace. Its expected value is almost three times greater and the stochastic value in state SN3 is almost four times higher. Thus, it can be concluded that fire damage presents residual values in scenario Ace, being concentrated in state SN3. In scenario Mce, the damage is also concentrated in state SN3, but state SN2 presents considerably higher damage than state SN1. Figure 2 shows the average damage situation and Figure 3 shows damage distribution among states of nature. The spatial distribution shows that the areas with higher values of expected fire damage tend to be urban areas. In scenario Ace, the areas with higher damage (50 to 100 euros/ha) are concentrated in specific places that may easily be controlled by introducing, for instance, firebreaks alongside built‐ up areas. In order to prevent a worse scenario, such as that of Mce, damage will be more spread out and a more detailed strategy, such as a detailed set of prevention measures, is needed. In Figure 3, we can observe that allocation of the damage does not depend on the state of nature. Moreover, we can conclude that in both scenarios (Ace and Mce), SN1 presents a similar distribution of damage among the biophysical units. There is a concentration of damage in urban areas, due to their value, but also in areas with high slopes that are difficult to access.
Figure 2. Spatial distribution of the expected damage (€) for both scenarios, Ace and Mce (source: model results).
Figure 2. Spatial distribution of the expected damage (€) for both scenarios, Ace and Mce (source: model results).
The spatial distribution shows that the areas with higher values of expected fire damage tend to be urban areas. In scenario Ace, the areas with higher damage (50 to 100 euros/ha) are concentrated in specific places that may easily be controlled by introducing, for instance, firebreaks alongside built-up areas. In order to prevent a worse scenario, such as that of Mce, damage will be more spread out and a more detailed strategy, such as a detailed set of prevention measures, is needed.
In Figure3, we can observe that allocation of the damage does not depend on the state of nature. Moreover, we can conclude that in both scenarios (Ace and Mce), SN1 presents a similar distribution of damage among the biophysical units. There is a concentration of damage in urban areas, due to their value, but also in areas with high slopes that are difficult to access.
As stated before, fire damage greatly depends on the hazard indicator, which allows guiding preventive interventions in the most susceptible areas. The average value was 579 in scenario Ace and 559 in scenario Mce, which means great danger according to the CRIF methodology classification.
Figure 3. Expected damage per hectare by biophysical unit for Ace and Mce (€) (source: model results).
As stated before, fire damage greatly depends on the hazard indicator, which allows guiding preventive interventions in the most susceptible areas. The average value was 579 in scenario Ace and 559 in scenario Mce, which means great danger according to the CRIF methodology classification. The hazard indicator does not show relevant differences among states of nature, given its structural nature and the residual nature of annual activities in this FIZ. Although the slight differences computed are not significant, they show that the model is sensitive to changes in the annual activities which may influence the hazard indicator.
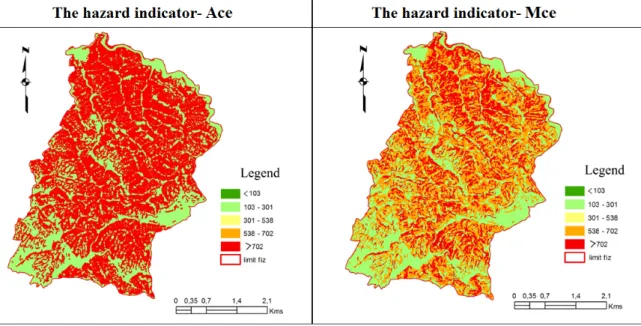
The average distribution of the hazard indicator in biophysical units is represented in Figure 4. In scenario Mce, the fire hazard is reduced in the areas with steeper slopes, due to the fire hazard strategies adopted, with a consequent reduction in expected damage.
The approach used for the hazard indicator allows consideration of different damage scenarios and results in a detailed analysis by land use, which may provide important guidelines for management.
Figure 3.Expected damage per hectare by biophysical unit for Ace and Mce (€) (source: model results). The hazard indicator does not show relevant differences among states of nature, given its structural nature and the residual nature of annual activities in this FIZ. Although the slight differences computed are not significant, they show that the model is sensitive to changes in the annual activities which may influence the hazard indicator.
The average distribution of the hazard indicator in biophysical units is represented in Figure4. In scenario Mce, the fire hazard is reduced in the areas with steeper slopes, due to the fire hazard strategies adopted, with a consequent reduction in expected damage.
Forests 2017, 8, 270 16 of 20 Forests 2017, 8, 270 16 of 20
Figure 4. Spatial distribution of the hazard indicator (hazard units) for both scenarios, Ace and Mce (source: model results). 5. Conclusions An integrated approach to including fire damage and risk of economic losses due to forest fires in a sustainable forest management model is presented in this paper. The approach proposed is based on a stochastic programming model that allows endogenous incorporation of fire risk in the decision‐making process. This is a sustainable forest management model where the decision‐making process considers the maximization of farm income and minimization of economic risk simultaneously. Farm income is obtained for different states of nature which are related to different fire risk conditions and hence fire damages and economic losses. Farm income is weighted according to the probability of occurrence of the states of nature of fire risk. For fire risk, a MOTAD structure was considered, to minimize the effect of fire damage on farm income variability. Thus, the model allows the decision‐making process to incorporate different paths representing different fire risk conditions and hence different responses by forest management.
Moreover, the model developed for the approach proposed considers all territorial land uses and the main factors that determine fire risk simultaneously (climatic and structural) in an integrated approach.
The results showed that the model is sensitive to the different components of total damage, giving important insights into sustainable forest management.
Several models in the literature provide manifold indicators to assess fire risk, but not in an integrated and holistic way that allows the decision‐making process to incorporate the effect of all land uses, as well as fire risk conditions. The calculation of fire damage and its integration in a forest management model is an important innovation that allows the definition of the best management strategy. This definition is enabled by risk considerations—considering different states of nature of fire damage and scenarios of damage allocation—which is also important for management.
Finally, this approach is also important to help design forest management policies. The integration of risks and technical considerations is also an important point and may be an added value for policy‐making. The question is how to value this information with that purpose? The information provided by this approach has spatial references and allows development strategies in specific sites. Moreover, the damage calculated may be of great value for defining firebreaks and community management. This gathered information may be used to improve policy measures, leading to better fire‐fighting strategies.
Figure 4.Spatial distribution of the hazard indicator (hazard units) for both scenarios, Ace and Mce (source: model results).
5. Conclusions
An integrated approach to including fire damage and risk of economic losses due to forest fires in a sustainable forest management model is presented in this paper.
The approach proposed is based on a stochastic programming model that allows endogenous incorporation of fire risk in the decision-making process. This is a sustainable forest management model where the decision-making process considers the maximization of farm income and minimization of economic risk simultaneously. Farm income is obtained for different states of nature which are related to different fire risk conditions and hence fire damages and economic losses. Farm income is weighted according to the probability of occurrence of the states of nature of fire risk. For fire risk, a MOTAD structure was considered, to minimize the effect of fire damage on farm income variability. Thus, the model allows the decision-making process to incorporate different paths representing different fire risk conditions and hence different responses by forest management.
Moreover, the model developed for the approach proposed considers all territorial land uses and the main factors that determine fire risk simultaneously (climatic and structural) in an integrated approach.
The results showed that the model is sensitive to the different components of total damage, giving important insights into sustainable forest management.
Several models in the literature provide manifold indicators to assess fire risk, but not in an integrated and holistic way that allows the decision-making process to incorporate the effect of all land uses, as well as fire risk conditions.
The calculation of fire damage and its integration in a forest management model is an important innovation that allows the definition of the best management strategy. This definition is enabled by risk considerations—considering different states of nature of fire damage and scenarios of damage allocation—which is also important for management.
Finally, this approach is also important to help design forest management policies. The integration of risks and technical considerations is also an important point and may be an added value for policy-making. The question is how to value this information with that purpose? The information provided by this approach has spatial references and allows development strategies in specific sites. Moreover, the damage calculated may be of great value for defining firebreaks and community
management. This gathered information may be used to improve policy measures, leading to better fire-fighting strategies.
Acknowledgments:The authors are pleased to acknowledge financial support from Fundação para a Ciência e a Tecnologia (grant UID/ECO/04007/2013) and FEDER/COMPETE (POCI-01-0145-FEDER-007659).
Author Contributions:Maria B. Freitas coordinated the study, the bibliographic revision and the development of the approach; António Xavier, conducted part of the bibliographic revision, developed the model and implemented the approach; Rui Fragoso helped designing the mathematical formulation, the bibliographic revision, and reviewed the paper.
Conflicts of Interest:The authors declare no conflict of interest. The founding sponsors had no role in the design of the study; in the collection, analyses, or interpretation of data; in the writing of the manuscript, and in the decision to publish the results.
References
1. Scarascia-Mugnozza, G.; Oswald, H.; Piussi, P.; Radoglou, K. Forests of the Mediterranean region: Gaps in knowledge and research needs. For. Ecol. Manag. 2000, 132, 97–109. [CrossRef]
2. Falcão, A.; Borges, J. Designing decision support tools for Mediterranean forest ecosystems management: A case study in Portugal. Ann. For. Sci. 2005, 62, 751–760. [CrossRef]
3. Fady-Welterlen, B. Is there really more biodiversity in Mediterranean forest ecosystems. Taxon 2005, 54, 905–910. [CrossRef]
4. Palahi, M.; Mavsar, R.; Gracia, C.; Birot, Y. Mediterranean forests under focus. Int. For. Rev. 2008, 10, 676–688. [CrossRef]
5. Lourenço, L. Impacte ambiental dos incêndios florestais Comunicação apresentada na III Semana de Geografia Física. Cadernos Geografia 1990, 9, 143–150. [CrossRef]
6. Ferreira, L. Desenvolvimento de Modelos de Optimização da Gestão Florestal em Situações de Risco de Incêndio. Ph.D. Thesis, Departamento de Estatística e Investigação Operacional, Faculdade de Ciências, Universidade de Lisboa, Lisboa, Portugal, 2011.
7. Verde, J.; Zêzere, J.L. Avaliação da Perigosidade de Incêndio Florestal. In Proceedings of the VI Congresso da Geografia Portuguesa, Lisboa, Portugal, 17–20 October 2007; pp. 1–23.
8. Wang, S.; Wilson, B. Pluralism in the economics of sustainable forest management. For. Policy Econ. 2007, 9, 743–750. [CrossRef]
9. Moreno, J. Wildland Fires Impacts: A State of the Art.; Deliverable D-04-03, Euro-Mediterranean Wildland Fire Laboratory (EUFIRELAB). 2004. Available online:http://www.eufirelab.org/prive/directory/units_ section_4/D-04-03/D-04-03.pdf(accessed on 24 May 2014).
10. Ricardo, A. Modelação da Probabilidade de Ocorrência de Incêndio em Povoamentos Florestais de Portugal Continental. Master’s Dissertation, Instituto Superior de Agronomia, Lisboa, Portugal, 2010.
11. Bugalho, L.; Pessanha, L. The forest fire risk index (ICRIF) Operational Processing and Validation. In Proceedings of the 4th International Wildland Fire Conference, Seville, Spain, 13–17 May 2007.
12. Raunikar, R.; Buongiorno, J. Chapter 24-Forestry Economics. Historical Background and Current Issues. In Handbook of Operations Research in Natural Resources; Weintraub, A., Romero, C., Bjorndal, T., Epstein, R., Eds.; International Series in Operations Research and Management Science; Springer: New York, NY, USA, 2007; ISBN 978-0-387-71814-9.
13. Chuvieco, E. Application of Remote Sensing and Geographic Information Systems to Forest Fire Hazard Mapping. Remote Sens. Environ. 1989, 29, 147–159. [CrossRef]
14. Caetano, M.; Carrão, H.; Freire, S. Fire Risk Maps Methodology; PREMFIREWP-330 Report Product; Instituto Geográfico Português: Lisbon, Portugal, 2002.
15. Instituto Geográfico Português-IGEO. Cartografia de Risco de Incêndio Florestal Relatório do Distrito de Santarém; Ministério do Ambiente, do Ordenamento do Território e do Desenvolvimento Regional, Direcção de Serviços de Investigação e Gestão de Informação Geográfica: Lisbon, Portugal, 2008.
16. Direcção-Geral dos Recursos Florestais-DGRF. Guia Técnico para Elaboração do Plano Municipal de Defesa da Floresta Contra Incêndios; Direcção-Geral dos Recursos Florestais: Lisbon, Portugal, 2007.
17. Bergonse, R.; Bidarra, J. Probabilidade bayesiana e regressão logística na avaliação da susceptibilidade de ocorrência de incêndios de grande magnitude. Finisterra 2010, 89, 79–104. [CrossRef]
Forests 2017, 8, 270 18 of 20
18. McCarl, B.; Spreen, T. Applied Mathematical Programming Using Algebraic Systems; Texas A&M University: College Station, TX, USA, 1997; Available online:http://agecon2.tamu.edu/people/faculty/mccarl-bruce/ mccspr/thebook.pdf(accessed on 10 September 2012).
19. Hardaker, J.; Huirne, R.; Anderson, J. Copying with Risk in Agriculture; Centre for Agricultural Bioscience International: Guilford, CT, USA, 2008; ISBN 0851998313.
20. Amraoui, M.; Pereira, M.G.; DaCamara, C.C.; Calado, T.J. Atmospheric conditions associated with extreme fire activity in the Western Mediterranean region. Sci. Total Environ. 2015, 524, 32–39. [CrossRef] [PubMed] 21. Pereira, M.G.; Trigo, R.M.; da Camara, C.C.; Pereira, J.M.; Leite, S.M. Synoptic patterns associated with large
summer forest fires in Portugal. Agric. For. Meteorol. 2005, 129, 11–25. [CrossRef]
22. Westerling, A.; Bryant, B. Climate change and wildfire in California. Clim. Chang. 2008, 87, S231–S249. [CrossRef]
23. Xavier, A.; Costa Freitas, M.B.; Fragoso, R. Management of Mediterranean forests—A compromise programming approach considering different stakeholders and different objectives. For. Policy Econ. 2015, 57, 38–46. [CrossRef]
24. Piñol, J.; Terradas, J.; Lloret, F. Climate warming, wildfire hazard, and wildfire occurrence in coastal eastern Spain. Clim. Chang. 1998, 38, 345–357. [CrossRef]
25. Moriondo, M.; Good, P.; Durão, R.; Bindi, M.; Giannakopoulos, C.; Corte-Real, J. Potential impact of climate change on fire risk in the Mediterranean area. Clim. Res. 2006, 31, 85–95. [CrossRef]
26. De Angelis, A.; Ricotta, C.; Conedera, M.; Pezzatti, G.B. Modelling the Meteorological Forest Fire Niche in Heterogeneous Pyrologic Conditions. PLoS ONE 2015, 10, e0116875. [CrossRef] [PubMed]
27. Ramos, C.; Ventura, J. Um índice climático de perigo de incêndio aplicado aos fogos florestais em Portugal. Finisterra 1992, 28, 53–54. [CrossRef]
28. Lourenço, L.; Gonçalves, B. As Situações Meteorológicas e a Eclosão-Propagação dos Grandes Incêndios Florestais Registados Durante 1989 no Centro de Portugal. In Proceedings of the Comunicações II Congresso Florestal Nacional, Porto, Portugal, 7–10 November 1990; pp. 755–763.
29. Lourenço, L.; Bernardino, S. Condições meteorológicas e ocorrências de incêndios florestais em Portugal Continental (1971–2010). Cadernos Geografia 2013, 32, 105–132. [CrossRef]
30. González, J.R.; Palahi, M.; Trasobares, A.; Pukkala, T. A fire probability model for forest stands in Catalonia (north-east Spain). Ann. For. Sci. 2006, 63, 169–176. [CrossRef]
31. Marzano, R.; Bovio, G.; Guglielmet, E.; Jappiot, M.; Jampin, C.; Dauriac, F.; Deshayes, M.; Salas, J.; Aguado, I.; Martinez, J.; et al. Common Methods For Mapping The Wildland Fire Danger; Deliverable D-08-05, Euro-Mediterranean Wildland Fire Laboratory (EUFIRELAB). 2005. Available online: http: //www.eufirelab.org/prive/directory/units_section_8/D-08-07/D-08-07.pdf(accessed on 24 May 2014). 32. Verde, J. Avaliação da Perigosidade de Incêndioflorestal. Master’s Dissertation, Arts Faculty, University of
Lisbon, Lisbon, Portugal, 2010.
33. Yakubu, I.; Mireku-Gyimah, D.; Duker, A. A Review of methods for modelling forest fire risk and hazard. Afr. J. Environ. Sci. Technol. 2015, 9, 155–165. [CrossRef]
34. Kushla, J.D.; Ripple, W.J. The Role of Terrain in a Fire Mosaic of a Temperate Coniferous Forest. For. Ecol. Manag. 1997, 95, 97–107. [CrossRef]
35. Pyne, S.J.; Andrews, P.L.; Laven, R.D. Introduction to Wildland Fire; John Wiley’s & Sons Inc.: New York, NY, USA, 1996; Volume 1, pp. 221–227.
36. Martínez-Fernández, J.; Chuvieco, E.; Koutsias, N. Modelling long-term fire occurrence factors in Spain by accounting for local variations with geographically weighted regression. Nat. Hazard Earth Syst. 2013, 13, 311–327. [CrossRef]
37. Chuvieco, E.; Justice, C. Relations between Human Factors and Global Fire Activity. In Advances in Earth Observation of Global Change; Chuvieco, E., Li, J., Yang, X., Eds.; Springer: Dordrecht, The Netherlands, 2010; pp. 187–199.
38. Caetano, M.; Carrão, H.; Freire, S. Selection of the Best Method for Fire Risk Map Production; PREMFIRE WP-320 Report Product; Instituto Geográfico Português: Lisbon, Portugal, 2002.
39. Chuvieco, E.; Aguado, I.; Jurdao, S.; Pettinari, M.L.; Yebra, M.; Salas, J.; Hantson, S.; de la Riva, J.; Ibarra, P.; Rodrigues, M.; et al. Integrating geospatial information into fire risk assessment. Int. J. Wildland Fire 2014, 23, 606–619. [CrossRef]