15th International Conference on Environmental Science and Technology Rhodes, Greece, 31 August to 2 September 2017
CEST2017_00623
Forage-SAFE: a tool to assess the management and economics
of wood pasture systems
García De Jalón S.
1,*, Graves A.
1, Moreno G.
2, Palma J.H.N.
3, Crous-Duran J.
3, Oliveira T.
3And Burgess
P.J.
11 Cranfield University, Cranfield, Bedfordshire, MK43 0AL, UK
2 Forestry School, INDEHESA. Universidad de Extremadura, Plasencia 10600, Spain 3
Technical University of Lisbon, Tapada da Ajuda, 1349-017 Lisboa, Portugal *corresponding author:
e-mail: s.garcia-de-jalon@cranfield.ac.uk
Abstract:
The Forage-SAFE model has been developed to better understand the impact of trees on the profitability of wood pastures. It assesses the daily balance between the demand for and production of forage to estimate an annual farm net margin. The model allows the modification of selected biophysical and financial parameters related to the tree, pasture and livestock components (such as tree cover density, carrying capacity and livestock species) which can be optimised to maximise net farm income. A case study in a dehesa wood pasture in South-western Spain was used to show the applicability of the model. The case study results showed that net margin was maximised at around 27% tree cover for a carrying capacity of 0.4 livestock unit per hectare from which 61% were ruminants and 39% Iberian pigs. The analysis also showed that high carrying capacities were positively correlated with tree cover profitability. This was accentuated as the proportion of Iberian pigs increased.
Keywords: Forage-SAFE, wood pasture, tree cover, bio-economic, profitability
1. Introduction
Wood pastures are silvopastoral agroforestry systems with irreplaceable ecological, social, and cultural values. They occupy around 20.3 million ha in the 27 EU member states, equivalent to around 4.7% of all European land (Plieninger et al., 2015). Wood pastures are complex systems where three agro-silvo-pastoral components can interact over time. This makes it difficult to evaluate the economic impact of management decisions on farm profitability. For instance, trees have the potential to increase on-farm fodder production for livestock e.g. Moreno and Pulido 2009; López-Díaz et al., 2016. However, measuring the economic impact or the marginal effect of trees on farm profitability based on observed data can be difficult and expensive. Thus modelling approaches are useful to identify optimal managerial decisions in wood pasture systems. The Forage-SAFE model was developed to provide a tool that can simulate the daily demand for and production of grasses and other forages to assess
annual profits in wood pastures. The aim in developing the model was to provide a better understanding of the economic impact of farm-management decisions of the tree, pasture and livestock components.
2. Methodological structure of Forage-SAFE
Forage-SAFE is a dynamic bio-economic model developed in Microsoft Excel. It contains some macros in Microsoft Visual Basic for Applications (VBA) to facilitate model usability and run various optimization problems.A total of 304 parameters can be set in Forage-SAFE to define the biophysical, managerial and economic characteristics of wood pasture systems. The biophysical characteristics included production data of pasture, fruit, timber, firewood and browse. The managerial characteristics included data related to the livestock (species, type, age, calendar, weight and consumption), the trees (planting, tree protection, pruning, thinning, cutting and browsing) and pasture and fodder crops (e.g., planting, fertilising, spraying, harvesting and baling). The economic variables included revenues (sale of livestock and tree products, and other services) and farm costs (variable, fixed, subcontracted labour and rented machinery, and unpaid labour).
Forage-SAFE includes seven spreadsheets:
i. Biophysical input data: this is the principal spreadsheet where end-users set biophysical and managerial variables. Annual results are shown in this sheet. It is divided into three parts: i) biophysical and managerial input data, ii) main annual results with button links to graphical results, and iii) estimation of „locally‟ optimal values of tree cover, carrying capacity and distribution of livestock species to maximise production and profitability.
ii. Financial input data: to insert financial data.
iii. Graphs: main graphical results provided at a daily resolution.
iv. Livestock demand: calculations of daily food and energy demanded by each livestock species (e.g., cows, sheep, pigs) and type (e.g., suckler cow, growing cow and male adult cow).
CEST2017_00623 v. Production NO TREE: calculations of the daily
production of pasture and duration of energy content in areas beyond the tree canopy.
vi. Production TREE: calculations of the daily production of pasture and duration of energy content in areas under the tree canopy. It also calculates browse and acorn production.
vii. Biophysical analysis: calculations of the daily balance between energy and food production and demand in the wood pasture.
3. Fodder and tree production
3.1. Energy from the pasture
The model calculated the energy produced from the pasture (MJ ha-1 d-1) as the product of pasture produced on day d (kg dry matter (DM) ha-1 d-1) and the energy content (MJ kg DM-1). The model calculated the daily balance between the produced and consumed pasture in order to quantify the pasture that was not consumed by the livestock and was available in subsequent days, updating the energy content each day. Equation 1 shows the discretised equation to measure the potential change of available energy from pasture (AEP) on day t (MJ ha-1 d-1):
d Pt
dt PPt* P+ Pt Eq.1
Where PPt is the pasture production in terms of dry weight (kg DM ha-1 d-1) on day t, ECP is the energy content in the pasture (MJ kg DM-1), and SEPt is the surplus energy from the accumulated pasture (MJ ha-1 d-1), i.e. pasture previously produced that has not been consumed.
The surplus of pasture was calculated on a daily basis as the difference between pasture production and consumption. Equation 2 shows how the model calculated the surplus of energy from accumulated pasture on day t (SEPt): ( ) ( ) ( ) ( ( )) Eq. 2
where SP is the surplus from pasture produced on day t (kg ha-1 d-1), and D is the pasture senescence coefficient which indicates the retention of energy content over time. As pasture senescence is affected by weather conditions D varies for each time instant. For example under extreme heat the retention of energy decreases more rapidly than at more normal temperatures. For instance, in arid Mediterranean climates the retention of energy content in summer is lower than in autumn. This is also affected by microclimatic conditions caused by the tree effect on pasture.
The model separately calculates the available energy from pasture in treeless areas and areas under tree canopy. Equation 1 shows how the available energy from pasture in treeless areas varies along time. In areas under the tree canopy, the available energy is similarly calculated but adds the effect of tree density on pasture growth (see Equation 3). The Gompertz equation was used to simulate the effect of tree density.
( ( ( ( )) )) Eq. 3 where AEPwtt is the available energy from pasture in areas under the tree canopy, PPwtt is the dry weight of pasture production, ECPwt is the energy content of the pasture, and SEPwtt is the surplus of energy from the accumulated pasture. The pasture production under tree canopy is multiplied by a value between 0 and 1 derived from a Gompertz equation where δ is the proportion of tree cover and b and C are constants. Finally the available energy from pasture in the system combining treeless areas and areas under tree canopies is calculated by Equation 4:
( ) Eq.4 where δ is the proportion of tree cover, AEPwot is the available energy from pasture in treeless areas and AEPwt is the vailable energy from pasture in areas under tree canopy.End-users need to insert daily grass production data. This can be modelled data from an agroforestry model (e.g. Yield-SAFE, van der Werf et al., 2007, Modelo Dehesa, Hernández Díaz-Hambrona et al., 2008; Iglesias et al., 2016, and SPUR2, Hanson et al., 1994) or real data.
3.2. Tree resources
Fruit and browse were included in the model as sources of food to feed the livestock. Daily fruit production was simulated by a normal probability distribution. The day of the year of highest production and the standard deviation in terms of number of days need to be inserted to simulate the daily fruit production. The produced energy from tree fruit was calculated as the product of the dry weight of fruit and the energy content per dry weight. Browse production was considered as a food supplement when pasture production did not meet the demand of the ruminants. Browse can be restricted for specific dates when pruning is allowed. Pruning costs associated with browsing can be considered in the analysis if required. Forage-SAFE also allows the inclusion of farm products that provide economic revenues such as timber, firewood, cork, wool and milk.
4. Livestock demand for fodder
The fodder demand by livestock was calculated for each livestock species (cattle, sheep and Iberian pigs) and type (growing, suckler and male adults). The model calculated the total energy demand on day t (DE; units: MJ ha-1 d-1) using Equation 5:
∑ ∑( )
CEST2017_00623 where nt,s,y is the number of animals per hectare of species
s of type y on day t, and det,s,y is the associated energy demand per animal species and type (MJ animal-1). Forage-SAFE included two distinct ways to calculate each animal‟s demand for energy. One way was by setting the consumption of each animal (DM kg animal-1) according to specific characteristics such as species, type, weight and physiological state (gestation, lactation and maintenance). The other way was to use the utilised metabolisable energy (UME) equation (Hodgson, 1990). The equation was calculated for a “reference animal” defined by Hodgson (1990) as a lactating dairy cow with a live weight (W) of 500 kg and milk yield (Y) of 10 kg d-1 (UME; units: MJ LU-1 d-1) and then converted into kilocalories. Equation 6 shows the UME equation used to calculate the demand of a lactating dairy cow per day:
Eq.6 Where Wt and Yt indicated the weight and milk yield respectively on day t.
5. Assessing the profitability of the wood pasture The daily comparison of energy produced by the pasture, browse and fruit in kilocalories (MJ) with the demanded energy from livestock was used to estimate how much supplementary food as forage, concentrates or acorns was needed to meet the livestock demand. Gross and net margins were used to assess farm profitability: Gross margin was defined as the revenue from any product and/or service of the wood pasture (e.g. animal sale, wool, milk, firewood and hunting) plus farming subsidies minus variable costs. Variable costs were separately measured for the livestock (animal purchase, forage and concentrates, veterinary and medicines, bedding and miscellaneous), the crop (seed and plants, fertiliser, crop protection, baling and other costs), and the tree (planting, tree protection, pruning, thinning, cutting and other costs (see Equation 7). Net margin was defined as the gross margin minus labour and rented machinery costs and other fixed costs (installation and repairs of infrastructure, fuel and energy, machinery, interest on working capital, and other costs) (see Equation 8).
6. Optimising managerial decisions
Forage-SAFE includes an optimisation solver to optimise managerial decisions in terms of maximum production, or gross or net margin. Thus Forage-SAFE can suggest what tree cover, carrying capacity and livestock species composition are optimal, assuming everything else is held constant. Forage-SAFE used the Generalized Reduced Gradient (GRG) algorithm of the nonlinear solving method as not all the equations of the model were linear. The GRG algorithm estimated a „locally‟ rather than „globally‟ optimal solution. Hence there was no other set of values for the decision variables close to the current values that yielded a better value for the objective function (maximise production or gross and net margin). The objective functions (Equations 7 and 8) used in Forage-SAFE to maximise annual gross margin (GM) and net margin (NM), respectively were: ∑ ∑ ∑ ∑ ∑ ∑ Eq.7 ∑ ∑ ∑ ∑ Eq.8
where PId,c is the revenue from sale products of the component c (livestock, tree and crop) on day t, SI is the revenue from subsidies, VC is the variable costs, SC is the labour and rented machinery costs, and FC is other fixed costs.
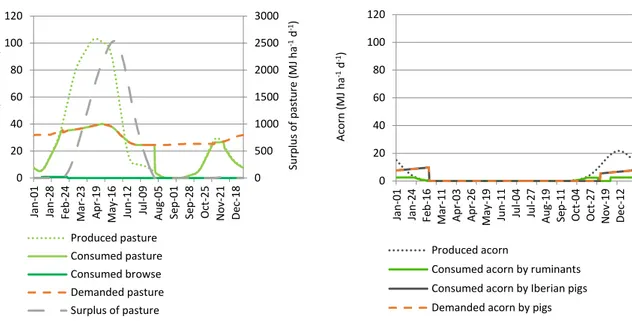
7. Results: an example in a dehesa wood pasture A case study in a dehesa in Extremadura, Spain was used to show the applicability of the model. Figure 1 shows the daily production, demand, consumption and surplus of pasture, browse and acorns in a modelled dehesa wood pasture. The left graph shows the daily energy balance for pasture and browse. Production was concentrated between February and early June and to a lesser extent between October and December. Likewise there was a surplus of pasture between March and July and from October to November. Overall, from early August to early October and from early December to late January the provision of food energy from the system did not meet the livestock demand. Thus farmers would need to use extra forage or concentrates to satisfy the livestock demand. From early June to late September pasture production was almost negligible. However during this period livestock did not need extra forage or concentrates until mid-August due to the surplus of pasture that was not consumed in the spring. During the spring, pasture production in treeless areas was higher than in areas under tree canopies. However, in early summer the retention of energy in the surplus pasture decreased faster in treeless areas than in areas under tree canopy. Thus when the pasture was dry with very low energy content in treeless areas, under the tree canopy the accumulated pasture was still fresh and provided a source of food for the livestock. This allowed an extension of the grazing period without external food. In a similar, but to a lesser extent, this also occurred in the winter when due to protection from frosts the pasture under the tree canopy also retained a higher energy content. Browse was also used to feed ruminants in late January and this met some of the energy demands. The right graph shows the production and consumption of acorns. Iberian pigs were in the field from November to February coinciding with the period of maximum fruit production. It was assumed that pigs would have priority over ruminants, i.e. they would only eat acorns if pigs had previously satisfied their demand for acorns. Thus most acorns were used to feed the Iberian pigs.
CEST2017_00623
(a) (b)
Figure 1. Produced (dotted lines), consumed (continuous lines), surplus (dashed and dotted line) and demanded (dashed lines) energy from pasture, browse and acorn in the dehesa case study at 0.37 LU ha-1 (39.9% sheep, 38.5% cattle and 21.6% Iberian pigs). Figure 1a shows the daily energy balance of pasture and browse, Figure 1b shows the energy balance of acorns.
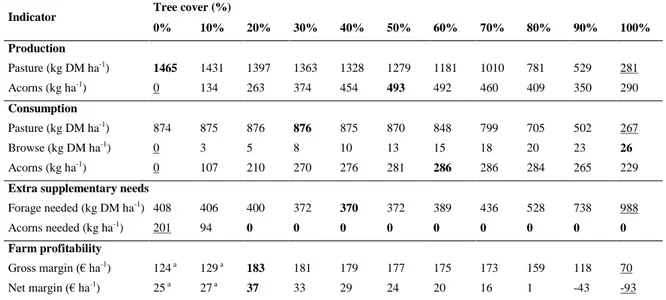
Table 1 shows the estimated annual food production, consumption and extra requirements of the modelled dehesa at a carrying capacity 0.37 LU ha-1 (39.9% sheep, 38.5% cattle and 21.6% Iberian pigs) under different tree cover densities. The first part of the table shows annual production pasture and acorn. Maximum annual pasture production was attained at 0% tree cover (1465 kg DM ha -1
), and then decreased as tree cover increased. Acorn production increased with increasing tree cover until 50% tree cover beyond which inter-tree competition decreased production. The maximum pasture consumption by livestock was reached at 30% percent tree cover (876 kg DM ha-1). Browse consumption increased as tree cover increased. The proportion of the energy that was in the pasture which was consumed ranged from 60% at no tree cover to 95% at full tree cover. This was mainly the low production at full tree cover and due to the energy content in the pasture under tree canopies lasted longer than in treeless areas. The lowest value of extra forage needed to meet livestock demand was 370 kg DM ha-1 in a dehesa with 40% tree cover and the highest value was 988 kg DM ha-1 at 100% tree cover. In a treeless dehesa the forage needed was 408 kg DM ha-1. Therefore a treeless dehesa needed 10.3% more forage than in a dehesa at 40% tree cover. The demand for acorns by Iberian pigs was met by ensuring that the tree cover was 20% or above. The highest gross and net margin (183 € ha-1 and 37 € ha-1 respectively) were achieved at 20% tree cover. Whilst the gross margin included the revenue from the trees it did not include the associated labour costs which were considered in the net margins (e.g. tree planting, pruning and cutting, see Equations 1-3). The estimated net margin at 0% and 10% tree cover negative. This indicated that at the specified
carrying capacity and livestock composition, the system without trees was not economically sustainable. For this reason, at 0% and 10% tree cover the Iberian pigs were replaced by ruminants in the analysis. Thus at 0% and 10% tree cover with only ruminants the net margin was 25 € ha -1 and 27 € ha-1 respectively.
8. Conclusions
This paper presents a bio-economic model that assesses the management and economics of wood pasture systems. A dehesa case study was selected to show the applicability of Forage-SAFE. The model quantified and compared on a daily time-step the energy demanded by livestock and the energy provided by the system. It was also used to calculate how much extra forage was needed to satisfy the livestock demand and the impact of this on system profitability. The results showed that trees in dehesas positively contribute to profitability until a certain density where the benefits start to be outweighed by the costs. Hence profitability was reduced by both too little and too much tree cover. Although annual pasture production was maximised at 0% tree cover, the combination of pasture, browse and acorns was maximised at a tree cover around 40%. In terms of profitability, the maximum net margin was reached at around 20% tree cover. The optimal tree density in terms of net margin increased as the proportion of Iberian pigs was increased. Hence in conclusion, a daily time-step modelling approach based on livestock demand for metabolisable energy and pasture production seems to be particularly valuable in quantifying the effect of trees in buffering the strong seasonality of pasture growth and in terms of assessing its effect on profitability.
0 500 1000 1500 2000 2500 3000 0 20 40 60 80 100 120 Jan -0 1 Jan -2 8 Fe b-24 M ar -2 3 A pr -19 M ay -1 6 Jun -12 Jul -09 A ug -05 Se p-01 Se p-28 O ct -25 N o v-21 D ec -18 Sur pl us o f pa st ur e (M J h a -1 d -1) P as tur e ( M J ha -1 d -1) Produced pasture Consumed pasture Consumed browse Demanded pasture Surplus of pasture 0 20 40 60 80 100 120 Jan -0 1 Jan -2 4 Fe b-16 M ar -1 1 A pr -03 A pr -26 M ay -1 9 Jun -11 Jul -04 Jul -27 A ug -19 Se p-11 O ct -04 O ct -27 N o v-19 D ec -12 A co rn (M J ha -1 d -1) Produced acorn
Consumed acorn by ruminants Consumed acorn by Iberian pigs Demanded acorn by pigs
CEST2017_00623
Table 1. Production, consumption, supplementary needs to satisfy livestock demand and farm profitability in the modelled dehesa (0.37 LU ha-1: 39.9% sheep, 38.5% cattle and 21.6% Iberian pigs). Bold and underlined figures indicate the best and worst values from a financial perspective.
(a) Only sheep and cows were considered in the analysis since acorn production did not meet the Iberian pigs demand.
Acknowledgements
We acknowledge support of the European Commission through the AGFORWARD FP7 research project (contract no. 613520).
References
Hanson, J.D., Baker, B.B., Bourdon, R.M. (1994). Documentation and users guide for SPUR2. GPSR Technical Report No. 1. USDA Agricultural Research Service, Great Plains Systems Research Unit, Ft. Collins, CO.
Hernández Díaz- mbrona, ., tienne, ., Martínez Valderrama, J. (2008) Producciones potenciales de herbáceas, de bellota y carga ganadera en las dehesas de Extremadura. Pastos, 38 (2), 243 – 258
Hodgson, J. G. (1990) Grazing management: Science into practice. Wiley
Iglesias, ., Báez, K., Diaz-Ambrona, C. H. (2016). Assessing drought risk in Mediterranean Dehesa grazing lands. Agricultural Systems, 149, 65-74.
López-Díaz, M. L., Rolo, V., Benítez, R., & Moreno, G. (2015). Shrub encroachment of Iberian dehesas: implications on total forage productivity. Agroforestry Systems, 89(4), 587-598.
Moreno, G., & Pulido, F. J. (2009). The functioning, management and persistence of dehesas. In Agroforestry in Europe (pp. 127-160). Springer Netherlands.
Plieninger, T., Hartel, T., Martín-López, B., Beaufoy, G., Bergmeier, E., Kirby, K., Montero, M.J., Moreno, G., Oteros-Rozas, E, Van Uytvanck, J. (2015) Wood-pastures of Europe: Geographic coverage, social–ecological values, conservation management, and policy implications. Biological Conservation 190, 70–79.
van der Werf, W., Keesman, K., Burgess, P., Graves, A., Pilbeam, D., Incoll, L.D., Metselaar, K., Mayus, M., Stappers, R., van Keulen, H., Palma, J. and Dupraz, C. (2007) Yield-SAFE: A parameter-sparse, process-based dynamic model for predicting resource capture, growth, and production in agroforestry systems. Ecological Engineering, 29(4), 419–433.
Indicator Tree cover (%)
0% 10% 20% 30% 40% 50% 60% 70% 80% 90% 100% Production Pasture (kg DM ha-1) 1465 1431 1397 1363 1328 1279 1181 1010 781 529 281 Acorns (kg ha-1) 0 134 263 374 454 493 492 460 409 350 290 Consumption Pasture (kg DM ha-1) 874 875 876 876 875 870 848 799 705 502 267 Browse (kg DM ha-1) 0 3 5 8 10 13 15 18 20 23 26 Acorns (kg ha-1) 0 107 210 270 276 281 286 286 284 265 229
Extra supplementary needs
Forage needed (kg DM ha-1) 408 406 400 372 370 372 389 436 528 738 988 Acorns needed (kg ha-1) 201 94 0 0 0 0 0 0 0 0 0 Farm profitability Gross margin (€ ha-1 ) 124 a 129 a 183 181 179 177 175 173 159 118 70 Net margin (€ ha-1) 25 a 27 a 37 33 29 24 20 16 1 -43 -93