PART ONE
Peritoneal Kinetics and
Anatomy
Advances in Peritoneal Dialysis, Vol. 20, 2004
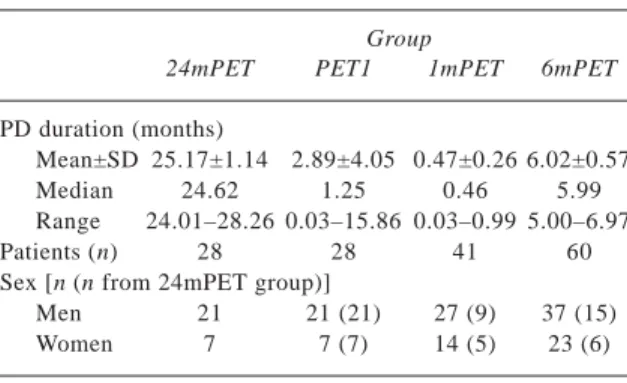
We investigated changes in peritoneal transport in patients treated at least 2 years with continuous am-bulatory peritoneal dialysis (CAPD). The study in-cluded 28 patients (21 men, 7 women; CAPD duration: 24.0 – 28.3 months) who underwent peri-toneal equilibration tests (PETs) at 3-month intervals for up to 24 months (group 24mPET). The PET sults obtained at 24 months were compared to the re-sults of the first PET taken in the same group (PET1, 0.03 – 15.86 months) and to the results of groups 1mPET and 6mPET. Group 1mPET consisted of 41 pa-tients—among them 14 patients (9 men, 5 women) from group 24mPET—who underwent a PET during the first month of CAPD. Group 6mPET consisted of 60 patients—among them 21 patients (15 men, 6 women) from group 24mPET—who underwent a PET at months 5 – 7 of CAPD.
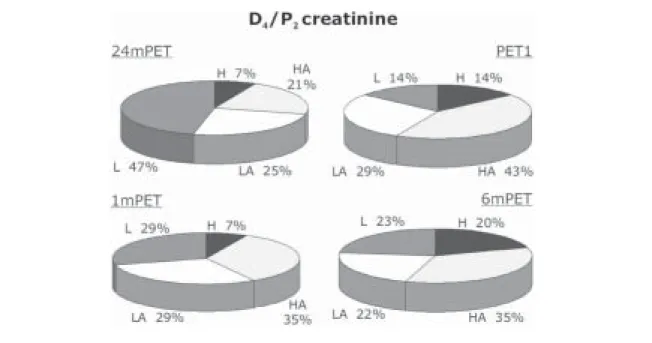
In analyzing paired data, we observed a signifi-cant reduction in vascular-to-mesothelial peritoneal transport (V→M PT) in the entire group and in men. In analyzing unpaired data, we observed a reduction in V→M PT between the 24mPET (n = 28) group and the 6mPET (n = 60) group [dialysate-to-plasma (D4/P2) creatinine: 0.54 ± 0.18 vs. 0.65 ± 0.19, p = 0.013]. Distribution of low, low-average, high-aver-age, and high transporters did not vary among the groups, except in the case of low creatinine transport-ers, who represented 47% of the 24mPET group and 23% of the 6mPET group (p = 0.046).
We conclude that in patients (men) treated with CAPD at least 2 years, V→M PT decreases, increas-ing the percentage of low creatinine transporters and having no significant influence on dialysate drain vol-ume. Peritoneal transport of glucose is stable over a 2-year period.
Key words
Peritoneal transport, peritoneal equilibration test, con-tinuous ambulatory peritoneal dialysis
Introduction
Peritoneal transport is claimed to be stable for up to 24 months of continuous ambulatory peritoneal dialy-sis [CAPD (1–3)]. After that, an increase is usually observed (1,2).
In a report of 177 serial peritoneal equilibration tests (PETs) performed in 49 patients, only 25% of patients showed a significant increase in PET values for dialysate-to-plasma (D/P) creatinine over a period of observation lasting up to 24 months. Reduced peri-toneal membrane function was observed in 10% (4). After long-term uneventful CAPD, a centripetal change of D/P creatinine transport was observed (3,5,6). A similar pattern of change in final-to-initial dialysate glucose (D4/D0) and in ultrafiltration was also reported (6).
These results suggest a regression-to-mean phe-nomenon, which may explain why long-term dialyzed patients are usually high-average transporters (5). Our retrospective study was arranged to investigate changes in peritoneal transport in patients treated at least 2 years with CAPD.
Patients and methods
From among 132 CAPD patients who underwent regu-lar PETs (carried out at three-month intervals, except during periods of clinically manifest infection), we selected a group of 28 patients whose CAPD duration exceeded 24 months. We called this group 24mPET. It included 21 men and 7 women whose CAPD dura-tion ranged from 24.0 months to 28.3 months (median: 24.6 months).
The PET results obtained at the 24th month were compared to those of the first PET (PET1) taken in the same group (0.03 – 15.86 months; median:
Two Years on Continuous
Ambulatory Peritoneal
Dialysis—Does It Change
Peritoneal Transport?
Ewa E. Kaczmarek, Alicja E. Grzegorzewska
From: Chair and Department of Nephrology, Transplant-ology and Internal Diseases, Karol Marcinkowski Univer-sity of Medical Sciences, Poznan, Poland.
3 1.25 months) and to the results of two groups 1mPET
and 6mPET (Table I).
Group 1mPET consisted of 41 patients (27 men, 14 women—including 9 men and 5 women from 24mPET) who underwent a PET during the 1st month of CAPD (0.03 – 0.99 months; median: 0.46 months). Group 6mPET consisted of 60 patients (37 men, 23 women—including 15 men and 6 women from 24mPET) who underwent a PET at 5 – 7 months (5.00 – 6.97 months; median: 5.97) after the start of CAPD.
Each PET was performed using 2.27% glucose dialysis solution according to the method described by Twardowski et al. (7), after a preceding overnight exchange with 2 L of 2.27% glucose dialysis solu-tion. Drainage of dialysate from the overnight ex-change was individually prolonged in every case to empty the peritoneal cavity to the greatest extent as possible. The drain bag was weighed on an electronic scale during dialysate outflow and drainage was stopped when three consecutive weighings, taken at 5-minute intervals, yielded an identical value.
During each PET, dialysate samples (5 mL each) were collected at 0, 2, and 4 hours’ equilibration time after infusion, and blood samples were drawn at 2 hours after dialysate infusion. At the end of the 4-hour dwell, the dialysate was collected, and its vol-ume was measured.
Creatinine and glucose were estimated using re-agents from Cormay Rere-agents (Lublin, Poland). We determined the ratio of the creatinine concentration
in dialysate at the 4th hour of the dwell to that in the plasma at the 2nd hour of the dwell (D4/P2 creatinine), the ratio of the glucose concentration in dialysate at the 4th hour of dwell to that in dialysate at the 0 hour of the dwell (D4/D0 glucose), and the dialysate drain volume.
All results are expressed as mean ± standard de-viation. A median (M) is also given, because the range of values is mostly inconsistent with the normal one. The Wilcoxon test and the McNemar chi-square test were used to determine statistical differences for paired data, and the Mann–Whitney test and the Fisher exact test were used to evaluate unpaired data. Statistical significance was defined as p < 0.05, except in the McNemar test, which reaches statistical significance at p > 3.841.
Results
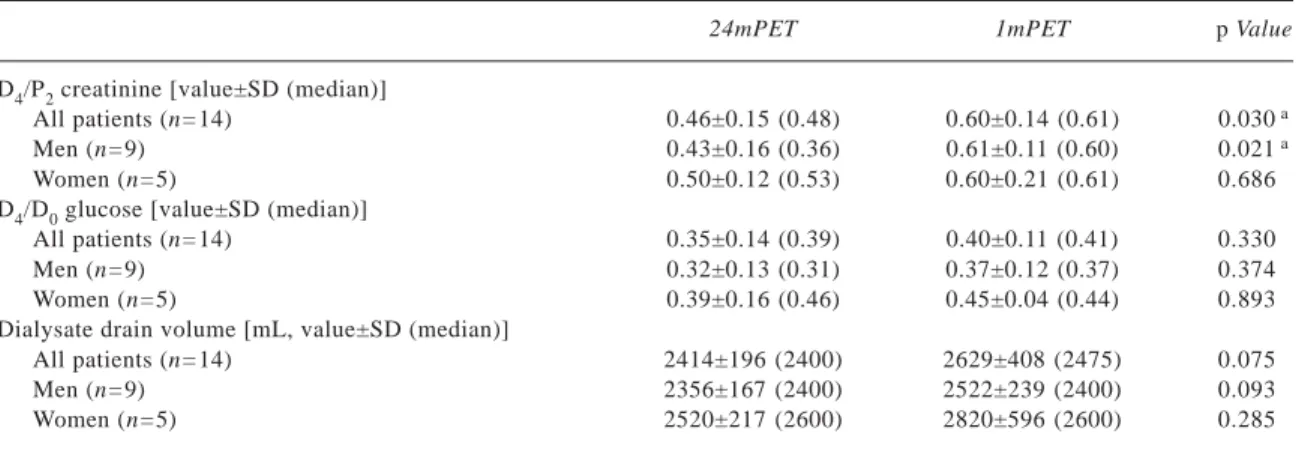
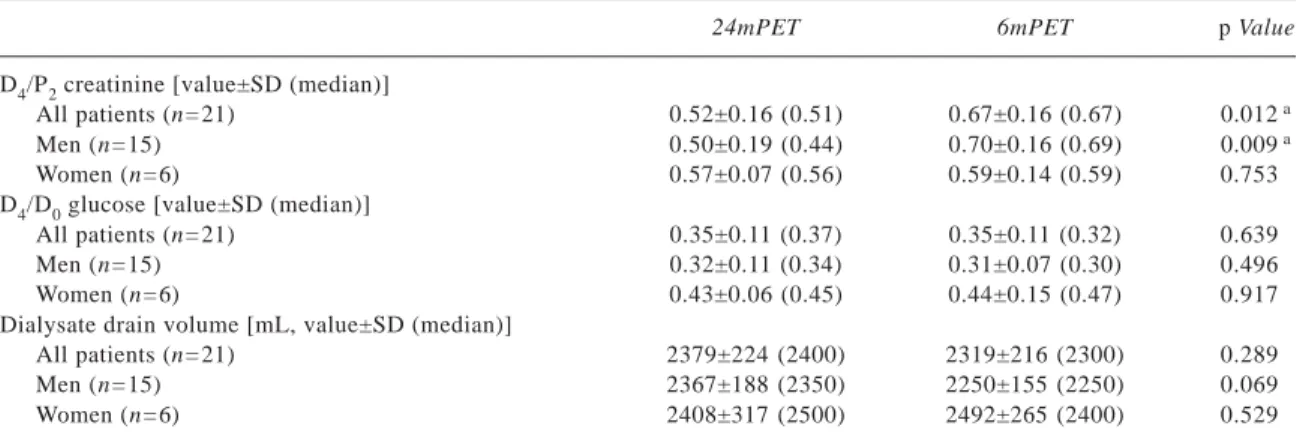
In analyzing paired data (Tables II – IV), we observed a significant reduction in vascular-to-mesothelial peri-toneal transport (V→M PT) in the entire group. How-ever, when allowances for sex were made, the reduction was observed to occur only in men. That result may be attributable to small number of women included in the study (n = 7 in the 24mPET group).
In analyzing the unpaired data (Tables V and VI), and considering the data from all groups, a similar phenomenon was observed only between the 24mPET and 6mPET groups [D4/P2 creatinine: 0.54 ± 0.18 and 0.52 (M) vs. 0.65 ± 0.19 and 0.67 (M) respectively, p = 0.013].
In all three groups (24mPET, 1mPET, and 6mPET), we found a positive correlation between di-alysate drain volume and D4/D0 glucose (24mPET: r = +0.52, p = 0.004; 1mPET: r = +0.43, p = 0.005; 6mPET: r = +0.29, p = 0.025). In the 6mPET and PET1 groups, the drain volume was inversely correlated with D4/P2 creatinine (6mPET: r = –0.26, p = 0.043; PET1: r = –0.43, p = 0.022). Group 24mPET showed a sur-prising positive correlation between D4/D0 glucose and D4/P2 creatinine (r = +0.44, p = 0.020).
Distribution of low (L), low-average (LA), high-average (HA), and high (H) transporters (Figure 1) did not vary significantly among groups, with the ex-ception of low creatinine transporters, who represented 47% of the 24mPET group and 23% of the 6mPET group (p = 0.046). When we evaluated a subgroup of average creatinine transporters (HA and LA, Figure 2), we noted a proportional reduction, from 71% of PET1 Kaczmarek and Grzegorzewska
TABLEI Patient characteristics
Group
24mPET PET1 1mPET 6mPET
PD duration (months)
Mean±SD 25.17±1.14 2.89±4.05 0.47±0.26 6.02±0.57
Median 24.62 1.25 0.46 5.99
Range 24.01–28.26 0.03–15.86 0.03–0.99 5.00–6.97
Patients (n) 28 28 41 60
Sex [n (n from 24mPET group)]
Men 21 21 (21) 27 (9) 37 (15)
Women 7 7 (7) 14 (5) 23 (6)
24mPET = group of patients undergoing a peritoneal equilibration test (PET) at 24 months of treatment; PET1 = first PET in the 24mPET group; 1mPET = group of patients undergoing a PET at 1 month of treatment; 6mPET = group of patients undergoing a PET at about 6 months of treatment; PD = peritoneal dialysis; SD = standard deviation.
4
(20 of 28 patients) to 46% of 24mPET (13 of 28 pa-tients), p = 0.499 by to the McNemar chi-square test, in which p > 3.841 is statistically relevant.
Discussion
Our results indicate that V→M PT decreases in pa-tients (men) treated with CAPD for at least 2 years, increasing the percentage of low creatinine transport-ers and having no significant influence on dialysate drain volume. Glucose peritoneal transport remains stable over the same period.
In contrast to our study, an increase in peritoneal transport is usually observed in long-term PD follow-up (1,2). Passlick–Deetjen et al. (1) followed 86
chronic CAPD patients for up to 36 months and ob-served statistically significant changes in equilibra-tion ratios for creatinine at 24 months and for glucose at 36 months (as compared with baseline values).
In our previous studies (8), we observed a reduc-tion in V→M PT during 20 months’ observareduc-tion in patients above 60 years of age (younger patients main-tained stable peritoneal transport). No significant changes were seen in glucose peritoneal transport at the same PD duration, which supports the present study and indicates that M→V PT is more stable over time. Constancy in M→V transport was also docu-mented (independent of peritonitis occurrence) in chil-dren observed for a similar time period (9). And, in a Changes in Peritoneal Transport
TABLEIII Results of peritoneal equilibration test (PET), data pair 2
24mPET 1mPET p Value
D4/P2 creatinine [value±SD (median)]
All patients (n=14) 0.46±0.15 (0.48) 0.60±0.14 (0.61) 0.030 a
Men (n=9) 0.43±0.16 (0.36) 0.61±0.11 (0.60) 0.021 a
Women (n=5) 0.50±0.12 (0.53) 0.60±0.21 (0.61) 0.686
D4/D0 glucose [value±SD (median)]
All patients (n=14) 0.35±0.14 (0.39) 0.40±0.11 (0.41) 0.330
Men (n=9) 0.32±0.13 (0.31) 0.37±0.12 (0.37) 0.374
Women (n=5) 0.39±0.16 (0.46) 0.45±0.04 (0.44) 0.893
Dialysate drain volume [mL, value±SD (median)]
All patients (n=14) 2414±196 (2400) 2629±408 (2475) 0.075
Men (n=9) 2356±167 (2400) 2522±239 (2400) 0.093
Women (n=5) 2520±217 (2600) 2820±596 (2600) 0.285
aStatistically significant difference.
24mPET = group of patients undergoing a PET at 24 months of treatment; 1mPET = group of patients undergoing a PET at 1 month of treatment; D4/P2 = 4-hour dialysate to 2-hour plasma ratio of creatinine; D4/D0 = 4-hour to initial ratio of dialysate glucose.
TABLEII Results of peritoneal equilibration test (PET), data pair 1
24mPET PET1 p Value
D4/P2 creatinine [value±SD (median)]
All patients (n=28) 0.54±0.18 (0.52) 0.66±0.16 (0.67) 0.008 a
Men (n=21) 0.55±0.19 (0.50) 0.68±0.15 (0.69) 0.010 a
Women (n=7) 0.53±0.12 (0.56) 0.61±0.17 (0.65) 0.499
D4/D0 glucose [value±SD (median)]
All patients (n=28) 0.35±0.11 (0.36) 0.36±0.12 (0.38) 0.682
Men (n=21) 0.34±0.11 (0.35) 0.34±0.13 (0.33) 0.931
Women (n=7) 0.38±0.14 (0.44) 0.43±0.06 (0.43) 0.612
Dialysate drain volume [mL, value±SD (median)]
All patients (n=28) 2395±207 (2400) 2429±388 (2400) 1.000
Men (n=21) 2400±176 (2400) 2324±273 (2300) 0.198
Women (n=7) 2379±230 (2400) 2743±525 (2600) 0.080
aStatistically significant difference.
24mPET = group of patients undergoing a PET at 24 months of treatment; PET1 = first PET in the 24mPET group; D4/P2 = 4-hour dialysate to 2-hour plasma ratio of creatinine; SD = standard deviation; D4/D0 = 4-hour to initial ratio of dialysate glucose.
5
7-year retrospective cohort survey, median D/P creat-inine decreased significantly, but neither the D4/D0 glucose nor the final median ultrafiltration did (6).
Ultrafiltration volume was positively correlated with D4/D0 glucose in the groups 24mPET, 1mPET,
and 6mPET, and inversely correlated with V→M PT in the groups 6mPET and PET1, supporting previous observations (10). Group 24mPET showed a positive
TABLEVI Results of peritoneal equilibration test (PET), unpaired data 2
24mPET 6mPET p Value
D4/P2 creatinine [value±SD (median)]
All patients 0.54±0.18 (0.52) 0.65±0.19 (0.67) 0.018 a n=28 n=60 Men 0.55±0.19 (0.50) 0.64±0.20 (0.66) 0.103 n=21 n=37 Women 0.53±0.12 (0.56) 0.65±0.16 (0.68) 0.096 n=7 n=23
D4/D0 glucose [value±SD (median)]
All patients 0.35±0.11 (0.36) 0.33±0.12 (0.30) 0.251 n=28 n=60 Men 0.34±0.11 (0.35) 0.33±0.12 (0.32) 0.677 n=21 n=37 Women 0.38±0.14 (0.44) 0.33±0.14 (0.28) 0.335 n=7 n=23
Dialysate drain volume [mL, value±SD (median)] All patients 2395±207 (2400) 2338±193 (2300) 0.121 n=28 n=60 Men 2400±176 (2400) 2326±187 (2300) 0.096 n=21 n=37 Women 2379±230 (2400) 2359±200 (2300) 0.848 n=7 n=23
aStatistically significant difference.
24mPET = group of patients undergoing a PET at 24 months of treatment; 6mPET = group of patients undergoing a PET at 6 months of treatment; D4/P2 = 4-hour dialysate to 2-hour plasma ratio of creatinine; D4/D0 = 4-hour to initial ratio of dialysate glucose.
TABLEV Results of peritoneal equilibration test (PET), unpaired data 1
24mPET 1mPET p Value
D4/P2 creatinine [value±SD (median)]
All patients 0.54±0.18 (0.52) 0.61±0.14 (0.61) 0.095 n=28 n=41 Men 0.55±0.19 (0.50) 0.61±0.14 (0.60) 0.215 n=21 n=27 Women 0.53±0.12 (0.56) 0.62±0.14 (0.64) 0.110 n=7 n=14
D4/D0 glucose [value±SD (median)]
All patients 0.35±0.11 (0.36) 0.38±0.12 (0.38) 0.477 n=28 n=41 Men 0.34±0.11 (0.35) 0.36±0.11 (0.37) 0.742 n=21 n=27 Women 0.38±0.14 (0.44) 0.42±0.13 (0.44) 0.689 n=7 n=14
Dialysate drain volume [mL, value±SD (median)]
All patients 2395±207 (2400) 2430±367 (2400) 0.976 n=28 n=41 Men 2400±176 (2400) 2372±323 (2400) 0.510 n=21 n=27 Women 2379±230 (2400) 2543±418 (2475) 0.585 n=7 n=14
24mPET = group of patients undergoing a PET at 24 months of treatment; 1mPET = group of patients undergoing a PET at 1 month of treatment; D4/P2 = 4-hour dialysate to 2-hour plasma ratio of creatinine; D4/D0 = 4-hour to initial ratio of dialysate glucose.
TABLEIV Results of peritoneal equilibration test (PET), data pair 3
24mPET 6mPET p Value
D4/P2 creatinine [value±SD (median)]
All patients (n=21) 0.52±0.16 (0.51) 0.67±0.16 (0.67) 0.012 a
Men (n=15) 0.50±0.19 (0.44) 0.70±0.16 (0.69) 0.009 a
Women (n=6) 0.57±0.07 (0.56) 0.59±0.14 (0.59) 0.753
D4/D0 glucose [value±SD (median)]
All patients (n=21) 0.35±0.11 (0.37) 0.35±0.11 (0.32) 0.639
Men (n=15) 0.32±0.11 (0.34) 0.31±0.07 (0.30) 0.496
Women (n=6) 0.43±0.06 (0.45) 0.44±0.15 (0.47) 0.917
Dialysate drain volume [mL, value±SD (median)]
All patients (n=21) 2379±224 (2400) 2319±216 (2300) 0.289
Men (n=15) 2367±188 (2350) 2250±155 (2250) 0.069
Women (n=6) 2408±317 (2500) 2492±265 (2400) 0.529
aStatistically significant difference.
24mPET = group of patients undergoing a PET at 24 months of treatment; 6mPET = group of patients undergoing a PET at 6 months of treatment; D4/P2 = 4-hour dialysate to 2-hour plasma ratio of creatinine; D4/D0 = 4-hour to initial ratio of dialysate glucose.
6
correlation between D4/D0 glucose and D4/P2 creati-nine, which is quite surprising, because inverse cor-relation is claimed for that cor-relationship (5).
Hung et al. (6) found that the pattern of final peritoneal transport was significantly altered as compared with initial PET results: only 15.6% of patients remained H or L transporters (the extreme subgroups). On the other hand, 84.4% maintained
initial HA or LA transport status (the average subgroup).
Conclusions
Other authors note that, after long-term uneventful CAPD, PET results show a tendency among H porters to experience a reduction in peritoneal trans-port, and a tendency among L and LA transporters to Changes in Peritoneal Transport
FIGURE 1 Proportional distribution of low (L), low-average (LA), high-average (HA), and high (H) transporters in the study groups.
D4/P2 = 4-hour dialysate to 2-hour plasma ratio of creatinine; 24mPET = group of patients undergoing a peritoneal equilibration test (PET) at 24 months of treatment; PET1 = first PET in the 24mPET group; 1mPET = group of patients undergoing a PET at 1 month of treatment; 6mPET = group of patients undergoing a PET at about 6 months of treatment. (Note the difference in low transporters between 24mPET and 6mPET, p = 0.013.)
FIGURE 2 Over time, a subgroup of average creatinine transporters [high-average (HA) and low-average (LA)] proportionately de-creased, p = 0.499 by the McNemar chi-square test, where p > 3.841 is statistically significant. PET1 = first peritoneal equilibration test (PET) in the 24mPET group; H = high transporters; L = low transporters; 24mPET = group of patients undergoing a PET at 24 months of treatment.
7 demonstrate the opposite change. That observation
may explain why patients with extreme PET results continue well on CAPD, and why patients who have been dialyzed for a long time are usually HA trans-porters (5,6). For that regression-to-mean phenom-enon, Wong et al. (3) observed no significant change in peritoneal transport even after 2 years.
In our study group, we observed a relevant con-trary difference between an initial PET and a PET taken at 24 months of CAPD (Figure 2), with the sub-group of average creatinine transporters decreasing. The L transporter group became the largest (47%), where, at the beginning, HA transporters had domi-nated (43%). The proportional distribution of trans-port types, with the increased low creatinine transtrans-port rate (Figure 1), differed significantly only between the 24mPET and 6mPET groups, and so we did not actu-ally record a “centralization” of PET results.
References
1 Passlick–Deetjen J, Chlebowski H, Koch M, Grabensee B. Changes of peritoneal membrane func-tion during long-term CAPD. Adv Perit Dial 1990; 6:35–43.
2 Yoshino A, Honda M, Fukuda M, et al. Changes in peritoneal equilibration test values during long-term peritoneal dialysis in peritonitis-free children. Perit Dial Int 2001; 21:180–5.
3 Wong TY, Szeto CC, Lai KB, Lam CW, Lai KN, Li PK. Longitudinal study of peritoneal membrane function in continuous ambulatory peritoneal dialy-sis: relationship with peritonitis and fibrosing factors. Perit Dial Int 2000; 20:679–85.
4 Blake PG, Abraham G, Sombolos K, et al. Changes
in peritoneal membrane transport rates in patients on long-term CAPD. Adv Perit Dial 1989; 5:3–7. 5 Lo WK, Brendolan A, Prowant BF, et al. Changes in
the peritoneal equilibration test in selected chronic peritoneal dialysis patients. J Am Soc Nephrol 1994; 4:1466–74. [Erratum in: J Am Soc Nephrol 1994; 4:1630]
6 Hung KY, Huang JW, Tsai TJ, Chen WY. Natural changes in peritoneal equilibration test results in continuous ambulatory peritoneal dialysis patients: a retrospective, seven year cohort survey. Artif Organs 2000; 24:261–4.
7 Twardowski ZJ, Nolph KD, Khanna R, et al. Perito-neal equilibration test. Perit Dial Bull 1987; 7:138–47.
8 Grzegorzewska AE, Leander M, Mariak I. Differ-ences in peritoneal equilibration test results in pa-tients aged above or below 60 years. Adv Perit Dial 2002; 18:33–9.
9 Nishi A, Ito Y, Amamoto Y, Aida K, Kato H. Longi-tudinal changes in peritoneal equilibration test with or without peritonitis in children. Pediatr Nephrol 1995; 9:562–5.
10 Davies SJ, Brown B, Bryan J, Russell GI. Clinical evaluation of the peritoneal equilibration test: a population based study. Nephrol Dial Transplant 1993; 8: 64–70.
Corresponding author:
Alicja E. Grzegorzewska, MDPhD, Chair and Depart-ment of Nephrology, Transplantology and Internal Diseases, Al. Przybyszewskiego 49, Poznan 60-355 Poland.
E-mail:
[email protected] or [email protected] Kaczmarek and Grzegorzewska
Advances in Peritoneal Dialysis, Vol. 20, 2004
Peritoneal hyperpermeability has been associated with increased levels of effluent vascular endothelial growth factor (VEGF) and interleukin-6 (IL-6). Meso-thelial cells can produce various vasoactive substances besides VEGF. A large mesothelial mass may possi-bly lead to high dialysate VEGF concentrations and may partly explain some cases of peritoneal hyper-permeability during a patient’s early months on peri-toneal dialysis (PD). Early periperi-toneal fast transport may therefore not necessarily be associated with sys-temic inflammation.
To investigate the relationship of effluent markers and peritoneal transport, we measured the appear-ance rates of cappear-ancer antigen 125 (CA125), VEGF, and IL-6 in 4-hour effluents from 69 peritoneal equilibra-tion tests (PETs) using 3.86% glucose soluequilibra-tion. At the same time, we measured serum VEGF and IL-6. Our analyses included an early group (EG), whose mem-bers had been on PD for 4.6 ± 3.3 months, and a later group (LG), whose members had been on PD for 30 ± 17 months.
In EG, dialysate-to-plasma creatinine at 4 hours (D/PCr240) correlated significantly with effluent CA125/min (r = 0.51, p = 0.006) and VEGF/min (r = 0.57, p = 0.001), but not with serum VEGF or IL-6. The values of CA125/min and VEGF/min also corre-lated (r = 0.40, p = 0.034). Fast transporters in EG had higher effluent CA125 (p = 0.057) and VEGF (p = 0.0001), but not serum or effluent IL-6. In LG, D/PCr240 again correlated significantly with dialysate VEGF
(r = 0.51, p = 0.009), but not with CA125. Fast trans-porters in LG tended to have higher levels of serum and effluent IL-6 and effluent VEGF.
We conclude that fast solute transport rates at the beginning of PD are associated with signs of a large mesothelial cell mass and not consistently associated with higher systemic IL-6. The VEGF produced by mesothelial cells can mediate early peritoneal hyperpermeability in some populations. Later, me-sothelial mass is lost and is no longer related to in-creased intraperitoneal VEGF or IL-6.
Key words
Peritoneal transport, mesothelial cells, vascular endo-thelial growth factor, cancer antigen 125, interleukin-6
Introduction
Fast peritoneal solute transport rates at the beginning of peritoneal dialysis (PD) have been linked to sys-temic inflammation, with increased levels of plasma cytokines such as interleukin-6 (1). Severe associated comorbidity could explain the worse outcomes of these patients (2). However, baseline peritoneal hyper-permeability is not always associated with inflamma-tion, and the dialysis population probably includes a heterogeneous group of patients (3,4). In some pa-tients, a baseline profile of fast solute transport changes to an average category. In fact, longitudinal studies have often documented a centripetal progression in dialysate-to-plasma (D/P) creatinine (5,6).
Because mesothelial cells are able to constitutively produce vascular endothelial growth factor [VEGF (7)], a potent vasodilator and angiogenic factor, a larger mesothelial mass could therefore be assumed to pro-mote higher levels of intraperitoneal VEGF. Those
Evaluation of Effluent
Markers Cancer Antigen 125,
Vascular Endothelial Growth
Factor, and Interleukin-6:
Relationship with Peritoneal
Transport
Anabela Rodrigues,1 Margarida Martins,2 Mario J. Santos,2 Isabel Fonseca,1 José C. Oliveira,2 Antonio Cabrita,1 João. Castro e Melo,2 Raymond T. Krediet3
From: 1Nephrology Department and 2Clinical Pathology Department, Hospital Geral de Santo Antonio, Porto, Por-tugal, and 3Nephrology Department, Academic Medical Centre, University of Amsterdam, Amsterdam, Netherlands.
9 levels may induce recruitment of previously
non-perfused capillaries, causing a functional increase in the effective capillary surface during the early months of PD. With longer time on PD, a reduction in me-sothelial mass is observed (8); however, this reduc-tion is paralleled by an anatomic increase in peritoneal vascular surface area (9). Cumulative exposition to glucose degradation products stimulates VEGF production not only by mesothelial cells, but also by capillary endothelial cells (10,11). Increased intraperi-toneal levels of interleukins and growth factors might suggest ongoing chronic inflammation due to glucotoxicity (12).
The aim of the present study was therefore both to investigate the relationship between peritoneal solute transport and markers of inflammation (systemic and intraperitoneal IL-6) and to evaluate whether mesothe-lial mass and effluent VEGF are related to peritoneal hyperpermeability in the initial phase and the later stages of PD.
Patients and methods
We analyzed 69 peritoneal equilibration tests (PETs) performed in 58 patients with 3.86% or 4.25% PD solution. The average age of the patients was 50 years (range: 23 – 81 years). Median duration of PD was 13 months (range: 0.2 – 80 months). All patients were treated with commercially available glucose-based solutions.
We measured the appearance rates of interleukin-6 (IL-6), cancer antigen 125 (CA125), and VEGF in the effluent at 240 minutes of the PET. To measure VEGF in effluent and serum, we used a commercially available enzyme-linked immunosorbent assay [Quantikine (human VEGF): R&D Systems, Minne-apolis, MN, U.S.A.] as previously described (13). To measure IL-6 in effluent and serum, we used a com-mercially available immunoenzymometric assay (Easia: Biosource Europe SA, Nivelles, Belgium). To measure CA125, we used an electrochemilumines-cence method with a automated analyzer (Elecsys 2010: Boehringer Mannheim, Indianapolis, IN, U.S.A.).
The relationship between peritoneal transport and effluent markers was studied in two groups: an early group (EG) whose members had been on PD for a period ≤12 months (n = 32), and a later group (LG) whose members had been on PD for >12 months (n = 37).
Statistical analysis
We applied the Kolmogorov–Smirnov test for a nor-mal distribution. Serum IL-6 and VEGF showed a non normal distribution, and logarithmic transformation was therefore performed before analysis. Variables with normal distribution are expressed as mean ± standard deviation, and asymmetrically distributed data are re-ported as medians and interquartile ranges. The Pearson correlation test was used to determine correlations be-tween variables. The Mann–Whitney test was used to compare groups. Values of p < 0.05 were used to de-fine statistical significance, and all statistical analyses were performed using the SPSS software program, version 11.5 (SPSS Inc., Chicago, IL, U.S.A.).
Results
The appearance rate of CA125 decreased with time on PD (r = –0.30, p = 0.012), as shown in Figure 1. No trend related to the duration of PD was observed for any of the other parameters investigated. Table I shows the results of the PET and the CA125, VEGF, and IL-6 analyses.
Further analysis of values for EG patients showed that D/P creatinine was correlated with the appear-ance rate of VEGF (r = 0.57, p = 0.001) and of CA125 (r = 0.51, p = 0.006; Figure 2). A correlation was also present between the appearance rate of CA125 and that of VEGF (r = 0.40, p = 0.034). No relationships were found between D/P creatinine, serum VEGF, the appearance rate of IL-6, and serum IL-6.
Rodrigues et al.
FIGURE 1 Relationship between the appearance rate of cancer antigen (CA125) and the duration of peritoneal dialysis (p = 0.012).
10
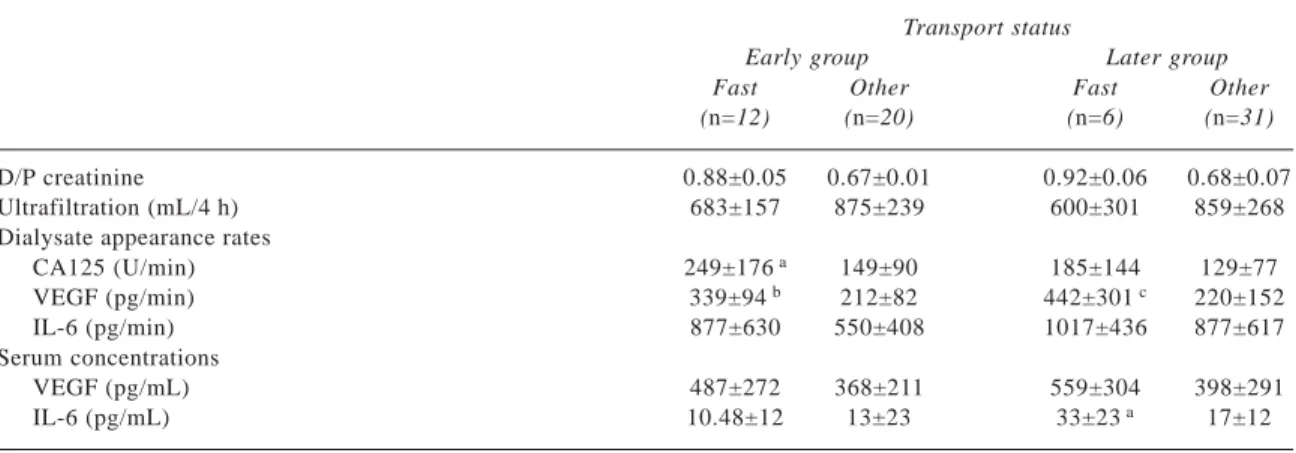
A comparison between EG fast transporters (D/P creatinine > 0.81) and other transport categories showed a tendency to higher CA125 values in the fast transporters and significantly higher VEGF appear-ance rates (Table II).
In the LG patients, D/P creatinine correlated only with the appearance rate of VEGF (r = 0.38, p = 0.021). A correlation between the appearance rates of CA125 and VEGF was not found in LG patients. Fast transport patients in LG showed a tendency to higher serum IL-6 concentrations (p = 0.117). The difference in the appearance rate of VEGF was of borderline sig-nificance (p = 0.058, Table II).
Discussion
The present study shows that relationships between peritoneal transport status and effluent and serum markers of inflammation and angiogenesis depend on the duration of PD. In the first year of PD, fast trans-porters were especially characterized by increased CA125 and VEGF appearance rates, but not by high serum or dialysate levels of IL-6. That result contrasts with the results obtained by Stenvinkel et al. (1), but accords with a recent study of nondiabetic PD patients investigated during the first 6 months of dialysis (14).
CA125, VEGF, IL-6: Relationship with Peritoneal Transport
TABLEI Demographics of the patients in the early peritoneal dialysis group (n=32) and the later group (n=37), and their perito-neal transport characteristics, their dialysate appearance rates of cancer antigen 125 (CA125), vascular endothelial growth factor (VEGF), and interleukin-6 (IL-6), and their serum concentrations of VEGF and IL-6
Groups a Early Later Male/female (n) 12/20 17/20 Diabetic/nondiabetic (n) 7/25 10/27 Age (years) 49±15 51±16 Follow-up (months) 4.6±3.3 30±17 D/P creatinine 0.75±0.13 0.72±0.11 Ultrafiltration (mL/4 h) 803±229 817±286 Dialysate appearance rate (mean±SD)
CA125 (U/min) 185±133 137±90
VEGF (pg/min) 260±106 255±196
IL-6 (pg/min) 690±520 1013±775
Serum concentration [median (interquartile range)] VEGF (pg/mL) 336 (218–558) 326 (230–483) IL-6 (pg/mL) 6.3 (3.8–13.1) 15.7 (10.7–25.7)
aNo parameter was significantly different between the two groups,
except for duration of follow-up.
D/P = dialysate-to-plasma concentration ratio; SD = standard deviation.
FIGURE 2 Correlations in the early-group patients between the dialysate-to-plasma concentration ratio (D/P) of creatinine and the appearance rate of cancer antigen 125 (CA125; p = 0.006), be-tween D/P creatinine and the appearance rate of vascular endothe-lial growth factor (VEGF; p = 0.001), and between the appearance rates of VEGF and CA125 (p = 0.034).
11
The discrepancy underlines the need to interpret ini-tial fast transporters as a heterogeneous population, not always inflamed and prone to a poor prognosis.
Our results suggest that the VEGF produced by mesothelial cells—such production having been es-tablished in vitro (7)—may be involved in the initial fast transport status. Our hypothesis is supported by the correlation between D/P creatinine and the appear-ance rate of VEGF, which has been reported previ-ously (13), and by the correlations between CA125 and VEGF and between D/P creatinine and CA125.
The relationship between CA125 and peritoneal transport rates disappears during long-term PD (15), probably because mesothelial cell mass declines (16). Yet, solute hyperpermeability is still associated with higher dialysate appearance rates of VEGF in long-term PD patients (12), which suggests a non mesothe-lial site of production. In our longer-duration PD patients with fast transport status, we found some evi-dence of higher IL-6 levels, which suggests a role for ongoing intraperitoneal inflammation.
Conclusion
The presence of fast peritoneal transport status in the early stage of PD is often associated with high ap-pearance rates of CA125 and VEGF, suggesting an indirect effect of mesothelial cell mass on solute trans-port rates—partly mediated by VEGF. In the later stages of PD, peritoneal angiogenesis and chronic in-flammation are likely to be involved in peritoneal sol-ute transport.
References
1 Stenvinkel P, Chung SH, Heimbürger O, Lindholm B. Malnutrition, inflammation, and atherosclerosis in peritoneal dialysis patients. Perit Dial Int 2001; 21(Suppl 3):S157–62.
2 Pecoits–Filho R, Araujo MR, Lindholm B, et al. Plasma and dialysate IL-6 and VEGF concentrations are associated with high peritoneal solute transport rate. Nephrol Dial Transplant 2002;17:1480–6. 3 Park HC, Kang SW, Choi KH, Ha SK, Han DS, Lee
HY. Clinical outcome in CAPD patients is not influ-enced by high peritoneal transport status. Perit Dial Int 2001; 21(Suppl 3):S80–5.
4 Chung SH, Heimbürger O, Stenvinkel P, Qureshi AR, Lindholm B. Association between residual renal function, inflammation and patient survival in new peritoneal dialysis patients. Nephrol Dial Transplant 2003; 18:590–7.
5 Lo WK, Brendolan A, Prowant BF, et al. Changes in the peritoneal equilibration test in selected chronic peritoneal dialysis patients. J Am Soc Nephrol 1994; 4:1466–74. [Erratum in: J Am Soc Nephrol 1994; 4:1630]
6 Wong TY, Szeto CC, Lai KB, Lam CW, Lai KN, Li PK. Longitudinal study of peritoneal membrane function in continuous ambulatory peritoneal dialy-sis: relationship with peritonitis and fibrosing factors. Perit Dial Int 2000; 20:679–85.
7 Selgas R, del Peso G, Bajo MA, et al. Spontaneous VEGF production by cultured peritoneal mesothelial cells from patients on peritoneal dialysis. Perit Dial Int 2000; 20:798–801.
8 Krediet RT. Dialysate cancer antigen 125 concentra-tion as marker of peritoneal membrane status in
TABLEII Comparison between fast transporters (D/P creatinine > 0.81) and other transport categories by group Transport status
Early group Later group
Fast Other Fast Other
(n=12) (n=20) (n=6) (n=31)
D/P creatinine 0.88±0.05 0.67±0.01 0.92±0.06 0.68±0.07
Ultrafiltration (mL/4 h) 683±157 875±239 600±301 859±268
Dialysate appearance rates
CA125 (U/min) 249±176 a 149±90 185±144 129±77 VEGF (pg/min) 339±94 b 212±82 442±301 c 220±152 IL-6 (pg/min) 877±630 550±408 1017±436 877±617 Serum concentrations VEGF (pg/mL) 487±272 368±211 559±304 398±291 IL-6 (pg/mL) 10.48±12 13±23 33±23 a 17±12 ap = 0.10. bp = 0.001. cp = 0.06. Rodrigues et al.
12
patients treated with chronic peritoneal dialysis. Perit Dial Int 2001; 21:560–7.
9 Krediet RT, Zweers MM, van der Wal AC, Struijk DG. Neoangiogenesis in the peritoneal membrane. Perit Dial Int 2000; 20(Suppl 2):S19–25.
10 Ha H, Cha MK, Choi HN, Lee HB. Effects of perito-neal dialysis solutions on the secretion of growth factors and extracellular matrix proteins by human peritoneal mesothelial cells. Perit Dial Int 2002; 22: 171–7.
11 Seo MJ, Oh SJ, Kim SI, et al. High glucose dialysis solutions increase synthesis of vascular endothelial growth factors by peritoneal vascular endothelial cells. Perit Dial Int 2001; 21(Suppl 3):S35–40. 12 De Vriese AS, Mortier S, Lameire NH. Glucotoxicity
of the peritoneal membrane: the case for VEGF. Nephrol Dial Transplant 2001; 16:2299–302. 13 Zweers MM, de Waart DR, Smit W, Struijk DG,
Krediet RT. Growth factors VEGF and TGF-β1 in peritoneal dialysis. J Lab Clin Med 1999; 134: 124–32.
14 Van Esch S, Zweers MM, Jansen MAM, de Waart DR, van Manen JG, Krediet RT. Determinants of peritoneal solute transport rates in newly started non diabetic peritoneal dialysis patients. Perit Dial Int 2004; [In press].
15 Hutten H, Zweers MM, de Waart DR, Jansen MM, Krediet RT. Cancer antigen (CA)125, peritoneal transport parameters and duration of peritoneal dialy-sis (PD) [Abstract]. Perit Dial Int 2001; 21(Suppl 2): S133.
16 Williams JD, Craig KJ, Topley N, et al. Morphologic changes in the peritoneal membrane of patients with renal disease. J Am Soc Nephrol 2002; 13:470–9.
Corresponding author:
Anabela Rodrigues, Nephrology Department, Hospi-tal Geral de Santo Antonio, Largo Abel Salazar, Porto 4000 Portugal.
E-mail:
Advances in Peritoneal Dialysis, Vol. 20, 2004
Peritoneal transport rates and net drained volume are reported to be different for peritoneal dialysis (PD) pa-tients with diabetes mellitus (DM) as compared with patients without DM. The difference has been consid-ered to be caused by exposure to high plasma glucose levels before PD initiation. However, the results of pre-vious studies conflict. Transport of small solutes has been reported to be either higher than or similar to that seen in patients without DM, and ultrafiltration to be either similar or lower. No information on free water trans-port is available. The main problem in earlier retrans-ports is the wide variation in duration of PD, which may have influenced the outcomes. In the present study, we com-pared the results of peritoneal function tests in 10 pa-tients with DM to results in 10 papa-tients without DM. All patients were investigated within the first 4 months of PD treatment.
No differences were observed in transcapillary ul-trafiltration rate, net ulul-trafiltration, or lymphatic ab-sorption. Free water transport, estimated using the maximum dip in the dialysate-to-plasma ratio of sodium and quantified by calculating the transport through the ultrasmall pores, showed no differences. Small-solute transport was also similar. These findings imply that a mild chronic hyperglycemic state in the peritoneal ves-sels does not contribute to important peritoneal changes or to changes in aquaporin-1 function. The influence of continuous treatment with hyperosmolar glucose solu-tions on the latter is worth investigating.
Key words
Free water transport, peritoneal solute transport, dia-betes, aquaporin-1
Introduction
Reported studies on the peritoneal transport charac-teristics of patients with diabetes mellitus (DM) treated with peritoneal dialysis (PD) have shown inconsis-tent results. In some studies, clearances for urea and creatinine were described as higher in DM patients than in non DM patients (1–3). In other studies, how-ever, no difference in peritoneal solute transport was found between patients with and without DM who were matched for sex, age, and duration of PD (4). Drained volumes were either lower in DM patients (2) or showed no difference (5).
These conflicting results in cross-sectional stud-ies were likely to have been partly caused by wide variation in the duration of exposure to glucose-con-taining dialysis fluids. Previous studies of the influ-ence of PD duration on transport parameters showed that solute transfer increases and ultrafiltration (UF) declines with time on peritoneal dialysis (6–8). These effects are probably caused by long-term exposure to dialysis fluids, which is known to alter peritoneal morphology.
To avoid the possible diabetogenic effect of expo-sure to PD fluids, Serlie et al. investigated a group of patients within the first 6 months of PD treatment, administering a permeability test with 1.36% glucose solution. A lower transcapillary ultrafiltration rate (TCUFR) was present in diabetic patients than in matched controls (9). In that study, no differences in small-solute transport or effective lymphatic absorp-tion were observed. Those findings raise the quesabsorp-tion of whether the lower TCUFR could have been the re-sult of lower free water transport rates. In the present study, we therefore compared free water transport and other transport characteristics in DM and non DM patients at the onset of peritoneal dialysis. The study was conducted using a 3.86% glucose solution.
Free Water Transport in
Patients Starting with
Peritoneal Dialysis: A
Comparison Between Diabetic
and Non Diabetic Patients
Watske Smit,1 Sadie van Esch,1 Dirk G. Struijk,2 Raymond T. Krediet1
From: 1Department of Nephrology, Academic Medical Center, University of Amsterdam, and 2Dianet Foundation, Amsterdam–Utrecht, The Netherlands.
14
Patients and methods
Patients
We compared 10 patients with DM, in whom a stan-dard peritoneal permeability analysis (SPA) was per-formed in the first 4 months of their PD treatment, with 10 non DM patients matched for age, sex, and body surface area. None of the patients had ever ex-perienced peritonitis. All of the patients used com-mercially available, glucose-based dialysis solutions (Dianeal: Baxter BV, Utrecht, Netherlands).
Procedure
The SPA was performed during a 4-hour dwell pe-riod, as previously described (10). The test used 3.86% glucose at the volume the patient was accustomed to receiving. Dialysate samples were taken before instil-lation and at multiple time points during the test (10, 20, 30, 60, 120, 180, and 240 minutes). A volume marker, dextran 70 (Hyskon, Medisan Pharmaceuti-cals AB, Uppsala, Sweden), 1 g/L, was used to deter-mine fluid kinetics.
Calculations
All calculations were performed as previously de-scribed by Pannekeet et al. (10).
Fluid kinetics
The dilution of the volume marker was used to calcu-late transcapillary ultrafiltration (TCUF) by subtract-ing the initial intraperitoneal volume (IPV) from the theoretical IPV (when both lymphatic absorption and sampling would not have been present) at any time point. Because transcapillary ultrafiltration is at its maximum value during the initial phase of a dwell, we calculated the transcapillary ultrafiltration rate in the first minute (TCUF0–1) using a Lineweaver–Burke plot, which is the linear regression between the recip-rocal values of the transcapillary ultrafiltration ob-tained during the SPA and the reciprocal of time (11). We calculated the effective lymphatic absorption rate (ELAR) as the peritoneal dextran clearance (11), and the net UF as the difference between the TCUF and the effective lymphatic absorption. We calculated di-alysate-to-plasma (D/P) sodium as the dialysate so-dium concentration divided by the plasma soso-dium concentration. Dip D/P sodium is the difference be-tween the initial D/P sodium and the lowest D/P so-dium. Correction for Na+ diffusion from the circulation
to the dialysate, which can cause blunting of the de-crease in D/P Na+, was performed using the mass transfer area coefficient (MTAC) of urate (12). That approach enabled us to calculate the sodium concen-tration in the dialysate when only diffusion would have occurred. The result could than be subtracted from the measured concentration at any time point, yield-ing the actual Na+ sieving. Transport through the small pores was calculated by multiplying the sum of the initial intraperitoneal volume and the ultrafiltrate vol-ume (in liters) by the dialysate sodium concentration after correction for diffusion:
Na present = (initial IPV + ultrafiltrate volume)
× dialysate Na [1]
Equation 1 can be calculated for time point 0 (t0) and for any time point during the dwell (tt). Subtract-ing t0 from tt yields the amount of sodium transported at any time point during the dwell.
Dividing the transported sodium by the sodium concentration in the small pores (which is the average of the concentrations in the plasma and in the dialy-sate) yields the volume (in liters) of fluid transported through the small pores:
fluid transport through small pores
= Na transported / Na concentration in the
small pores [2]
Given the calculation of transcapillary ultrafiltra-tion through the small pores for each time point dur-ing a SPA, a Lineweaver–Burke plot can be used to calculate small-pore transport in the first minute (SP0–1) of the dwell. Subtracting the result from TCUF0–1 yields the free water transport in the first minute.
We examined the contribution of free water trans-port to total transcapillary ultrafiltration during the first minute and after 60 minutes of a 3.86% glucose dwell (13).
Solute transport
The peritoneal handling of low molecular weight sol-utes is expressed as MTACs. Glucose absorption is calculated as the difference between the amount of glucose instilled and the amount recovered. We mea-Smit et al.
15 sured C-reactive protein (CRP) by an
immunoturbi-dimetric method. Statistical analysis
Results are expressed as medians and ranges, because most data were distributed asymmetrically. We applied the paired t-test to compare patients with and without DM. We considered a p value less than 0.05 statisti-cally significant.
Results
Table I lists the characteristics of the 20 patients in-cluded in the study. No significant differences were observed between the two patient groups. In patients with DM, the hemoglobin A1c (HbA1c) percentage was 7.4% (range: 5.7% – 10.2%).
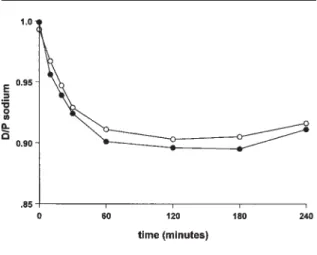
Table II shows the calculated parameters for fluid transport. Values for transcapillary ultrafiltration, net UF, and ELAR were similar in both groups, as Fig-ure 1 shows. The maximum dip in D/P sodium tended to be deeper in the non DM patients than in the DM patients (Figure 2), but the difference was not statisti-cally significant (p = 0.1). The TCUF0–1, transport through the small pores (SP0–1), and free water trans-port in the first minute (FWT0–1) did not differ be-tween the two groups. Also, the percentage of free water transport contributing to total fluid transport in the first hour of the dwell was similar for both groups. Small-solute transport was similar for both groups. The MTAC for creatinine was 8.8 mL/min (range: 5.6 – 16.0 mL/min) in the DM patients as compared with 8.1 mL/min (range: 5.8 – 15.2 mL/min) in the non DM patients. The MTAC of urate was 5.6 mL/min in the DM patients (range: 2.1 – 9.4 mL/min) as com-pared with 7.1 mL/min (range: 4.1 – 13.4 mL/min) in the non DM patients. Moreover, glucose absorption was not different in the two groups: 62% (range: 45% – 78%) in DM patients as compared with 65% (range: 45% – 82%) in the non DM patients. Serum CRP level Free Water Transport in Patients Starting with PD
TABLEI Characteristics [median (range)] of patients with and without diabetes
With diabetes (n=10) Without diabetes (n=10)
Age (years) 61 (46–75) 62 (47–74)
Duration of PD (months) 2.8 (1.2–3.5) 3.2 (2.5–3.9)
Body surface area (m2) 1.93 (1.59–2.22) 1.91 (1.64–2.26)
Residual GFR (mL/min/1.73 m2) 4.3 (0–7.8) 3.3 (0–7.0)
Serum CRP (U/L) 4 (3–49) 5 (3–11)
PD = peritoneal dialysis; GFR = glomerular filtration rate; CRP = C-reactive protein.
TABLEII Peritoneal fluid transport characteristics [median (range)] for patients with and without diabetes, tested using 3.86% glucose solution
With diabetes Without diabetes
(n=10) (n=10) Net UF (mL) 685 (380 to 944) 665 (288 to 1169) TCUFR (mL/min) 3.7 (2.9–5.9) 4.6 (2.5–6.8) ELAR (mL/min) 1.5 (0.7–2.8) 1.4 (0.6–4.3) Max dip D/P Na+ 0.0928 (0.06–0.13) 0.112 (0.06–0.18) TCUF0–1 (mL) 16.1 (7.8–45.4) 17.6 (6.3–56.8) SP0–1 (mL) 9.0 (5.0–33.3) 9.5 (3.4–28.0) FWT0–1 (mL) 7.3 (1.5–16.8) 7.2 (2.5–12.1) %FWT0–1 43 (25–57) 41 (21–59) %FWT60 33 (15–44) 34 (10–49)
TCUFR = transcapillary ultrafiltration rate; ELAR = effective lym-phatic absorption rate; Max dip D/P Na+ = maximum decrease in
dialysate-to-plasma (D/P) concentration ratio of sodium as com-pared with initial D/P sodium; TCUF0–1 = TCUF in the first minute; SP0–1 = volume transported through the small pores; FWT0–1= vol-ume of free water transport in the first minute; %FWT0–1 = per-centage of free water transport contributing to total TCUF in the first minute; %FWT60 = percentage of free water transport con-tributing to total TCUF in the first hour of the dwell.
FIGURE 1 Fluid profiles for the patients with (left panel) and with-out (right panel) diabetes mellitus at the start of peritoneal dialysis. Transcapillary ultrafiltration (closed circles), net ultrafiltration (open circles), and fluid absorption (closed squares) are shown as a func-tion of time. No significant differences were found between the curves.
16
was also similar in both groups: DM, 4 U/L (range: 3 – 49 U/L); non DM, 5 U/L (range: 3 – 11 U/L).
Discussion
The present study detected no differences in net UF, fluid absorption rates, free water transport, and peri-toneal solute transport in patients with or without DM when they were examined in the first 4 months of PD treatment. Those findings contrast with the re-sults of prior publications, which reported higher sol-ute rates in patients with DM. However, the previous studies were performed in a cross-section of patients who had been treated with PD for varying durations of time and who had therefore been exposed to high intraperitoneal glucose concentrations for variable periods.
In experiments with rats with streptozotocin-induced diabetes, chronic hyperglycemia was asso-ciated with structural and functional changes in the peritoneum (14). The structural changes observed included capillary proliferation and advanced glyco-sylation end-product (AGE) immunoreactivity. Func-tional changes consisted of increased permeability for small solutes and decreased sodium sieving. How-ever, when glycemic control was achieved by admin-istering insulin, the diabetic rats showed no differences as compared with the nondiabetic con-trol rats. The results of this animal study imply that acute, chemically-induced DM can lead to increased
permeability for molecules of various sizes, especially in the absence of glycemic control.
The differences between the permeability param-eters in rats with experimentally induced DM and those in patients with DM in the present study can be ex-plained in several ways. First, in the animal studies, the rats were either diabetic or uremic. In patients, a combination of both conditions could be present at the start of PD. The contribution of uremia to transport and membrane alterations in diabetes is probably more important than the contribution of hyperglycemia alone (15). Second, the duration of diabetes and uremia in the animal studies was rather short. The patients in our study were diagnosed with diabetes at least 5 years before the start of PD and were uremic for a longer period of time. Reasonably, the longer the duration of the causative factor, the more pronounced the alter-ations. Because hyperglycemia and uremia can both lead to the formation of AGEs, alterations owing to AGE formation were likely already present in both of our patient groups. Finally, the blood sugar control in the diabetic rats was poor, and the differences in trans-port parameters disappeared in the subgroup treated with insulin. Those factors point to the importance of good glycemic control. Our patients all received insu-lin therapy and had reasonably low HbA1c levels, in-dicating accurate treatment of diabetes.
Other factors that contribute to possible differences in transport parameters in the first months of PD are chronic inflammation and peritonitis. Inflammation can cause both an increase in peritoneal transport rate and a decline in residual renal function. Inversely, a decline in residual renal function or an increase in peritoneal transport rate can induce or aggravate in-flammation (16). In our study patients, no differences in residual renal function or in CRP as marker of in-flammation were identified. Peritonitis is known to cause enhanced solute transport (although the in-creased transport is reversible after recovery from peritonitis). In our groups, none of the patients had ever experienced peritonitis.
Conclusion
The present study in diabetic and nondiabetic patients in their first months of PD revealed no differences in peritoneal transport characteristics, including free water transport. Our findings imply that a mild chronic hyperglycemic state in the peritoneal vessels does not contribute to important peritoneal alterations or to
FIGURE 2 Dialysate-to-plasma (D/P) ratios during a 4-hour dwell for patients with (open circles) and without (closed circles) diabe-tes mellitus at the start of peritoneal dialysis. No significant differ-ences were observed.
17 changes in aquaporin-1 function. The influence of
continuous treatment with glucose-containing dialy-sis solutions, which have concentrations up to more than 10 times those observed in insulin-dependent diabetes mellitus, is worthwhile investigating in long-term follow-up.
References
1 Lin JJ, Wadhwa NK, Suh H, Cabralda T, Patlak CS. Increased peritoneal solute transport in diabetic peritoneal dialysis patients. Adv Perit Dial 1995; 11: 63–6.
2 Lamb EJ, Worrall J, Buhler R, Harwood S, Cattell WR, Dawnay AB. Effect of diabetes and peritonitis on the peritoneal equilibration test. Kidney Int 1995; 47:1760–7.
3 Tzamaloukas AH, Murata GH, Malhotra D, et al. Small-solute clearances in diabetic subjects on con-tinuous ambulatory peritoneal dialysis: comparison to nondiabetic subjects. Adv Perit Dial 1999; 15: 179–82.
4 Lee HB, Park MS, Chung SH, et al. Peritoneal solute clearances in diabetics. Perit Dial Int 1990; 10:85–8. 5 Rubin J, Walsh D, Bower JD. Diabetes, dialysate
losses, and serum lipids during continuous ambula-tory peritoneal dialysis. Am J Kidney Dis 1987; 10: 104–8.
6 Struijk DG, Krediet RT, Koomen GC, et al. Func-tional characteristics of the peritoneal membrane in long-term continuous ambulatory peritoneal dialysis. Nephron 1991; 59:213–20.
7 Davies SJ, Bryan J, Phillips L, Russell GI. Longitudi-nal changes in peritoneal kinetics: the effects of peritoneal dialysis and peritonitis. Nephrol Dial Transplant 1996; 11:498–506.
8 Heimbürger O, Wang T, Lindholm B. Alterations in water and solute transport with time on peritoneal dialysis. Perit Dial Int 1999; 19(Suppl 2):83–90. 9 Serlie MJ, Struijk DG, de Blok K, Krediet RT.
Differ-ences in fluid and solute transport between diabetic and nondiabetic patients at the onset of CAPD. Adv Perit Dial 1997; 13:29–32.
10 Pannekeet MM, Imholz AL, Struijk DG, et al. The standard peritoneal permeability analysis: a tool for the assessment of peritoneal permeability characteris-tics in CAPD patients. Kidney Int 1995; 48:866–75. 11 Krediet RT, Struijk DG, Koomen GC, Arisz L.
Peri-toneal fluid kinetics during CAPD measured with intraperitoneal dextran 70. ASAIO Trans 1991; 37: 662–7.
12 Zweers MM, Imholz AL, Struijk DG, Krediet RT. Correction of sodium sieving for diffusion from the circulation. Adv Perit Dial 1999; 15:65–72.
13 Smit W. Ho-dac-Pannekeet MM, Struijk DG, Krediet RT. Quantification of free water transport in perito-neal dialysis. Kidney Int 2004; [In press].
14 Stoenoiu MS, De Vriese AS, Brouet A, et al. Experi-mental diabetes induces functional and structural changes in the peritoneum. Kidney Int 2002; 62: 668–78.
15 Miyata T, Fu MX, Kurokawa K, van Ypersele de Strihou C, Thorpe SR, Baynes JW. Autoxidation products of both carbohydrates and lipids are in-creased in uremic plasma: is there oxidative stress in uremia? Kidney Int 1998; 54:1290–5.
16 Chung SH, Heimbürger O, Stenvinkel P, Bergström J, Lindholm B. Association between inflammation and changes in residual renal function and peritoneal transport rate during the first year of dialysis. Nephrol Dial Transplant 2001; 16:2240–5.
Corresponding author:
Watske Smit, MD PhD, Department of Nephrology, F4-215, Academic Medical Center, University of Amsterdam, PO Box 22700, Amsterdam 1100 ED The Netherlands.
E-mail:
[email protected] Free Water Transport in Patients Starting with PD


![TABLE I Characteristics [median (range)] of patients with and without diabetes](https://thumb-eu.123doks.com/thumbv2/123dok_br/19267862.981930/15.774.62.722.828.950/table-i-characteristics-median-range-patients-diabetes.webp)