Vol.54, n. 1: pp. 161-171, January-February 2011
ISSN 1516-8913 Printed in Brazil BRAZILIAN ARCHIVES OF
BIOLOGY AND TECHNOLOGY
A N I N T E R N A T I O N A L J O U R N A L
Mathematical Modeling of Convective Air Drying of
Quinoa-Supplemented Feed for Laboratory Rats
Antonio Vega-Gálvez
1*, Alexies Dagnino-Subiabre
2, Gonzalo Terreros
2, Jessica López
1,
Margarita Miranda
1and Karina Di Scala
3,41Department of Food Engineering; Universidad de La Serena; Casilla 599; La Serena - Chile. 2Laboratory of
Neurobiology and Behavior; Neuroscience Unit; Department of Biomedical Sciences; Faculty of Medicine; Universidad Católica del Norte; Coquimbo - Chile 3Food Engineering Research Group; Universidad Nacional de Mar del Plata; Juan B. Justo, 4302; 7600; Mar del Plata - Argentina. 4Consejo Nacional de Investigaciones Científicas y Técnicas; Av. Rivadavia 1917, Buenos Aires - Argentina
ABSTRACT
Drying kinetics of quinoa-supplemented feed for laboratory rats during processing at 50, 60, 70, 80 and 90ºC was studied and modeled in this work. Desorption isotherm was obtained at 60ºC giving a monolayer moisture content of 0.04 g water/g d.m. The experimental drying curves showed that drying process took place only in the falling rate period. Several thin-layer drying equations available in the literature were evaluated based on determination coefficient (r2), sum squared errors (SSE) and Chi-square (χ2) statisticals. In comparison to the experimental moisture values, the values estimated with the Logarithmic model gave the best fit quality (r2 >0.994, SSE < 0.00015 and χ2 < 0.00018), showing this equation could predict very accurately the drying time of rat feed under the operative conditions applied.
Key words: rat feed, quinoa, drying kinetics, modeling, statistical test
*Author for correspondence: [email protected]
INTRODUCTION
Quinoa (Chenopodium quinoa Willd.) is a native plant of the Andean region and is a member of the
subsection Cellulata, genus Chenopodium
(Bhargava et al., 2006). The agricultural potential of this crop is its adaptability, always providing high yield under any adverse climatological conditions (Tolaba et al., 2004; Gely and Santalla, 2007). Quinoa is not a true cereal but rather a fruit, thus, it has been called a pseudo-cereal and even a pseudo-oilseed. Quinoa seeds were used by the pre-Colombian Andean people as a stable food
quinoa make this cereal a perfect supplement not only for human diets but also for animal feeding (Amekbungwan, 2007).
The laboratory rat has become the most widely studied experimental animal model for biomedical research. Since 1966, the scientific literature has more than 300,000 research articles reporting the use of rats. More than 140 inbred strains of rats are currently available, mostly developed for specific disease characteristics, such as cancer, diabetes, hypertension, nutrition, cavity formation, alcohol preference and various inmunological responses. Rats have also been the model of choice for neurobiology, behavioral biology, toxicology and many other areas of biomedical research (Howard et al. 1995).
In particular, for rats whose diet consists of natural ingredients, possible changes in the formulation of these diets may be appropriate to generate improvements in ingredient availability and nutrient composition (Benevenga et al., 1995). Several authors have reported the beneficial effect of supplementing the rat’s diet (Van Dam et al., 1999; Rashad and Moharib, 2003; Hanczakowski and Skraba, 2006; Rivera et al., 1978; Taylor et al., 2005). In addition, quinoa provides the diet formulation antioxidant components like vitamin E and phenolic compounds, and constitutes an important energy source (Jørgensen and Lindberg, 2006; Miranda et al., 2010).
In order to extend the shelf-life of food products, drying can be used as an effective method of preservation (Toğrul and Pehlivan, 2003). The
basic objective of food dehydration is to remove the water to a level at which microbial spoilage is minimized. In addition to this increase in stability, there is a significant reduction in weight and volume that also contributes to reduce the cost of packaging, handling, storing and distribution of foodstuffs (Crapiste, 2000; Akpinar et al., 2003). Prior to studying the drying characteristics of any food, it is necessary to evaluate its moisture sorption behavior. Sorption behavior, represented by the food isotherms, describes the relationship between the water activity and the equilibrium moisture content of the product under study at a given temperature (Vega-Gálvez et al., 2008; Di Scala and Crapiste, 2008). An understanding of sorption parameters is, therefore, valuable in describing the intrinsic processing- and storage-induced changes in food quality (Sharma et al., 2009).
The mathematical modeling is a very useful tool for quickly and inexpensively ascertaining the effect of different system and process parameters on the outcome of a process (Sandeep and Irudayaraj, 2001). Mathematical modeling is an important tool to predict and simulate the drying experimental data. It also contributes to the design of the dryer equipment regarding to optimum drying times as well as a better understanding of the drying mechanism (Sacilik, 2007; Di Scala and Crapiste, 2008). In this regard, it is fundamental to control the air-drying temperature which is the operational condition affecting mainly the process kinetics (Di Scala and Crapiste, 2008; Vega-Gálvez et al., 2008, 2009).
Therefore, the aim of the present study was to determine experimentally the drying curves of quinoa-supplemented rat feed under different drying temperatures, to simulate experimental data with selected mathematical models and to evaluate the influence of temperature on the kinetic parameters of these models.
MATERIALS AND METHODS
Raw material and formulation
The quinoa-supplemented rat feed formulation was carried out mixing rat feed and quinoa (Chenopodium quinoa Willd.). The quinoa seed was obtained from a crop grown in 2008, Cahuil, VI Region, Chile. The rat feed was purchased from the local market of the city of La Serena, Chile. Before preparing the mixture, quinoa seeds were washed with agitated water during one hour to extract the highest amount of saponin, changing the water every 10 minutes. Then, 125 g of quinoa were blanched in 250 mL of water at 80ºC for 15 min. Subsequently, quinoa was drained and cooled at 10ºC. Finally, quinoa was mixed with 125 g of rat feed (Champion S.A.®, Chile) and 300 mL of
water; this mixture was homogenized in a Meat Mincer (Brice meat Mince,TJ12 model, Sydney, Australia). This mixture was molded into a semisphere with a diameter 31.4 + 0.30 mm and drying experiments were carried out.
Physico-chemical analysis
The moisture content was determined by AOAC method n◦ 934.06 (AOAC, 1990) employing a
UK) and an analytical balance with an accuracy of ± 0.0001 g (CHYO, Jex120, Kyoto, Japan). Crude protein content was determined using the Kjeldahl method with a conversion factor of 6.25 (AOAC no. 960.52). Lipid content was analyzed gravimetrically following Soxhlet extraction (AOAC no. 960.39). Crude fiber was estimated by acid/alkaline hydrolysis of insoluble residues (AOAC no. 962.09). Crude ash was estimated by incineration in a muffle furnace (Felisa, 360D) at 550°C (AOAC no. 923.03). All methodologies followed the recommendations of Official Method of Analysis (AOAC, 1990), and all the analyses were made in triplicate.
Moisture desorption isotherm
The desorption isotherm of the rat feed was determined at 60ºC. The methodology consisted in taking a known mass of sample (in triplicate) and allowing it come into equilibrium with an atmosphere produced by a saturated salt solution having a known relative humidity within a sealed container. This method was recommended by the European Project COST 90 (Spiess and Wolf, 1983). The weight of the samples was taken every 15 days until reaching constant weight (equilibrium condition). The salts used to obtain a range of water activity between 0.10 and 0.95 included LiCl, KC2H3O2, MgCl2, K2CO3, NaNO2,
KI, NaCl and KNO2 (Labuza et al., 1985). All
containers with solutions producing relative humidity greater than 75% were added separately a Thymol solution which inhibited the development of fungi in the system (Vega-Gálvez et al., 2008). The model used for the prediction of the equilibrium moisture content of rat feed was
the equation proposed by Guggenheim, Anderson and de Boer, commonly termed GAB (equation 1) (Tolaba et al., 2004; Ait Mohamed et al., 2005).
) )
1 ( 1 ( ) 1
( w w
w m
we
a k C a
k
a k C X X
⋅ ⋅ − + ⋅ ⋅ −
⋅ ⋅ ⋅
= (1)
where Xwe is the equilibrium moisture content (g
water/g dm,), aw is the water activity
(dimensionless) and Xm monolayer moisture
content (g water/g dm,).
Experimental determination of drying curves
The drying experiments were carried out using a convective dryer designed and built in the Department of Food Engineering of Universidad de La Serena (Fig. 1). Five temperatures were used in the study of the drying kinetics (50, 60, 70, 80 and 90ºC). The drying air flow rate was held constant at 2.0 ± 0.2 m/s and measured with an omnidirectional anemometer (Extech Instrument Inc., 451112, Waltham, USA). The inlet relative humidity was 67.6 ± 5.6%, measured by an ambient digital hygro-thermometer (Extech Instrument Inc., 445703, Waltham, USA). All the drying experiments were carried out in triplicate, using a sample mass of 9.4 ± 0.49 g and a load density of 1.9 ± 0.09 kg/m2. The mass was
measured on an analytical balance (Ohaus, SP402, New Jersey, USA) with an accuracy of ± 0.01 g at defined time intervals, connected by a system interface (Ohaus, RS232, New Jersey, USA) to a PC, which recorded and stored the data. The experiments were finished at the point of reaching constant weight (equilibrium condition). The dried samples were packaged in polypropylene bags.
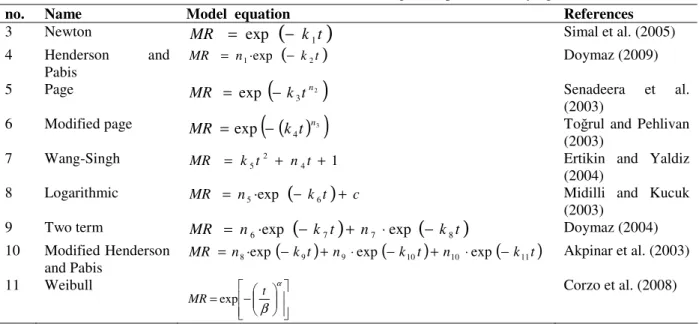
Mathematical modeling
To simulate the experimental drying curves, some mathematical models were used (Table 1). All these equations used the moisture ratio (MR) as dependent variable (equation 2), which related the gradient of the sample moisture content in real time with the initial moisture content and the equilibrium moisture content (Akpinar et al., 2003; Babalis and Belessiotis, 2004; Simal et al., 2005).
we wo we wt X X X X MR − − = (2)
where Xwt is the moisture content (g water/g dm,),
Xwo is the initial moisture content (g water/g dm,)
and Xwe is the equilibrium moisture content (g
water/g dm,)
The Arrhenius-type equation was used to evaluate the dependence with the temperature on the empirical parameters ki (i = 1, 2,…,11), ni (i = 1, 2,
…, 10), c, α and β, from which the activation
energy (Ea) was determined.
−
=Y E RT
Y a
o·exp (12)
where Y is the parameter to be studied, Yo is the
Arrhenius factor, R is the universal gas constant (8.314 J/mol K) and T is the absolute temperature (K).
Statistical tests
The fit quality of the experimental data to all models was evaluated using determination coefficient (r2, equation 13), sum square errors
(SSE, equation 14) and Chi-square (χ2, equation
15) (Akpinar, 2006; Hayaloglu et al., 2007). The Statgraphics Plus® 5.1 software (Statistical Graphics Corp., Herndon, USA) was used to estimate statistically significant differences among samples, applying analysis of variance (ANOVA) for a confidence level of 95% (P value < 0.05) (Vega- Gálvez et al., 2008). This analysis was carried out to estimate if there were least significant differences (LSD) among the means of the kinetic and empirical parameters of all the models. The multiple range test (MRT) was used to determine if there were possible homogeneous groups among the parameters.
(
)
(
)
∑
∑
= = − − = N j ei ei N j ei ci MR MR MR MR r 1 2 1 2 2 (13)(
)
21 1
∑
= − = N j ci ei MR MR N SSE (14)(
)
z N MR MR N j ci ei − − =∑
=1 2 2 χ (15)where MRei is the experimental moisture ratio (g
water/g dm,), MRci is the calculated moisture ratio
(g water/g dm,), MRei is the average experimental
moisture ratio (g water/g dm,), N is the number of data values, z is the number of constants and j is the number of terms.
RESULTS AND DISCUSSION
Raw material and Physico-chemical analysis
Proximate analysis of the mixture (quinoa and rats feed) presented an initial moisture content of 70.05 ± 0.02 g/ 100 g dm.; crude protein (nitrogen x 6.25) of 6.82 ± 0.01 g/ 100 g dm.; total lipids of 5.30 ± 0.01 g/ 100 g dm..; crude fiber of 3.36 ± 0.01 g/100 g dm; crude ash of 1.65 ± 0.03 g/100 g dm.; and available carbohydrates (by difference) of 11.81 ± 0.05 g/100 g dm. Proximate analysis of quinoa seeds can be found in previous work (Miranda et al., 2010).
Moisture desorption isotherm
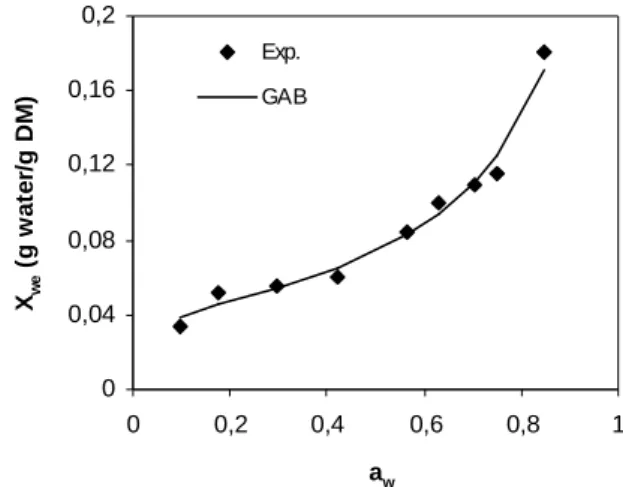
mentioned temperature. The values of GAB-parameters were 0.04 (g water/g dm,), 0.89 and 60.94 for Xm, k and C, respectively. The parameter
C was related to the upper and first sorption layers;
and k could represent the interaction energies between multilayer properties with respect to bulk liquid (Erbas et al., 2005).
0 0,04 0,08 0,12 0,16 0,2
0 0,2 0,4 0,6 0,8 1
aw
Xw
e
(
g
w
a
te
r/
g
D
M
)
Exp. GAB
Figure 2 - Desorption isotherm of rats feed modeled by the GAB equation at 60 ºC.
The monolayer moisture content value was lower when comparing to those reported in other works for quinoa seeds (0.087-0.059 g water / g dm, 20-40ºC, Tolaba et al. ,2004); pea seeds (0.091-0.059 g water / g dm, 25-50ºC, Chen, 2003) and amaranth grains (0.063-0.049 g water / g dm., 40-70ºC, Calzetta et al., 2004).
Considering Figure 2 and the value obtained for parameter C, this isotherm could correspond to the type II according to Van der Waals classification (Erbas et al., 2005). According to the statistical tests, the GAB equation gave a good fit to the experimental moisture data (r2= 0.94; SSE=
2.24x10⁻⁴ and χ2= 3.20x10⁻⁴), demonstrating the
ability of this model for predicting sorption data.
Mathematical modeling of drying curves
Figure 3 shows the experimental drying curves for the five working temperatures (50, 60, 70, 80 and 90ºC). All curves showed a clear exponential tendency and as the air-drying temperature increased, MR decreased rapidly. As expected, it was observed that the drying time decreased as temperature increased to reach similar moisture content. Similar drying behavior was reported by Vega-Gálvez et al. (2009) working with quinoa and Guiné et al. (2006) with chestnut.
For example, the time required to achieve a moisture content lower than 0.02 g water/g dm at
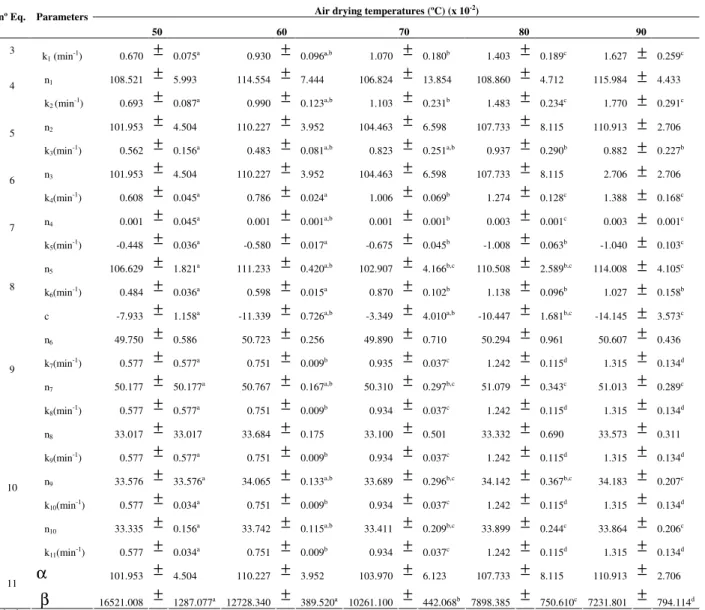
50ºC was 600 minutes, which was approximately twice the time necessary to reach the same moisture content at a temperature of 70ºC (300 minutes), and nearly three times for a temperature of 80ºC and 90ºC (240 minutes). These results were similar to those reported by Doymaz (2009) and Karabulut et al. (2007), working with spinach leaves and kurut, respectively. Likewise, only the presence of the falling rate period was observed explaining the use of the empirical models presented in Table 1. Table 2 shows the average values and standard errors of the parameters ki (i =
1, 2, …, 11), ni (i = 1, 2, …, 10), c, α and β,
obtained for all proposed models. The parameters ki increased as drying temperature increased.
Similar relatively high values for ki and ni were
reported by Vega-Galvez et al. (2009) working with quinoa when applying the same mathematical models of the present study and Duran et al. (2008) working with dried cereal.
From the ANOVA carried out to the parameters ki
(i = 1, 2, …, 11), ni (i = 1, 2, …, 10), c, α and β of
the proposed models for a confidence level of 95%, a P value < 0.05 was obtained for all of them, except for n1, n2, n3, n6, n8 and α. This
showed that there was statistically significant difference, and thus dependence on the drying temperature for most of these kinetic parameters, except for n1, n2, n3, n6, n8 and α. The
showed dependence on temperature, resulting in an activation energy of 21.37 (k1), 22.27 (k2),
15.29 (k3), 20.91 (k4), 43.48 (n4), 21.87 (k5), 20.85
(β), 1.21 (n5), 66.98 (k6), 9.85 (c), 21.04 (k7), 0.38
(n7), 21.04 (k8), 21.04 (k9), 0.39 (n9), 21.04 (k10),
21.04 (n10), 21.04 (k11) kJ/mol. The parameters n1,
n2, n3, n6, n8 and α (P value >0.05) probably
depended rather on the characteristics of the tissue and/or the drying air rate (Mwithiga and Olwal, 2004).
0,0 0,2 0,4 0,6 0,8 1,0
0 100 200 300 400 500 600
Time (min)
M
R
Figure 3 - Experimental drying curves of rats feed for the five working temperatures
(ºC). ♦= 50 ºC; ■= 60 ºC; ▲=70ºC; X = 80ºC and =90 ºC.
Table 1 - Mathematical models available in literature for simulating the experimental drying curves of rats feed
no. Name Model equation References
3 Newton MR = exp
(
− k1t)
Simal et al. (2005)4 Henderson and
Pabis ( )
t k n
MR = 1·exp − 2 Doymaz (2009)
5 Page
(
2)
3
exp n
t k
MR = − Senadeera et al.
(2003)
6 Modified page
(
( )
3)
4
exp n
t k
MR = − Toğrul and Pehlivan
(2003)
7 Wang-Singh 2 4 1
5 + +
= k t n t
MR Ertikin and Yaldiz
(2004)
8 Logarithmic MR = n5·exp
(
− k6t)
+ c Midilli and Kucuk(2003)
9 Two term MR = n6·exp
(
− k7t)
+ n7 ⋅exp(
− k8t)
Doymaz (2004) 10 Modified Hendersonand Pabis MR =n8·exp
(
−k9t)
+n9⋅exp(
−k10t)
+n10⋅exp(
−k11t)
Akpinar et al. (2003) 11 Weibull
− =
α
β t MR exp
Table 2-Values of the kinetic and empirical parameters of the proposed mathematical models for simulating the experimental drying curves of rats feed
a,b,c,dMeans with no common superscript differ significantly (P value< 0.0.
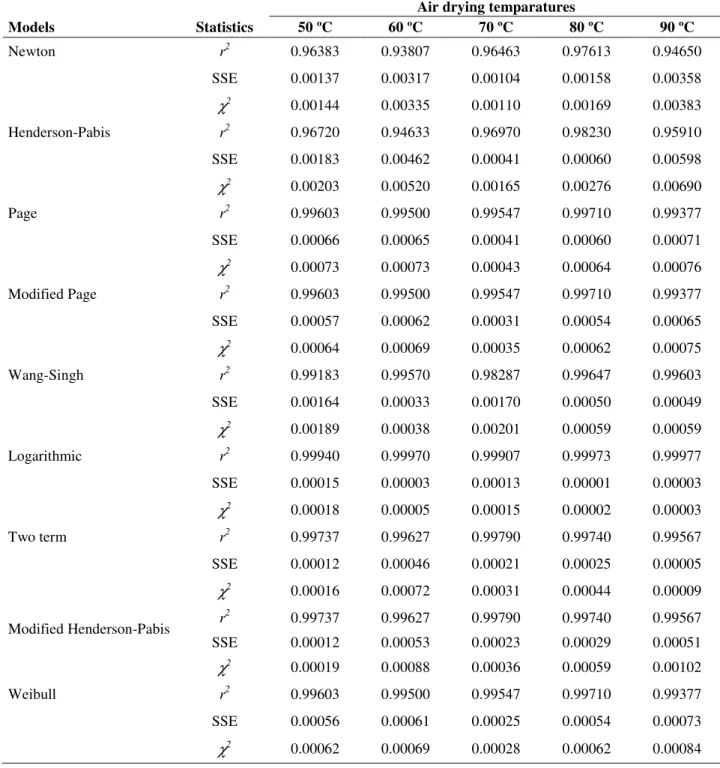
Statistical tests
Table 3 shows the results of statistical tests (r2,
SSE and χ2) applied to the proposed equations.
These statisticals evaluate the models fit quality of the experimental data and they have been used by other researchers in many food drying studies (Toğrul and Pehlivan, 2003; Doymaz, 2004;
Akpinar, 2006). In general, all proposed models showed a good fit with high values of r2 (r2>0.93)
and values close to zero for SSE and χ2. According
to the results, the model that best fitted the experimental data considering the regression coefficient (r2 ≥ 0.99) as the first criterion of
selection, was the Logarithmic model, followed by Two-Term, Modified Henderson-Pabis and
Weibull models. However, when evaluating the fit quality with the other two statisticals applied, the lowest values were obtained for SSE< 0.00015 and
χ2< 0.00018 for the Logarithmic model. Thus, if
the three statisticals applied were considered, the equation that best fitted the experimental moisture data was the Logarithmic model. This good fit quality on experimental data could be explained because the Logarithmic model presents three terms, which provided a better mathematical approximation on the drying curves with exponential tendency. Several studies have also presented similar results for the Logarithmic model during the drying process of, e.g. apple, spinach leaves, tomate and chestnut (Velić et al.,
Air drying temperatures (ºC) (x 10-2
) nº Eq. Parameters
50 60 70 80 90
3 k
1 (min-1) 0.670 ± 0.075a 0.930 ± 0.096ª,b 1.070 ± 0.180b 1.403 ± 0.189c 1.627 ± 0.259c
n1 108.521 ± 5.993 114.554 ± 7.444 106.824 ± 13.854 108.860 ± 4.712 115.984 ± 4.433
4
k2 (min-1) 0.693 ± 0.087a 0.990 ± 0.123a,b 1.103 ± 0.231b 1.483 ± 0.234c 1.770 ± 0.291c
n2 101.953 ± 4.504 110.227 ± 3.952 104.463 ± 6.598 107.733 ± 8.115 110.913 ± 2.706
5
k3(min-1) 0.562 ± 0.156a 0.483 ± 0.081a,b 0.823 ± 0.251a,b 0.937 ± 0.290b 0.882 ± 0.227b
n3 101.953 ± 4.504 110.227 ± 3.952 104.463 ± 6.598 107.733 ± 8.115 2.706 ± 2.706
6
k4(min-1) 0.608 ± 0.045a 0.786 ± 0.024a 1.006 ± 0.069b 1.274 ± 0.128c 1.388 ± 0.168c
n4 0.001 ± 0.045a 0.001 ± 0.001a,b 0.001 ± 0.001b 0.003 ± 0.001c 0.003 ± 0.001c
7
k5(min-1) -0.448 ± 0.036a -0.580 ± 0.017a -0.675 ± 0.045b -1.008 ± 0.063b -1.040 ± 0.103c
n5 106.629 ± 1.821a 111.233 ± 0.420a,b 102.907 ± 4.166b,c 110.508 ± 2.589b,c 114.008 ± 4.105c
k6(min-1) 0.484 ± 0.036a 0.598 ± 0.015a 0.870 ± 0.102b 1.138 ± 0.096b 1.027 ± 0.158b
8
c -7.933 ± 1.158a -11.339 ± 0.726a,b -3.349 ± 4.010a,b -10.447 ± 1.681b,c -14.145 ± 3.573c
n6 49.750 ± 0.586 50.723 ± 0.256 49.890 ± 0.710 50.294 ± 0.961 50.607 ± 0.436
k7(min-1) 0.577 ± 0.577a 0.751 ± 0.009b 0.935 ± 0.037c 1.242 ± 0.115d 1.315 ± 0.134d
n7 50.177 ± 50.177a 50.767 ± 0.167a,b 50.310 ± 0.297b,c 51.079 ± 0.343c 51.013 ± 0.289c
9
k8(min-1) 0.577 ± 0.577a 0.751 ± 0.009b 0.934 ± 0.037c 1.242 ± 0.115d 1.315 ± 0.134d
n8 33.017 ± 33.017 33.684 ± 0.175 33.100 ± 0.501 33.332 ± 0.690 33.573 ± 0.311
k9(min-1) 0.577 ± 0.577a 0.751 ± 0.009b 0.934 ± 0.037c 1.242 ± 0.115d 1.315 ± 0.134d
n9 33.576 ± 33.576a 34.065 ± 0.133a,b 33.689 ± 0.296b,c 34.142 ± 0.367b,c 34.183 ± 0.207c
k10(min-1) 0.577 ± 0.034a 0.751 ± 0.009b 0.934 ± 0.037c 1.242 ± 0.115d 1.315 ± 0.134d
n10 33.335 ± 0.156a 33.742 ± 0.115a,b 33.411 ± 0.209b,c 33.899 ± 0.244c 33.864 ± 0.206c
10
k11(min-1) 0.577 ± 0.034a 0.751 ± 0.009b 0.934 ± 0.037c 1.242 ± 0.115d 1.315 ± 0.134d
α 101.953 ± 4.504 110.227 ± 3.952 103.970 ± 6.123 107.733 ± 8.115 110.913 ± 2.706
11
2007; Doymaz, 2009; Sacilik, 2007; and Midilli and Kucuk, 2003).
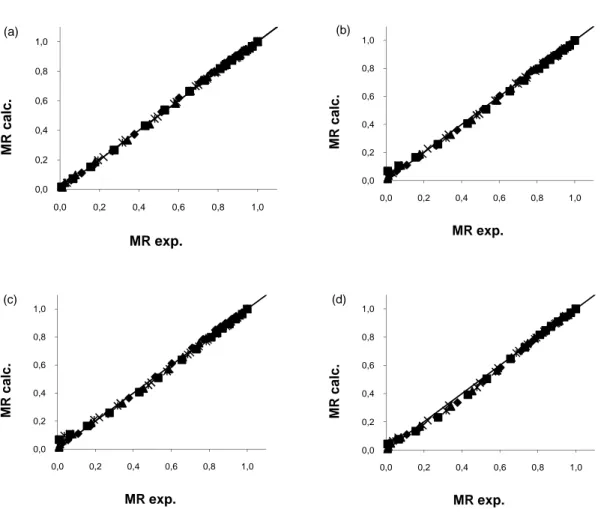
Figure 4 presented the experimental and calculated MR values for the Logarithmic model, which showed the best fit quality on experimental data
over the entire drying process. In the same figure, the Two-Term, Modified Henderson-Pabis and Weibull models are also plotted showing their goodness to the experimental curve fitting.
Table 3 - Statistical tests of the proposed model for each drying temperature
Air drying temparatures
Models Statistics 50 ºC 60 ºC 70 ºC 80 ºC 90 ºC
Newton r2 0.96383 0.93807 0.96463 0.97613 0.94650
SSE 0.00137 0.00317 0.00104 0.00158 0.00358
χ2 0.00144 0.00335 0.00110 0.00169 0.00383
Henderson-Pabis r2 0.96720 0.94633 0.96970 0.98230 0.95910
SSE 0.00183 0.00462 0.00041 0.00060 0.00598
χ2 0.00203 0.00520 0.00165 0.00276 0.00690
Page r2 0.99603 0.99500 0.99547 0.99710 0.99377
SSE 0.00066 0.00065 0.00041 0.00060 0.00071
χ2 0.00073 0.00073 0.00043 0.00064 0.00076
Modified Page r2 0.99603 0.99500 0.99547 0.99710 0.99377
SSE 0.00057 0.00062 0.00031 0.00054 0.00065
χ2 0.00064 0.00069 0.00035 0.00062 0.00075
Wang-Singh r2 0.99183 0.99570 0.98287 0.99647 0.99603
SSE 0.00164 0.00033 0.00170 0.00050 0.00049
χ2 0.00189 0.00038 0.00201 0.00059 0.00059
Logarithmic r2 0.99940 0.99970 0.99907 0.99973 0.99977
SSE 0.00015 0.00003 0.00013 0.00001 0.00003
χ2 0.00018 0.00005 0.00015 0.00002 0.00003
Two term r2 0.99737 0.99627 0.99790 0.99740 0.99567
SSE 0.00012 0.00046 0.00021 0.00025 0.00005
χ2 0.00016 0.00072 0.00031 0.00044 0.00009
r2 0.99737 0.99627 0.99790 0.99740 0.99567
Modified Henderson-Pabis
SSE 0.00012 0.00053 0.00023 0.00029 0.00051
χ2 0.00019 0.00088 0.00036 0.00059 0.00102
Weibull r2 0.99603 0.99500 0.99547 0.99710 0.99377
SSE 0.00056 0.00061 0.00025 0.00054 0.00073
0,0 0,2 0,4 0,6 0,8 1,0
0,0 0,2 0,4 0,6 0,8 1,0
M
R
c
a
lc
.
MR exp.
(a)
0,0 0,2 0,4 0,6 0,8 1,0
0,0 0,2 0,4 0,6 0,8 1,0
M
R
c
a
lc
.
MR exp.
(b)
0,0 0,2 0,4 0,6 0,8 1,0
0,0 0,2 0,4 0,6 0,8 1,0
M
R
c
a
lc
.
MR exp.
(c)
0,0 0,2 0,4 0,6 0,8 1,0
0,0 0,2 0,4 0,6 0,8 1,0
M
R
c
a
lc
.
MR exp.
(d)
Figure 4 - Comparison of the experimental and predicted moisture ratios by (a) Logarithmic (b) Two-Term, (c) Modified Henderson-Pabis and (d) Weibull models for rats feed. ♦= 50
ºC; ■= 60 ºC; ▲=70ºC; X = 80ºC and =90 ºC.
CONCLUSIONS
The drying characteristics of quinoa-supplemented rat feed at different temperatures were studied in this work. The desorption isotherm showed a sigmoidal shape, which gave a good fit for the experimental data using GAB equation (r2= 0.94;
SSE= 2.24x10⁻⁴ and χ2= 3.20x10⁻⁴). The drying
curves showed a clear exponential tendency. An increase of the drying temperature from 50 to 90ºC decreased in one third the drying time (from 600 to 240 minutes). All the kinetic parameters of the proposed models showed positive dependence on temperature, except for n1, n2, n3, n6, n8 and α.
According to the statistical tests applied, the Logarithmic model gave the best fit for the experimental data, with r2≥ 0.994, SSE< 0.00015
and χ2< 0.00018 indicating that this model was the
most suitable to simulate the product drying rates under the process conditions presented. This study corresponds to the first stage for evaluating quinoa as rat feed supplement. However, more accurate studies are necessary in relation to the influence of temperature on the nutritional value of this food supplement.
ACKNOWLEDGEMENTS
REFERENCES
Alpinar, E.K.; Bicer, Y.; Yildiz, C. (2003), Thin layer drying of red pepper. J. Food Eng., 55, 99-104. Akpinar, E.K. (2006), Determination of suitable thin
layer drying curve model for some vegetables and fruits. J. Food Eng., 73(1), 75-84.
Ait Mohamed L.; Kouhila, M.;. Lahsasni, S.; Jamali, A.; Idliman, A.; Rhazi, M. (2005), Equilibrium moisture content and heat of sorption of Gelidium sesquipedale. J. Products Res., 41(2), 199-209. AOAC (1990), Official method of analysis. 15th Ed.
Association of Official Analytical Chemists. Washigton, USA.
Amekbungwan, A. (2007), Application of tropical legumes for pig food. Anim. Sci. J., 78, 342-350. Babalis, S.J; Belessiotis, V.G. (2004), Influence of the
drying conditions on the drying constants and moisture diffusivity during the thin-layer drying of figs. J. Food Eng., 65, 449-458.
Benevenga, N.J.; Calver C.; Eckhert, C.D.; Fahey, G.C.; Greger, J.L.; Keen, C.L.; Knapka, J.L.; Magalhaes, H.; Oftedal, O. (1995), Nutrient Requirements of Laboratory Animals. 4nd ed. National Academy Press, Washington, D.C.
Bhargava, A.; Shukla, S.; Ohri, D. (2006), Chenopodium quinoa-An indian perspective. Industrial Crops and Prod., 23, 73-87.
Brady, K., HO, C.T.; Rosen, R.T.;Sang, S.; Karwe. M.V. (2007), Effects of processing on the nutraceutical profile of quinoa. Food Chem., 100, 1209-1216.
Calzetta, A.N, Aguerre, R.T.; Suarez, C. (2004), Drying characteristics of amaranth grain. J. Food Eng., 65, 197-203.
Crapiste, G.H. (2000), Simulation of drying rates and quality changes during dehydration of foodstuffs. In: J. E. Lozano, M.C. Añón, E. Parada Arias, and G.V. Barbosa-Cánovas (eds.), Trends in Food Eng., pp. 135-148. Technomic Publishing Co., Inc.
Chen, C. (2003), Moisture sorption isotherms of pea seeds. J. Food Eng., 58, 45-51.
Corzo, O.; Bracho, N.; Pereira, A.; Vásquez, A. (2008), Weibull distribution for modeling air drying of coroba slices. LWT - Food Sci. Tech., 41, 2023-2028 Coulter, L.A.; Lorenz, K. (1991), Extruded corn grits-quinoa blends. J. Food Process. Preser., 15(4), 231-242.
Di Scala, K.C., Crapiste, G.H. (2008), Drying kinetics and quality changes during drying of red pepper. LWT- Food Sci. Tech., 41(5), 789-795.
Doğan, H, Karwe, M.V. (2003), Physicochemical
Properties of Quinoa Extrudates. Food Sc. Tech. Inter., 9 (2), 101-114.
Doymaz, I. (2004), Drying kinetics of white mulberry. J. Food Eng., 61, 341-346.
Doymaz, I. (2009), Thin-layer drying of spinach leaves in a convective dryer. J. Food Process Eng., 32 (1), 112-125.
Duran, A., Hayaloglu, A.A.; Karabulut, A. (2008), Thin Layer Dring Characteristics of Eriste: A dried Cereal Producto d Turkey. Int. J. Food Eng., 4(2), article 7. Erbas, M.; Ertugay, M.F.; Certel, M. (2005), Moisture
adsorption behavior of semolina and farina. J. Food Eng., 69, 191-198.
Ertekin, C.; Yaldiz, O. (2004), Drying of eggplant and selection of a suitable thin layer drying model. J. Food Eng., 63, 349–359.
Gely, M.C, Santalla, E.M. (2009), Moisture diffusivity in quinoa (Chenopodium quinoa Willd.) seeds: Effect
of air temperature and initial moisture content of seeds. J. Food Eng., 78, 1029-1033.
Guiné, R.P.F.; Fernandes, R.M.C. (2006), Analysis of the drying kinetics of chestnuts. J. Food Eng., 76, 460-467.
Hanczakowski, P.; Skraba, B. (2006), The nutritive value of native and modified lucerne juice for rats, J. Sci. Food Agric., 45 (1), 9 – 19.
Hayaloglu, A.A.; Karabulut, I.; Alpaslan, M.; Kelbaliyev, G. (2007), Mathematical modeling of drying characteristics of strained yoghurt in a convective type tray-dryer. J. Food Eng., 78, 109 -117.
Howard, J.J., Brown, D.M.; Bunker, R.K.; Daly, M.J.; Dzau, V.J.; Goodman, A.; Koike, G.; Kren, V.; Kurtz, T.; Lernmark, Å.; Levan, G.; Mao, Y.; Pettersson, A.; Pravenec, M.; Simon, J.S.; Szpirer, C.; Szpirer, J.; Trolliet, M.R.; Winer, E.S.; Lander, E.S. (1995), A genetic linkage map of the laboratory rat, Rattus norvegicus. Nature Genetic, 9, 63-69.
Jørgensen, H.; Lindberg, J. E. (2006), Prediction of energy and protein digestibility in pig feeds using growing rats as a model. Anim. Feed Sci. Tech., 127, 55-71.
Karabulut, I.; Hayaloglu, A.A; Yildirim, H. (2007), Thin-layer drying characteristics of Kurut, a Turkish dried dairy by-product. In. J. Food Sci. Tech., 42,1080-1086.
Koziol, M.J. (1992), Chemical composition and nutritional evaluation of quinoa (Chenopodium quinoa Willd.). J. Food Com. Anal., 5, 35-68.
Labuza, T.A.; Kaanane, L.; Chen, J.Y. (1985), Effect of temperature on the moisture sorption isotherm and water activity shift of two dehydrated food. J. Food Sci., 50,392-396.
Miranda, M.; Vega-Gálvez, A.; López, J., Parada, G.; Sanders, M., Aranda, M.; Uribe, E.; Di Scala, K. (2010), Impact of air-drying temperature on nutritional properties, total phenolic content and antioxidant capacity of quinoa seeds (Chenopodium quinoa Willd). Ind. Crops Prod., 32(3), 258-263.
Mwithiga, G.; Olwal, J.O. (2004), The drying kinetics of kale (Brassica oleracea) in a convective. J. Food Eng., 71,373-378.
Rashad, M.M.; Moharib, S.A. (2003), Effect of type and level of dietary fibre supplements in rats. Grasas y Aceites, 54(3), 277-284.
Rivera, P.H.; Peo, E.R.; Dale Flowerday, J.; Crenshaw, T.D.; Moser, B.D.; Cunningham, P.J. (1978), Effect of Maturity and Drying Temperature on Nutritional Quakity and Amino Acid Availability of Normal and Opaque-2 Corn for Rats and Swine. J. Anim. Sci., 46, 1024-1036.
Sacilik, K. (2007), The Thin-Layer Modelling of Tomato Drying Process. Agric. Cons. Sci., 72 (4), 343-349.
Sandeep, K.P.; Irudayaraj, J. (2001), Introduction to Modeling and Numerical Simulation. In: Irudayaraj J (ed), Food Processing Operations Modeling, Design and Analysis, pp. 25-36. Marcel Dekker, Inc. New York.
Senadeera, W.; Bhandari, B.R.; Young, G.; Wijesinghe, Y.B. (2003), Influence of shapes of selected vegetable material son drying kinetics during fluidized bed drying. J. Food Eng., 58(3), 277-283. Sharma, P.; Singh, R.R.B.; Singh, A.K.; Patel, A.A.;
Patil, G.R. (2009), Sorption isotherms and thermodynamics of water sorption of ready-to-use Basundi mix. LWT- Food Sci. Tech., 42, 441–445. Simal, S; Femenía, A.; Garau, M.C. Roselló, C. (2005).
Use of exponential, Page’s and diffusional models to simulate the drying kinetics of kiwi fruit. J. Food Eng., 43, 109-114.
Spiess, W., Wolf, W. (1983), The results of the COST 90 project on water activity. In Physical Properties of Foods, (R. Jowitt et al., Eds) pp.65, Applied Science Publisher, London.
Taylor, J.B.; Finley, J.W.; Caton, J.S. (2005), Effect of the chemical form of supranutritional selenium on selenium load and selenoprotein activities in virgin, pregnant, and lactating rats. J. Anim. Sci., 83, 422-429.
Tolaba, M.P.; Peltzer, M.; Enriquez, N.; Pollio.. M.L. (2004), Grain sorption equilibria of quinoa grains. J. Food Eng., 61(3), 365-371.
Toğrul I.T.; Pehlivan, D. (2003), Modeling of drying
kinetics of simple apricot. J. Food Eng., 58, 23-32. Van Dam P.S.; Bravenboer, B.; Van Asbeck, B.S.;
Marx, J.J.; Gispen, W.H. (1999), High rat food vitamin E content improves nerve function in streptozotocin-diabetic rats. Eur. J.Pharm., 376(3), 217-22.
Vega-Gálvez, A.; Lemus-Mondaca, R.; Bilbao-Sáinz, C.; Yagnam, F.; Rojas, A. (2008), Mass transfer kinetics during convective drying of red pepper var. Hungarian (capsicum annuum L.): Mathematical
modeling and evaluation of kinetic parameters. J. Food Proc. Eng., 31, 120–137.
Vega-Gálvez, A.; San Martín, R.; Sanders, M.; Miranda, M.; Lara, E. (2010), Characteristics and Mathematical Modeling of convective drying of Quinoa (Chenopodium quinoa Willd.): Influence of
temperature on the kinetic parameters. J. Food Proc. Pres., 34(6), 945-963.
Velić, D.; Bilić, M.; Tomas, S.; Planinić, M.; Bucić
-Kojić, A.; Jokić, S. (2007), Study of the Drying
Kinetic of “Granny Smith” Apple in Fluid Bed Dryer. Agric. Cons. Sci., 72 (4), 329-334.