FOR FORECASTING TIME SERIES: USE OF TIME
INDEX
PAULA ODETE FERNANDES Department of Economics and Management
School of Technology and Management (ESTiG), Polytechnic Institute of Bragança Apartado 134, 5301-857 Bragança, Portugal
JOÃO PAULO RAMOS TEIXEIRA Department of Electrical Engineering
School of Technology and Management (ESTiG), Polytechnic Institute of Bragança Apartado 134, 5301-857 Bragança, Portugal
In previous publications, the authors reported their work with the artificial neural networks (ANN) methodologies for the forecast of guest nights in hotels time series. The ANN methodology has made predictions more accurate than other methodologies [1, 5]. However, as a consequence of the tourism demand increase in the last years these time series registered an unusual increase in its values. Considering that the ANN methodology uses the past to predict the future in a statistically way, it became very difficult for the ANN to predict numbers never seen before in the past. The authors report in this paper a new approach of the ANN methodology using the time in its input instead of the previous 12 registered observations, as usually used. The authors intend to capture the time variation of the series along the years, and use this parameter as the input. The paper presents a comparison between the classic usage of the ANN methodology with a new modulation using the years and month in the input. The new modulation consists in four variations of the input of the ANN: A - just month; B - year and month; C - a combination of A and classic model and D - a combination of B and classic model. The models B and D improved the forecasting performance over the classic model, with a mean relative error of 5.98% and 5.79% in the test set, against the 6.36% for the classic model.
1. Introduction
The paper proposes a new approach of ANN methodology to predict time series.
The time series used was the “Monthly Guest Nights in Hotels” in the north of
Portugal, registered between January 1987 and December 2007. For the selection of data we used the secondary source published in the Portuguese National Statistical Institute (INE). This time series was used because is similar to the series of other regions concerning the difficulty presented for ANN
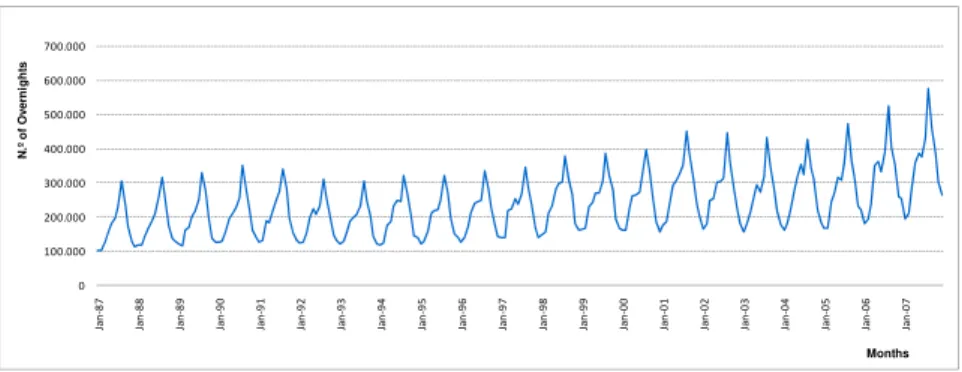
forecast models consisting in the high values of last year never registered in previous years. Figure 1 displays the values of the time series.
0 100.000 200.000 300.000 400.000 500.000 600.000 700.000 Ja n ‐ 87 Ja n ‐ 88 Ja n ‐ 89 Ja n ‐ 90 Ja n ‐ 91 Ja n ‐ 92 Ja n ‐ 93 Ja n ‐ 94 Ja n ‐ 95 Ja n ‐ 96 Ja n ‐ 97 Ja n ‐ 98 Ja n ‐ 99 Ja n ‐ 00 Ja n ‐ 01 Ja n ‐ 02 Ja n ‐ 03 Ja n ‐ 04 Ja n ‐ 05 Ja n ‐ 06 Ja n ‐ 07 N .º of O v e rni ght s Months
Figure 1. Monthly Guest Nights in the North region of Portugal, from 1987:01 to 2007:12.
The time series has a clear seasonality with a period of one year and the higher pick in August, and a behavior that oscillates until 1997, than has an increasing until 2001, followed by a decrease until 2004 and a severe increase after 2005. Several economic and political factors, such as EXPO98, city of Porto was the European Capital of Culture in 2001, EURO 2004, and a promotion of the region contributed to these variations.
The increase registered in the last years for values never seen in the time series rises a difficulties for the ANN forecast models due to its typically architecture. Typically the ANN forecasting models, called classic model, have in entrance values registered in previous months, usually the last 12 months, but also a combination of last 14 months [1]. This type of input is enable to follow the tendency over years, because has no reference for longer time tendencies. A typical classic ANN forecasting model used by the authors in previous forecasting time series is used in this work as a reference to compare the new proposal models with time index.
The so called classic model consist in one feed-forward ANN with 12 nodes in entrance (last 12 months), 6 nodes in hidden layer and 1 node in output layer
(forecast value). The ANN has the tangent sigmoid functionin the hidden layer
and a linear function in the output layer, and was trained with Levenberg-Marquardt backpropagation algorithm [2, 3].
2. Time Index Models
2.1. Models Description
In order to catch the oscillation tendency of the time series over time, an index time variable was used in the input models.
Four models were conceived an experimentally tested:
• Model A (just month) - the input consist in the number of the month,
numbered from 1 until 252 in a chronological order. The output is the observed value of the time series of the corresponding month. It is expected that the ANN has a complex structure to catch seasonality with a period of 12 and the tendency, therefore the number of the nodes in the hidden layer should be large enough. Some values between 20 and 200 were tested and finally the number of 100 hidden nodes was used. A logistic and linear activation functions were used in hidden and output layers, respectively. Levenberg-Marquardt backpropagation training algorithm was used.
• Model B (year and month) - the input consist in the number of the year
(numbered between 1 and 21 in a chronological order ); and the number of the month in the year, number from 1 (January) to 12 (December). The output is the observed value of the time series of the corresponding month/year. The seasonality is given by the month and the tendency is given by the year. The structure also should catch the values of the output (not used in input, and only seen in training process). The number of 20 nodes in the hidden layer was experimentally optimized. A logistic and linear activation functions were used in hidden and output layers, respectively. Levenberg-Marquardt backpropagation training algorithm was used.
• Model C (a combination of model A and classic model) - the input consist in
the 12 previous observed values in the time series and the number of the month, as in model A. It is expected that the 12 observed values give the seasonality and the month number the tendency. The number of 16 nodes in the hidden layer was experimentally achieved. A logistic and linear activation functions were used in hidden and output layers, respectively. Levenberg-Marquardt backpropagation training algorithm was used.
• Model D (a combination of model B and classic model) - the input consist in
the 12 previous observed values in the time series and the year and month as described in the model B. It is expected that the 12 observed values and the month number give the seasonality and the year number the tendency. The number of 16 nodes in the hidden layer was experimentally achieved. A logistic and linear activation functions were used in hidden and output layers, respectively. Levenberg-Marquardt backpropagation training algorithm was used.
1
1 n
i i
i i
T P
MRE
n = T
−
=
∑
[1]with: Pi, Predicted value for month i and Ti, Target value for month i.
2.2. Segmentation of Time Series
The time series was segmented in three sets: training, validation and test. The test set consists in the 12 months of the year 2007 and was used for measure the performance of the models with data not seen in the training process. Using the classic ANN models, it is difficult to forecast these data, due to their high values that were never used in the training process. The validation set is composed by 12 months of the year 2006 and was used to early stop the training process by cross validation. The other data was used in the training set for training the ANN. For the models with the 12 previous values in the input (classic, C and D models) the training set start in January 1988. For the other two models the training set start in January 1987.
3. Models Performance Evaluation
Table 1 displays the mean relative error (MRE) for the classic model and for the four proposed models over the validation and test sets.
The overall models perform better over validation set than test set for two reasons: first the validation set was used under training process to select the best model under several training sessions and second the test set has higher values than validation set and therefore more distant to train set data.
Table 1. Comparison of Prediction Accuracies, in the validation and test sets.
Classic Model Model A Model B Model C Model D
MRE_Validation Set (%) 5.08 15.17 4.62 5.97 5.56
MRE_Test Set (%) 6.36 35.38 5.98 6.14 5.79
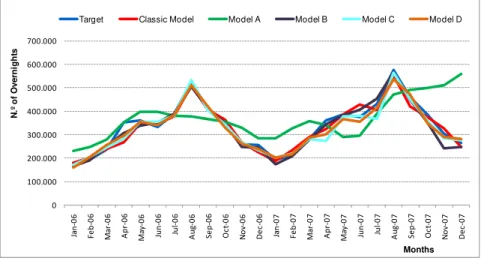
Figure 2 shows the target and predicted values with all developed models over validation and test sets.
Table 1 and Figure 2 denote that:
• The classic model, used as the reference, made a prediction with high
• the model A presents a very high MRE and therefore is not able to modeling the time series;
• Model C slightly improved the classic model performance, meaning that the
monthly index associated with other relevant features can be useful in the tourism demand modeling;
• Model B presented a very satisfactory performance considering only 2 nodes
in the entrance of the model. The model B can produce even better fitting than the classic model using 12 nodes in its entrance. This means that the ANN model B is able to modeling the time series and catch its seasonality and tendency, as expected by the authors;
• Model D combines the classic model and model B, and therefore it should
produce at least the same performance as the better one, and could even improve its performance. Table 1 shows that this model slightly improves the performance in the test set but not in validation set, meaning that it is still at a very satisfactory level as did the classic model and model B.
Excluding model A, all models follows the time series behavior with very high accuracy. 0 100.000 200.000 300.000 400.000 500.000 600.000 700.000 Jan ‐ 06 Fe b ‐ 06 Mar ‐ 06 Ap r ‐ 06 Ma y ‐ 06 Ju n ‐ 06 Ju l ‐ 06 Au g ‐ 06 Se p ‐ 06 Oc t ‐ 06 No v ‐ 06 De c ‐ 06 Jan ‐ 07 Fe b ‐ 07 Mar ‐ 07 Ap r ‐ 07 Ma y ‐ 07 Ju n ‐ 07 Ju l ‐ 07 Au g ‐ 07 Se p ‐ 07 Oc t ‐ 07 No v ‐ 07 De c ‐ 07 N .º of O v e rni ght s Months
Target Classic Model Model A Model B Model C Model D
Figure 2. Target and predicted values with classic model and models A, B, C and D over validation and test sets.
4. Conclusions
methodology using a time index variable (alone or not) in input in order to catch the seasonality and tendency oscillations.
Four variations (A - D) were experimented and three of them (B - D) produced satisfactory results, showing the novelty of the time index variable used in the entrance of the ANN models to predict time series of tourism demand.
Models C and D that combines the classic model with time index variables, slightly improve forecasting performance.
The model B result as the more interesting proposed one, because it has only two nodes in the entrance of the ANN, it has the ability to follow new higher picks and its performance can be better than the classic model one, as shown in previous section. It is expected that model B will make accurate predictions in future higher picks.
References
1. Fernandes, P. Odete. (2005). “Modelling, Prediction and Behaviour Analysis of
Tourism Demand in the North of Portugal”. Ph.D. Thesis in Applied Economy and Regional Analysis. Valladolid University - Spain.
2. Fernandes, Paula O. and Teixeira, João Paulo. (2008). “Previsão da Série
Temporal Turismo com Redes Neuronais Artificiais”. 5º Congresso Luso-Moçambicano de Engenharia - CLME’2008. Maputo-Moçambique.
3. Rumelhart, D. E. and McClelland, J. L.. (1986). “Parallel Distributed Processing:
Explorations in the Microstructure of Cognition”. Volume 1: Foundations. The Massachusetts Institute of Technology Press, Cambridge.
4. Lewis, C.D. (1982). “Industrial and Business Forecasting Method”. Butterworth
Scientific. London.
5. Fernandes, P. Odete; Teixeira, J. Paulo; Ferreira, João M.. and Azevedo, Susana
G.. (2008). “Modelling Tourism Demand: A Comparative Study between Artificial Neural Networks and the Box-Jenkins Methodology”. Romanian Journal of Economic Forecasting. No 5(3), pp. 30/50.
6. Fernandes, Paula O. and Teixeira, João Paulo. (2008). “Applying the Artificial
Neural Network Methodology to Tourism Time Series Forecasting”. Proceedings of 5th International Scientific Conference in ‘Business and Management’ 2008, ISBN:978-9955-28-267-9. Vilnius Gediminas Technical University. Lituânia.
7. Yu, Gongmei and Schwartz, Zvi. (2006). “Forecasting Short Time-Series Tourism
Demand with Artificial Intelligence Models”. Journal of Travel Research. No 45, pp. 194/203.
8. Pattie, Douglas C. and Snyder, John. (1996). “Using a neural network to forecast
visitor behaviour”. Annals of Tourism Research. Vol. 23, No 1, pp.151/1615.
9.Tsaur, Sheng-Hshiung; Chiu, Yi-Chang and Huang, Chung-Huei. (2002).