Procedia Technology 5 ( 2012 ) 445 – 454
2212-0173 © 2012 Published by Elsevier Ltd. Selection and/or peer review under responsibility of CENTERIS/SCIKA - Association for Promotion and Dissemination of Scientific Knowledge
doi: 10.1016/j.protcy.2012.09.049
CENTERIS 2012 - Conference on ENTERprise Information Systems / HCIST 2012 - International
Conference on Health and Social Care Information Systems and Technologies
Tourism Time Series Forecast - Different ANN Architectures
with Time Index Input
João Paulo Teixeira
a*, Paula Odete Fernandes
aaPolitechnic Institute of Bragança, Apartado 1134, Portugal
Abstract
Tourism demand is usually characterized by the time series of the “Monthly Number of Guest Nights in the Hotels”. Considering the increasing importance of this sector of activity, the prediction tools became even more relevant for public and private organizations management. Artificial Neural Networks (ANN) are a competitive model compared to other methodologies such the ARIMA time series models or linear models. In this paper the feedforward, cascade forward and recurrent architectures are compared. The input of the ANNs consists of the previous 12 months and two nodes used to the year and month. The three architectures produced a mean absolute percentage error between 4 and 6%, but the feedforward architecture behaved better considering validation and test sets, with 4,2% error.
© 2012 Published by Elsevier Ltd. Selection and/or peer-review under responsibility of CENTERIS/HCIST.
Keywords: Artificial Neural Network Architectures; Time series forecast; Tourism.
* Corresponding author. Tel.: +351 273 303129; fax: +351 273 313051.
E-mail address: [email protected].
1. Introduction
Several studies have been published in the field of tourism in recent years. The forecast of tourism demand has an important role to play in the planning, decision-making and controlling of the tourism sector Witt and Witt [1], Wong [2], Fernandes [3], Yu and Schwartz [4].
Tourism has been seen as an important sector in the Portuguese economy. Decision makers should adopt policies that ensure its profitability and sustainability, Dolgner and Costa [5]. It is a strategic interest for the Portuguese economy because of its ability to create wealth and employment. This sector shows competitive advantages as few other, MEI [6].
According to the World Tourism Organization (WTO), Portugal will achieve 18.3 million foreign visitors in 2020. Tourism is at present one of Portugal’s most important activities. Apart from its impact on the balance of payments and GDP, and its role on employment generation, investment and revenue, it is also recognized as an “engine” for development and other economic activities, WTO [7].
Similarly, the Northern region of Portugal is a very different region that offers an interesting alternative to so called 'mass tourism', focusing on the provision of a wide variety of tourism products that range from the beach, mountains, thermal/health spas and rural tourism, which has had a significant increase in recent years, Fernandes [3].
In this respect, and given the substantial growth of this sector in the North of Portugal, the development of models are needed to make reliable forecasts of tourism demand. This assumes an important role for the process of planning and decision-making both within the public and private sectors.
Currently there are a wide range of methods that have emerged in response to most situations, displaying different characteristics and methodologies ranging from the simplest linear regression model to more complex approaches. The Box-Jenkins forecasting models belong to the family of algebraic models known as ARIMA models, which make it possible to make forecasts based on a given stationary time series. The methodology considers that a real time series amounts to a probable realization of a stochastic process. The aim of this analysis is to identify the model that best depicts the underlying unknown stochastic process and a good representation of its realization, i.e. of the real-time series. The ANN methodology also has had countless applications in the most diverse areas of knowledge and has been used in the field of forecasting as an alternative to classical models.
In the present paper the research questions concerns with the choice of the best architecture for the ANN dedicated to the perdition of the time series “Monthly Number of Guest Nights in the Hotels of the North Region of Portugal”. In general ANN’s applications the feed-forward architecture performs better than others. In authors previous studies Fernandes [3] the feed-forward architecture has been used with success. Alternative architecture can improve the prediction? How the other architectures behave with this type of prediction?
The aim of current research consists of the search and highlights the best architecture of the Artificial Neural Networks methodology as an alternative to the classical models such as the Box-Jenkins methodology or the linear regression models for analysing tourism demand. The ANN methodology has aroused great interest in the field of economic and business sciences, since, from the research work undertaken so far, it can be seen to represent a valid alternative to classical forecasting methods for situations that are difficult to treat with classical methods, Thawornwong and Enke [8], Hill et al. [9], Hansen et al. [10]. To this end, each of the above-mentioned methodologies is centred on the treatment, analysis and modelling of the tourism time series: “Monthly Number of Guest Nights in the Hotels”. This time series is considered a significant indicator of tourist activity, since it provides information about the number of visitors in tourist facilities.
the input the additionally information about the year and the month. These time indexes already have proved their usefulness in this task. The different architectures consist of feedforward, cascade forward and recurrent architectures.
2. The time series - Monthly Number of Guest Nights in the Hotels of the North region of Portugal
The time series most used by the authors Fernandes [3], Fernandes and Teixeira [11] - [12], Teixeira and Fernandes [13] are the Monthly Number of Guest Nights in the Hotels in the region of North of Portugal. It will be used again as the object to compare the architectures of ANN models.
Fig. 1 displays the time series between January 1987 and December 2010, corresponding to 288 monthly observations over the 24-years’ period. The time series were provided by the Portuguese National Statistical Office (INE) INE [14].
The behaviour of the series indicates that there is seasonality (higher values during the summer months and lower values in winter). It is also clear that there is a progressive trend over the period in question. An increase from 1997 to 2001 is also apparent, and then there is a slight decrease until 2004, and then a significant growth from 2005 to 2009. The trend is a result of economic growth and investment in the tourism sector, which have occurred in northern Portugal in recent years. However, this trend apparently is not linear. This increase may be the result of investments made in marketing variables that promoted the region both nationally and internationally. Namely, in 1998 Lisbon hosted the World Exposition 1998. It was an official World’s fair from 22 of May to 30 September 1998. The theme of the fair, “the Oceans, a Heritage for the Future”, was chosen to commemorate the 500 years of Portuguese discoveries. Expo’98 received around 11 Million visitors in 132 days, 155 countries and organizations were presented. Although Lisbon is outside the North region of Portugal, it is reasonable to consider an increase in the tourism demand also in the North region during the exposition. In 2001 the city of Oporto was designated the European Culture Capital. Oporto is the second largest city of Portugal and belongs in the North region. In 2004, Portugal hosted the EURO 2004, the 2004 UEFA European Football Championship, a quadrennial tournament of European National Teams. Five of the ten stadiums were located in the North region. The tournament occurred between 12 June and 4 July. Although the number of overnights in 2004 suffered a decrease, it is believed that the external image of Portugal and its organization capacity was improved, contributing to future incomes of tourists.
Fig. 1. Monthly Number of Guest Nights in the Hotels in the North region of Portugal 0
100.000 200.000 300.000 400.000 500.000 600.000 700.000
Jan
-87
Jan
-88
Jan
-89
Jan
-90
Jan
-91
Jan
-92
Jan
-93
Jan
-94
Jan
-95
Jan
-96
Jan
-97
Jan
-98
Jan
-99
Jan
-00
Jan
-01
Jan
-02
Jan
-03
Jan
-04
Jan
-05
Jan
-06
Jan
-07
Jan
-08
Jan
-09
Jan
-10
Overn
ig
h
ts
2.1. Training, Validation and Test Sets
The input of the ANN model is the previous 12 months in the time series. The 12 months of the year of 1987 was used only as the input for further months. The remaining data of the time series was divided for the training, validation and test sets. The training set corresponded to the period between January 1988 and December 2008, in a total of 252 input/output pairs. The validation set corresponded to the 12 months of the year 2009 and was used to stop training early by a cross validation process. The test set corresponds to the 12 months of the year of 2010 was used to measure the performance of the ANN with a set of data not seen during the training process.
3. The Artificial Neural Network Models
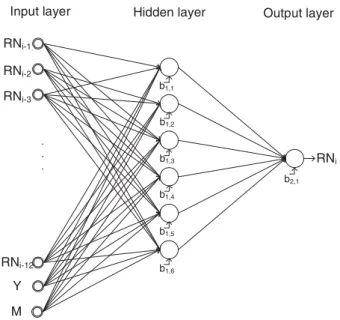
A neural network is composed of a set of interconnected artificial neurons, nodes, perceptrons or a group of processing units, which process and transmit information through activation functions. The functions most frequently used are the linear and the sigmoidal functions - the logistic and hyperbolic tangent functions, Fernandes [3], Bishop [15], Haykin [16], Rumelhart and McClelland [17]. The neurons of a network are structured in layers (Fig. 2). The most commonly used for the forecasting of time series is the multilayer perceptron or MLP, Bishop [15]. The nodes of one layer are connected to the nodes of the next layer to which they can send information. The connections between nodes i and j of previous and following layers are associated with a weight Wij. Each neuron also has a bias bi associated with it. Depending on the way in which the different layers are linked, networks can be classified as either feedforward, cascade forward, recurrent and radial networks, Haykin [16].
Fig. 2. Connection of neurons in a multilayer ANN
The specification of the neural network also includes an error function and an algorithm to determine the value of the parameters that minimize the error function.
Output layer
. . .
Input layer Hidden layer
RNi-1
RNi-2
RNi-3
RNi-12
Y
RNi
b2,1
b1,1
b1,2
b1,3
b1,4
b1,5
b1,6
For an ANN to learn it has to be trained to minimize the performance function by adjusting the matrix of weights Wij of the connections and the neuron bias bi.
The variants of the backpropagation algorithm most commonly used are Levenberg-Marquardt, Hagan and Menhaj [18], Marquardt [19] or Resilient backpropagation Riedmiller and Braun [20].
3.1. Common Background
In order to have the same conditions in the comparison of the architectures, the input and output was considered the same. Concretely, the input consisted of the previous 12 months of the time series plus 2 inputs for the year and the Month. The year is a sequence between 1 and 24 for the years between 1987 and 2010. The month is a value between 1 and 12 for month between January and December. The output consists of one node with the predicted value for the next month in the time series.
In the architecture types where a fixed number of nodes in the hidden layer were defined previously, 6 nodes were used. This is the case for feedforward, cascade forward and recurrent architectures.
The input and number of nodes in the hidden layer were based on previous studies where these parameters were optimized using feedforward ANN, Fernandes [3], Fernandes and Teixeira [11] - [12], Teixeira and Fernandes [13].
The experiment was developed with Matlab, Demuth and Beale [21].
Except in the Radial architecture, all other architectures were trained 50 times. The best performance in the validation set was selected.
3.2. Feedforward Architecture
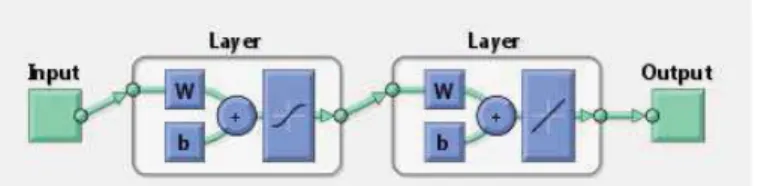
This architecture is the most commonly used in artificial intelligence problems because it usually can solve problems that other architectures cannot. Also, in previous studies by the authors, it was always this architecture that was used. Fig. 3 presents the general architecture of this ANN. This architecture has the common background of the 12 nodes for input, 6 nodes in the hidden layer and one node in the output. The activation function in the nodes of the hidden layer is the hyperbolic tangent. The output layer has a linear function as its activation function. The ANN was trained with the Levenberg-Marquardt backpropagation algorithm, Hagan and Menhaj [18], Marquardt [19].
Fig. 3. Feedforward architecture of the ANN 3.3. Cascade Forward Architecture
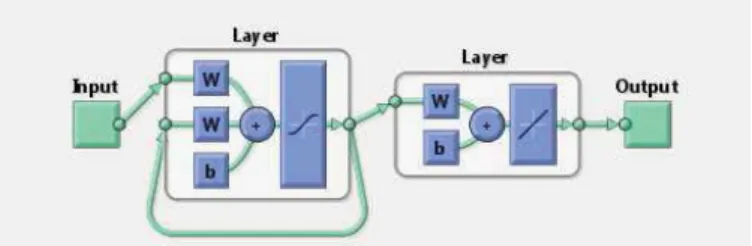
This architecture, very rarely used, is similar to feedforward but has an additional connection between the input nodes and output layer, as depicted in Fig. 4.
Fig. 4. Cascade forward architecture of the ANN
3.4. Elman Recurrent Architecture
This architecture, Fig. 5, is recurrent because there is backward connection between the output of the hidden layer and its input. The delay in this connection stores values from the previous time step, which can be used in the current time step. Because the network can store information for future reference, it is able to learn temporal patterns as well as spatial patterns. The output layer is simply a linear layer that receives the output of the recurrent layer. The hidden layer has the hyperbolic tangent activation function. The ANN also has 12, 6 and 1 nodes in the input, hidden and output layers, respectively. The Levenberg-Marquardt training algorithm is not adequate for this architecture, instead the gradient descendent with variable learning rate is used.
Fig. 5. Elman recurrent architecture of the ANN
4. Discussion of the Results
In this section, the results for the test and validation sets are analysed, comparing the real values observed with the forecast values for the time series using the different architectures. It should be mentioned that the validation set consisted of the 12 months of the year 2009, and this set was used to stop the training with a cross validation method. This set was also used to select the best model among the 50 training sessions. The test set was never seen in the training process it was used to compare the predicted data from the ANNs with a new data set.
The mean absolute percentage error (MAPE) was used to measure the error distance between the predicted values and the target values of the time series.
1
1
( 100)
Ni i
i i
T
P
MAPE
N
=T
−
Where N is the length of the set and T and P are the target and predicted values for month i. Table 1 presents the MAPE for the other architectures in the validation and test sets.
Table 1. MAPE for the architectures along the validation and test sets
Architecture Validation set Test set
Feedforward 4,21% 4,21%
Cascade forward 4,14 % 5,93%
Recurrent (Elman) 4,93% 5,75%
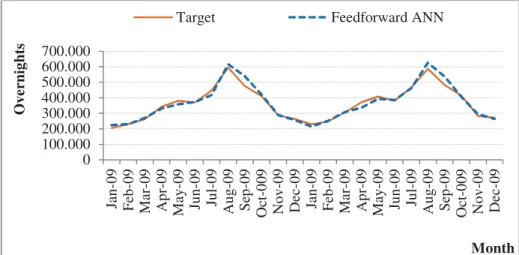
Fig. 6 presents the output of the feedforward architecture and the target (real) values for the validation (2009) and test (2010) sets. Fig. 7 presents the same values for the cascade forward ANN, and Fig. 8 the values with the Elman recurrent ANN. The MAPE presented for the three architectures are at the same level, denoting that all architectures are adequate to predict this time series. The level of the error between 4% and 6% denotes that the three models can make prediction with a relative high degree of accuracy.
Fig. 6. Feedforward output for validation and test sets 0
100.000 200.000 300.000 400.000 500.000 600.000 700.000
Ja
n-09
Feb
-09
Mar-0
9
Ap
r-0
9
May-0
9
Jun-0
9
Ju
l-0
9
A
ug-09
Sep
-09
Oct-0
0
9
N
ov-09
Dec-09 Ja
n-09
Feb
-09
Mar-0
9
Ap
r-0
9
May-0
9
Jun-0
9
Ju
l-0
9
A
ug-09
Sep
-09
Oct-0
0
9
N
ov-09
Dec-09
Overnights
Month
Fig. 7. Cascade forward output for validation and test sets
Fig. 8. Recurrent (Elman) output for validation and test sets
The plots of the output presented in the Fig. 6 to 8 confirm the competence of the ANNs models to fit a predicted data set for the tourism time series.
Comparing the three architectures with MAPE, the feedforward produces a lower MAPE than the cascade and recurrent architecture in test set. For the validation set, the recurrent ANN produced a relatively higher error (4,93%). The feedforward ANN produced equally good performance in both sets (4,21%).
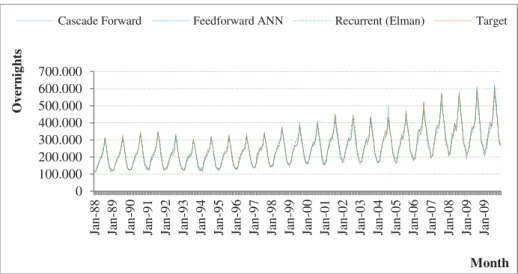
Fig. 9 presents the predicted values with the three architectures among the time series. 0 100.000 200.000 300.000 400.000 500.000 600.000 700.000 Ja n-09 Feb -09 Mar-0 9 Ap r-0 9 May-0 9 Jun-0 9 Ju l-0 9 A ug-09 Sep -09 Oct-0 0 9 N ov-09 Dec-09 Ja n-09 Feb -09 Mar-0 9 Ap r-0 9 May-0 9 Jun-0 9 Ju l-0 9 A ug-09 Sep -09 Oct-0 0 9 N ov-09 Dec-09 Overnights Month
Target Cascade Forward
0 100.000 200.000 300.000 400.000 500.000 600.000 700.000 Ja n-09 Feb -09 Mar-0 9 Ap r-0 9 May-0 9 Jun-0 9 Ju l-0 9 A ug-09 Sep -09 Oct-0 0 9 N ov-09 Dec-09 Ja n-09 Feb -09 Mar-0 9 Ap r-0 9 May-0 9 Jun-0 9 Ju l-0 9 A ug-09 Sep -09 Oct-0 0 9 N ov-09 Dec-09 Overnights Month
Fig. 9. Target and predicted values with the architectures along the all data set
5. Conclusions
The authors have used different methodologies to predict the tourism time series of “Monthly Number of Guest Nights in the Hotels” such as ARIMA models, Linear models and ANN models. In previous studies of the authors different features were experimented in the input of the ANN models, such as the number of hour of sunshine Teixeira and Fernandes [13] or with economic features Fernandes et al. [23]. Now, the feedforward, cascade forward and the recurrent architectures with similar degree of complexity (same number of nodes and same input) has compared. The three ANN models produced results of MAPE between 4% and 6% in validation and test sets, showing once again the general ability of the ANN models to predict this time series. Comparing the results of the architectures, the feedforward achieved generally better results considering both validation and test sets.
References
[1] Witt SF, Witt CA. Forecasting tourism demand: a review of empirical research. International Journal of Forecasting. 1995; 11: 447-475.
[2] Wong KF. Introduction: Tourism Forecasting State of the Art. Journal of Travel and Tourism Marketing. 2002; 13: 1-3.
[3] Fernandes PO. Modelling, Prediction and Behaviour Analysis of Tourism Demand in the North of Portugal. Ph.D. Thesis in Applied Economy and Regional Analysis. Valladolid University - Spain. 2005.
[4] Yu G, Schwartz Z. Forecasting Short Time-Series Tourism Demand with Artificial Intelligence Models. Journal of Travel Research. 2006; 45: 194-203.
[5] Dolgner R, Costa A. Turismo, Sustentabilidade e Flexibilidade Laboral. 16º Congresso da APDR Universidade da Madeira, Funchal. 2010; 1: 801-818.
[6] Ministério da Economia e da Inovação. Plano Estratégico Nacional do Turismo – Para o desenvolvimento do Turismo em Portugal. Lisboa. 2006.
[7] WTO; United Nations World Tourism Organization. Tourism Market Trends. [online]. UNWTO, 2006. Available in URL: http://www.unwto.org 02/2011.
[8] Thawornwong S, Enke D. The adaptive selection of financial and economic variables for use with artificial neural networks.
Neurocomputing. 2004; 6: 205/232.
[9] Hill T, O’connor M, Remus W. Neural network models for time series forecasts. Management Science. 1996; 42 (7): 1082-1092. [10] Hansen JV, Mcdonald JB, Nelson RD. Time series prediction with genetic algorithm designed neural networks: an empirical
comparison with modern statistical models. ComputlIntell. 1999; 15: 171-184. 0
100.000 200.000 300.000 400.000 500.000 600.000 700.000
Jan
-88
Jan
-89
Jan
-90
Jan
-91
Jan
-92
Jan
-93
Jan
-94
Jan
-95
Jan
-96
Jan
-97
Jan
-98
Jan
-99
Jan
-00
Jan
-01
Jan
-02
Jan
-03
Jan
-04
Jan
-05
Jan
-06
Jan
-07
Jan
-08
Jan
-09
Jan
-09
Overn
ig
h
ts
[11] Fernandes P, Teixeira J. A new approach to modelling and forecasting monthly overnights in the Northern Region of Portugal. Proceedings of the 15th International Finance Conference (CD-ROM); Université de Cergy; Hammamet, Medina, Tunísia. 2007. [12] Fernandes PO, Teixeira JP. Applying the artificial neural network methodology to tourism time series forecasting. In 5th
International Scientific Conference in ‘Business and Management. Vilnius, Lithuania. 2008.
[13] Teixeira JP, Fernandes PO. A Insolação como Parâmetro de Entrada em Modelo Baseado em Redes Neuronais para Previsão da Série Temporal do Turismo. CLME’ 2011, Maputo.
[14] INE. Anuário Estatístico da Região Norte 2010. Instituto Nacional de Estatística, Lisboa. 2011. [15] Bishop CM. Neural Networks for pattern recognition. Oxford University Press. Oxford. London. 1995. [16] Haykin S. Neural Networks. A comprehensive foundation. New Jersey, Prentice Hall. 1999.
[17] Rumelhart DE, McClelland JL. Parallel Distributed Processing: Explorations in the Microstructure of Cognition. Volume 1: Foundations. The Massachusetts Institute of Technology Press, Cambridge. 1986.
[18] Hagan MT, Menhaj M. Training feedforward networks with the Marquardt algorithm. IEEE Transactions on Neural Networks. 1994; 5(6): 989-993.
[19] Marquardt D. An Algorithm for Least-Squares Estimation of Nonlinear Parameters. SIAM Journal on Applied Mathematics. 1963; 11(2): 431-441.
[20] Riedmiller M, Braun H. A direct adaptive method for faster backpropagation learning: The RPROP algorithm. Proceedings of the IEEE International Conference on Neural Networks; 1993.
[21] Demuth H, Beale M. Neural Network Toolbox, for use with Matlab – User’s Guide, version 4, by the Math Works. 2000.
[22] Fernandes PO, Teixeira JP. New approach of the ANN methodology for forecasting time series: use of time index. In International Conference on Tourism Development and Management. Kos, Greece; 2009.