UNIVERSIDADE DE LISBOA FACULDADE DE CIÊNCIAS DEPARTAMENTO DE BIOLOGIA VEGETAL
Assessment of genetic variability in the exotic invasive species
Acacia longifolia using molecular markers
Sara Filipa da Silva Lucas Sousa Vicente
Mestrado em Biologia Molecular e Genética
Dissertação orientada por:
Professora Doutora Maria Helena Machado Trindade de Donato e Professora Doutora Cristina
Maria Filipe Máguas da Silva Hanson
This thesis resulted in the publication of a poster:
Sara Vicente, Helena Trindade, Octávio Paulo, Miguel Prado, Cristina Máguas (2016). Genetic Variability Assessment of the Exotic Invasive Species Acacia longifolia Along Portuguese Coastal Sand Dunes Using Molecular Markers: a Preliminary Study. International Symposium on Biological Invasion II Jornada Botânica, 25 and 26 of July 2016, Minas Gerais, Brazil.
Acknowledgements
É com o maior orgulho que digo que durante este ano aprendi imenso e fui muito, muito feliz. Contudo, apesar de serem minhas as palavras desta dissertação, a realização deste projeto passou não só por mim mas pela ajuda e apoio de várias outras pessoas maravilhosas, as quais tenho muito gosto em destacar nos próximos parágrafos. Em primeiro lugar, gostaria de agradecer às minhas orientadoras por quem tenho muito carinho, as Professoras Doutoras Helena Trindade e Cristina Máguas, pela confiança que depositaram em mim e por todo o apoio durante a realização deste projeto. À professora Helena Trindade, obrigada pela paciência e pela disponibilidade de me acompanhar e ensinar a trabalhar num laboratório. À professora Cristina Máguas, obrigada por todo o conhecimento sobre as acácias e o trabalho de campo que me passou. Obrigada por tudo o que ambas me ensinaram dentro e fora do laboratório. Obrigada por me ensinarem a ser cientista.
Muito obrigada ao Professor Doutor Octávio Paulo, cujo conhecimento foi imprescindível para a análise dos microssatélites e para os cálculos dos parâmetros populacionais. Sem a sua ajuda grande parte dos resultados do projeto não seriam possíveis, e eu estou muito grata pela sua disponibilidade.
Um especial obrigada ao Miguel Prado por ter disponibilizado as acácias da sua herdade em Vila Nova de Milfontes ao meu projeto, pela ajuda na recolha das amostras e pela informação histórica sobre esta espécie em Portugal que me forneceu. Obrigada pelo entusiasmo e interesse que mostrou perante o meu projeto.
À Márcia Vieira, Andreia Anjos, Patrícia Fernandes e Catarina Costa, obrigada pelo apoio nas recolhas das amostras. Nunca teria conseguido recolher todas as minhas acácias sem a vossa ajuda e disponibilidade. Obrigada Teresa Mexia pela ajuda com os dados do GPS. Aos colegas do laboratório 2.1.17 e do gabinete 2.1.49 da FCUL, obrigada por me terem recebido tão bem e por toda a ajuda e apoio que me deram durante este ano.
A todos os meus amigos, que sempre tiveram palavras de apoio e coragem para me dar e desejaram o meu sucesso, obrigada. Obrigada em especial à Rafaela Heitor, melhor amiga há 10 anos, por sempre ter ouvido as minhas frustrações e problemas enquanto desenvolvia este projeto, apesar de trabalhar noutra área e nem sempre perceber do que eu estava a falar (não fizeste mais que a tua obrigação!). És das melhores pessoas que conheço, e espero vir a poder fazer o mesmo por ti! Obrigada à Rita Beja e à Maria Inês Catarino, amigas de longa data e do coração, por sempre arranjarem tempo para mim nas vossas vidas ocupadas. Obrigada à Ana Russo pelos anos de amizade. Obrigada à minha bioquímica favorita e companheira desde o início dos anos de faculdade, Joana Andrade – apesar de estares longe, não me esqueço de ti! Obrigada por todo o teu apoio, a qualquer hora e em qualquer lugar. A toda a minha família, obrigada pelas palavras de apoio e coragem. Em especial, muito obrigada aos meus pais, Manuela e Ramiro Vicente, e à minha tia (e fada madrinha) Isabel Lucas, por tudo aquilo que fizeram e ainda hoje fazem por mim, e pelo apoio e incentivo incondicionais em todas as decisões que tomei até hoje. Obrigada por acreditarem em mim. Sem vocês nada disto seria possível, pelo que vos dedico esta dissertação. Finalmente, quero dizer simplesmente obrigada por ter a enorme sorte de fazer o que mais gosto e por ter tantas pessoas a quem agradecer.
Resumo
Acacia longifolia (Andrews) Willd. é uma leguminosa arbórea com capacidade para fixar azoto atmosférico, proveniente do sudoeste da Austrália e da Tasmânia. Conhecida como “acácia-de-espigas” devido à sua característica flor amarela alongada, esta espécie foi trazida para Portugal pelos serviços florestais de forma a conservar e fixar as dunas da Costa Portuguesa. A sua plantação começou no final do século XIX e estendeu-se a vários locais do país, como as dunas de São Jacinto (a norte de Aveiro), o sistema dunar de Quiaios-Mira (Figueira da Foz) e a costa Vicentina, nomeadamente Vila Nova de Milfontes (Odemira). Contudo, A. longifolia rapidamente se espalhou pelo território Português, competindo com as plantas nativas por recursos, tais como água, luz solar e nutrientes. O sucesso desta espécie foi tal que atualmente constitui uma ameaça à diversidade das espécies nativas e ao funcionamento dos ecossistemas, o que levou à classificação de A. longifolia como invasora em Portugal. Vários estudos têm sido realizados nas áreas da ecologia, fisiologia e fenologia, os quais demonstraram que indivíduos desta espécie têm um comportamento diferente consoante o ambiente em que estão inseridos, evidenciando uma grande plasticidade e adaptação, características que poderão ser potenciadoras do processo invasor. No entanto, pouco se sabe sobre esta espécie ao nível molecular, e em particular sobre a sua diversidade genética. Neste trabalho, tínhamos como objectivo estudar a diversidade genética de A. longifolia em diferentes regiões da costa Portuguesa com um clima e uma gestão florestal diferentes, bem com na região de Vila nova de Milfontes onde pelo registo histórico foi possível identificar os indivíduos originalmente plantados entre 1960/1970 pelos serviços florestais. Para tal, foram recolhidos filódios de A. longifolia em três locais: 25 amostras em Osso da Baleia (Pombal), 25 em Pinheiro da Cruz (Setúbal) e 39 em Vila Nova de Milfontes, onde neste último se procedeu a um estudo mais pormenorizado que incluiu 14 novas amostras. O estudo genético teve como base dois tipos de marcadores moleculares: ISSRs (inter-simple sequence repeats) e SSRs (simple sequence repeats) ou microssatélites. O DNA foi extraído a partir dos filódios pelo método de CTAB (brometo de cetiltrimetilamonio) e precipitado com etanol frio. Após confirmação da qualidade do DNA, foram avaliados os polimorfismos moleculares através de PCR (Polymerase Chain Reaction) pela amplificação iniciada com diversos primers (iniciadores) de ISSRs e microssatélites. Foram testados 31 primers de ISSRs, sendo 16 selecionados para o estudo nos três locais do país e 11 selecionados para o estudo detalhado de Vila Nova de Milfontes. Com os microssatélites, testaram-se 11 pares de primers, sendo selecionados 3 para a análise final: os que amplificavam os loci DCLOC, CPUH4 e APZIZ. No caso dos ISSRs, os resultados foram visualizados em gel de agarose 2%, enquanto que para os microssatélites os primers foram marcados com sondas fluorescentes. Após amplificação por PCR,
a electroforese capilar (STAB Vida) gerou resultados finais na forma de electroferogramas. A análise dos resultados originou matrizes binárias (preenchidas com 0 e 1) para os ISSRs e matrizes de alelos amplificados para os microssatélites, que foram posteriormente analisadas com softwares de forma a calcular os parâmetros descritivos e o índice de fixação de Wright (FST) para comparação entre os locais de recolha das amostras. A análise com ISSRs das três localidades do país gerou 275 bandas no total, das quais 258 são polimórifcas (94%), enquanto que a análise de Vila Nova de Milfontes gerou 137 bandas, todas elas polimórficas. O dendrograma obtido a partir dos resultados de ISSRs considerando as três regiões geográficas demonstra que as amostras têm tendência a agrupar-se de acordo com o seu local de recolha, com exceção de um grupo de 9 indivíduos de Osso da Baleia que se agrupa juntamente com Vila Nova de Milfontes. No entanto, as separações dos grupos ocorrem todas com coeficientes de similaridade de Dice muito próximos e relativamente elevados (SDice entre 0.63 e 0.85), indicando um
elevado nível de similaridade da A. longifolia entre os três locais em estudo apesar das distâncias que os separam. O mesmo ocorre quando se avalia o dendrograma obtido apenas com amostras Vila Nova de Milfontes (SDice entre 0.61 e 0.79), com a exceção que estas últimas não se agrupam de
acordo com o local de recolha. Os resultados com ISSRs demonstram ainda que há uma diferenciação genética baixa mas estatisticamente significativa (FST = 0.070) entre amostras de Vila Nova de
Milfontes, Osso da Baleia e Pinheiro da Cruz, o que possivelmente aponta para uma origem comum de A. longifolia em Portugal. No entanto, as amostras de Pinheiro da Cruz mostraram ser as mais diferentes dos restantes locais, enquanto que as amostras de Osso da Baleia revelaram-se muito semelhantes às amostras de Vila Nova de Milfontes, apesar da distância de cerca de 260 Km que as separa. Já em Vila Nova de Milfontes, amostras recolhidas em várias zonas desta localidade mostraram ter uma diferenciação genética estatisticamente significativa muito inferior à obtida quando se consideram os três locais do país (FST = 0.013), o que aponta para que as acácias plantadas
pelos serviços florestais se tenham espalhado por esta localidade. No entanto, as diferenças observadas entre as plantas originalmente plantadas pelos serviços florestais e as restantes nesta localidade indicam que já há alguma variabilidade que terá ocorrido num período de cerca de 50 anos. A análise de microssatélites gerou no total 7 alelos a partir de dois pares de primers (3 alelos do locus DCLOC e 4 alelos do locus CPUH4), tendo-se excluído os resultados do locus APZIZ por apresentarem mais do que dois alelos por indivíduo. Os microssatélites não demonstram uma diferenciação genética estatisticamente significativa, mas este resultado é possivelmente consequência de se terem analisado apenas dois loci. Recorrendo-se a uma análise mais simplista, os
que apoia a hipótese de uma origem comum de A. longifolia em Portugal. Amostras recolhidas na localidade de Vila Nova de Milfontes demonstram ter frequências de alelos raros semelhantes entre si (entre 20–40%), apoiando a hipótese de que as acácias plantadas pelos serviços florestais se terão espalhado por esta localidade, enquanto que Osso da Baleia é a localidade com maior frequência de alelos raros (54%). Pinheiro da Cruz apresenta apenas 9% de alelos raros, o que confirma que esta localização é a mais distinta de todas as estudadas.
A análise conjunta dos resultados obtidos pelos dois marcadores moleculares levanta a hipótese de uma origem comum de A. longifolia em Portugal, resultante de uma introdução única – a plantação pelos serviços florestais – e os indivíduos desta espécie serão, portanto, semelhantes ao nível molecular. É plausível considerar-se que os serviços florestais terão utilizado o mesmo lote de sementes para as plantações ao longo do país, podendo ter ocorrido transferência de sementes de uma localização para as outras. Assim, as acácias situadas ao longo de Vila Nova de Milfontes tiveram a sua origem nas que foram plantadas pelos serviços florestais junto à costa. Não tivemos acesso a nenhum registo de plantação de acácias em Osso da Baleia, mas é plausível considerar que as acácias do sistema dunar de Quiaios-Mira se tenham espalhado em direção a Sul, tendo chegado eventualmente a Osso da Baleia, que se localiza apenas a 25 Km de distância. Relativamente a Pinheiro da Cruz também não houve acesso a qualquer acesso a informação histórica, mas é possível que tanto as acácias plantadas em Vila Nova de Milfontes como as plantadas na Costa da Caparica se possam ter disseminado até lá, uma vez que ambas as localizações distam cerca de 60 Km de Pinheiro da Cruz, e que a frequência dos alelos raros tenha diminuído ao longo do processo invasivo. É de notar que a população de acácias deste local se encontra mais isolada, pelo facto de se tratar de um estabelecimento prisional, contribuindo para o declínio da frequência dos alelos raros. Contudo, os resultados obtidos com microssatélites são preliminares, pelo que de futuro serão necessários estudos com um maior número de loci e igualmente com outros tipos de marcadores moleculares, que darão novas informações e ajudarão a esclarecer a distribuição desta espécie em Portugal.
Acacia longifolia é uma espécie que exibe um comportamento extremamente invasor contribuindo para a perda de diversidade das espécies nativas. Como tal, esclarecer a origem, o padrão de distribuição e a diversidade genética desta espécie em Portugal é importante para a compreensão do seu mecanismo e capacidade invasores de forma a promover a conservação das espécies nativas que possuem valor económico e biológico. Palavras-chave: Acacia longifolia, invasora, ISSRs, SSRs, diversidade genética.
Abstract
Acacia longifolia (Andrews) Willd. is a nitrogen fixing tree or shrub original from the Southeast Australia and Tasmania. Also known as “Sydney Golden Wattle”, it was brought to Portugal by the forestry services to promote the conservation of sand dunes and introduced in various locations along the Portuguese coastal line, including the São Jacinto sand dunes (north of Aveiro), Costa da Caparica (Almada, Setúbal), the Quiaios-Mira sand dunes (Figueira da Foz) and Vila Nova de Milfontes (Odemira). However, A. longifolia quickly spread and dominated nearby soils, eventually replacing native species. This species is so successful that it is considered a serious environmental problem, leading to its classification as invasive in Portugal.
A. longifolia has been subjected to many studies in different fields such as ecology and land management, but not much is known about this species on a molecular level. In this study, we assessed the genetic diversity of 89 accessions from three locations in the Portuguese coastal line – 25 from Osso da Baleia (Pombal), 25 from Pinheiro da Cruz (Setúbal) and 39 from Vila Nova de Milfontes – using two types of molecular markers: inter-simple sequence repeats (ISSRs) (16 primers) and simple-sequence repeats (SSRs) or microsatellites (2 primers). We also conducted a more detailed study on the genetic diversity of this species in Vila Nova de Milfontes based on 53 accessions (11 ISSR primers only and 2 microsatellite primers), collecting samples from different sites including the region where acacias were introduced by the forestry services. ISSR results revealed that samples from the three different locations in the coastal line show low but significant molecular differentiation (FST = 0.070), resulting in their clustering by collection region, while samples from
different sites in Vila Nova de Milfontes have much lower genetic differentiation (FST = 0.013) and
show no particular clustering. Microsatellite analysis evidenced that samples from all location share the same alleles, indicating the possibility of a single origin of A. longifolia in Portugal. We hypothesize that the genetic similarity of acacias found in different regions of the Portuguese coast derives from the fact that the forestry services used the same allotment of seeds. Another possibility relies on the transference of seeds from one location to another, which in turn spread and invaded adjacent soils. Further studies with molecular markers are needed in the future to better understand the distribution of this species in Portugal.
Table of Contents
Acknowledgements ... ii
Resumo ... iv
Abstract ... vii
List of Tables ... x
List of Figures ... xi
Abbreviations ... xii
1. Introduction ... 1
1.1.Acacia longifolia ... 1
1.2.
Molecular Markers ... 3
1.2.1.
Inter-Simple Sequence Repeats (ISSRs) ... 4
1.2.2.
Simple Sequence Repeats (SSRs) or Microsatellites ... 4
1.3.
Population Studies and Descriptive Parameters: Wright’s F-statistics ... 5
1.4.
Aims ... 6
2. Materials and Methods ... 7
2.1.Plant Material ... 7
2.2.
DNA Extraction and Quantification ... 8
2.3.
Inter-Simple Sequence Repeats (ISSRs) ... 8
2.4.
Simple Sequence Repeats (SSRs) or Microsatellites ... 9
3. Results and Discussion ... 10
3.1.Inter-Simple Sequence Repeats (ISSR) Analysis ... 10
3.1.1.
Acacia longifolia through Portugal ... 10
3.1.2.
Acacia longifolia in Vila Nova de Milfontes ... 15
3.2.
Simple-Sequence Repeats (SSRs) or Microsatellites Analysis ... 19
3.3.
Acacia longifolia in Portugal: Origin and Dispersion Patterns ... 24
4. Conclusions and Future Perspectives ... 27
5. References ... 28
6. Appendices ... 31
6.1.Appendix I – Sample Identification ... 31
6.2.
Appendix II – DNA Extraction Protocols: Mini-CTAB Method with Ethanol or Isopropanol... ...33
6.3.
Appendix III – Inter-Simple Sequence Repeats (ISSRs) Primers ... 34
6.4.
Appendix IV – Simple Sequence Repeats (SSRs) or Microsatellite Pairs of Primers ... 35
List of Tables
Table 3.1: Total number of bands with and without the external control (EC), number and percentage
of polymorphic bands (PB) for each ISSR primer for analysis of samples from Vila Nova de Milfontes (MFAnt, MFRec), Osso da Baleia (OB) and Pinheiro da Cruz (PC). ... 10
Table 3.2: Descriptive parameters of genetic variability of A. longifolia obtained with ISSR markers for samples from Vila Nova de Milfontes (MFAnt and MFRec), Osso da Baleia (OB) and Pinheiro da Cruz (PC). ... 11
Table 3.3: Pairwise FST matrix for samples from Vila Nova de Milfontes (MFAnt and MFRec), Osso da Baleia (OB) and Pinheiro da Cruz (PC) obtained from ISSR markers. ... 12
Table 3.4: Total number of bands with and without the external control (EC), number and percentage
of polymorphic bands (PB) for each ISSR primer for analysis of samples from Vila Nova de Milfontes (MFAnt, MFRec and MFCL). ... 15
Table 3.5: Descriptive parameters of genetic variability of A. longifolia obtained with ISSR markers for
samples from Vila Nova de Milfontes (MFAnt, MFRec and MFCL). ... 16
Table 3.6: Pairwise FST matrix for samples from Vila Nova de Milfontes (MFAnt, MFRec and MFCL)
obtained from ISSR analysis. ... 16
Table 3.7: Descriptive statistics for samples from Vila Nova de Milfontes (MFAnt and MFRec), Osso da
Baleia (OB) and Pinheiro da Cruz (PC) obtained with microsatellites. ... 20
Table 3.8: Pairwise FST matrix for samples from Vila Nova de Milfontes (MFAnt and MFRec), Osso da
Baleia (OB) and Pinheiro da Cruz (PC) obtained from microsatellite analysis. ... 21
Table 6.1 (left) and Table 6.2 (right): Identification of the samples from Osso da Baleia (left) and
Pinheiro da Cruz (right) with a sample code, identification (ID) number and the geographic coordinates of the location. ... 31
Table 6.3: Identification of samples from Vila Nova de Milfontes with a sample code, identification (ID) number and the geographic coordinates of the location of each individual. ... 31
Table 6.4: List ISSR primers and corresponding annealing temperatures. ... 34
Table 6.5: List of tested SSR primers, corresponding sequence and reference. ... 35
Table 6.6: List of selected SSR primers and corresponding fluorescent label, expected fragment size and GenBank number. ... 35
List of Figures
Figure 1.1: Acacia longifolia growing in the field. ... 2Figure 1.2: Example of the PCR amplification at a locus with ISSR and microsatellite primers. ... 5
Figure 2.1: Locations of sample collection.. ... 7
Figure 3.1: Agarose gel of the amplification products obtained with ISSR primer 849. ... 11
Figure 3.2: Dendrogram obtained with ISSR markers with samples from Vila Nova de Milfontes (MFAnt and MFRec), Osso da Baleia (OB) and Pinheiro da Cruz (PC). ... 14
Figure 3.3: Dendrogram obtained with ISSR markers of samples from Vila Nova de Milfontes (MFAnt, MFRec and MFCL). ... 18
Figure 3.4: Allelic frequencies of loci DCLOC and CPUH4 for samples from Vila Nova de Milfontes (MFAnt, MFRec and MFCL), Osso da Baleia (OB) and Pinheiro da Cruz (PC). ... 19
Figure 3.5: Frequency of the common (C) and rare (R) allelles in the A. longifolia samples from Vila Nova de Milfontes (MFAnt, MFRec and MFCL), Osso da Baleia (OB) and Pinheiro da Cruz (PC). 23
Figure 3.6: Representation of the hypotheses of distribution of A. longifolia in Portugal.. ... 25
Abbreviations
A number of detected alleles Ae number of effective alleles bp molecular weight units (base pairs) BSA Bovine Serum Albumin CTAB cetyl trimethylammonium bromide dNTPs Deoxynucleotides; includes dATP, dCTP, dGTP, dTTP EDTA ethylenediaminetetraacetic acid FST Wright’s fixation index FIS Inbreeding coefficient h Nei’s gene diversity He expected heterozygosity Ho observed heterozygosity HS mean expected heterozygosity within subpopulations HT mean expected heterozygosity in total population HWE Hardy-Weinberg equilibrium I Shannon’s information index ISSRs Inter-Simple Sequence Repeats MFAnt Samples from the plantation site in Vila Nova de Milfontes MFCL Samples from the Vila Nova de Milfontes’ coastal line MFRec Samples from a recently invaded site in Vila Nova de Milfontes ns non-significant OB Samples from Osso da Baleia PC Samples from Pinheiro da Cruz PVP polyvinylpyrrolidone RAPDs Random Amplified Polymorphic DNA RFLPs Restriction Fragment Length Polymorphisms SE standard error SSRs Simple Sequence Repeats TAE Tris-Acetate-EDTA TE Tris-EDTA Tris-HCl Tris-hydrochloride U enzymatic units UPGMA Unweighted Pair Group Method with Arithmetical Averages UV Ultra-violet VNTRs Variable Number of Tandem Repeats1. Introduction
Many exotic species are introduced deliberately in a given environment because of economic or industrial interest[1]. Once in a new environment, the introduced species might have some advantages when compared to the indigenous species, like the absence of natural enemies[1], better environment resistance[1] or the ability to establish symbiotic relations with the soil microorganisms[2]. These advantages enable the introduced species to grow and spread faster, effectively invading the soil and outcompeting the indigenous species for nutrients, sunlight and water, ultimately replacing them[1]. Many plants exhibit this invasive behavior, including members of the genus Acacia, which are considered one of the most aggressive invaders worldwide[3]. In Portugal, Acacia longifolia in particular has become a serious environmental problem along the coastal area, changing sand dune habitats and coastal forests.
1.1. Acacia longifolia
Acacia longifolia (Andrews) Willd., also known as “Sydney Golden Wattle”, is a nitrogen fixing plant from the southeast Australia and Tasmania. It is a small tree or shrub with elongated leaves and yellow flowers (see Figure 1.1). This species is a member of the Mimosoideae subfamily included in the Fabaceae family, also known as Leguminosae or “pea family”.Due to its amazing invasive capacity, this species has been subjected to many studies to understand its invasive mechanisms in order to prevent its further invasion of soils. It is known that the invasive capacity of A. longifolia is due to its ability to form a high number of root nodules in different soils[2] and the establishment of a symbiotic relationship with the soil’s mutualisms[2], enabling spreading to nutrient-poor soils (like the dune systems). Also, due to its high number of seeds and growth rate, A. longifolia has the ability to control the available sunlight to other plants, eventually outcompeting them and occupying their space[4]. Furthermore, this species is capable of quick regeneration after fires, because its seeds are resistant and germination is promoted by the fire itself[4]. This is an important mechanism that probably contributed to its invasiveness in Portugal, a country with frequent fires during the summer.
Figure 1.1: Acacia longifolia growing in the field. A – A. longifolia tree. B – Close up of an A. longifolia branch, showing the
elongated phyllodes and the green rod shaped parts that are the flower buds.
Acacia longifolia was introduced in the Portuguese coastlines by the forestry services at different periods in the late 19th century/early 20th century as a way to prevent the erosion of sand
dunes[5]. Records show that between 1888 and 1929, A. longifolia was planted in São Jacinto (north of Aveiro) to fixate sand dunes that protected plantations of Pinus pinaster and Myrica faya[6], and again in 1906 in Costa da Caparica (Almada, Setúbal)[7]. In 1924, to repopulate the sand dunes in Quiaios-Mira (Figueira da Foz) left bare after the French invasions, A. longifolia was also planted by the forestry services[6]. Later on, in 1948, A. longifolia was introduced once again in the Quiaios-Mira dunes due to the environmental conditions[6]. This species was also introduced in the sand dunes of Vila Nova de Milfontes in the late 1960s/early 1970s (Miguel Prado, personal communication).
Since its introduction in Portugal, A. longifolia has invaded many adjacent environments including P. pinaster plantations, which have a high economical impact[8]. The invasive success of A. longifolia in Portugal is such that, even introduced only roughly 130 years ago, it can be found throughout the country and is negatively impacting the native species’ diversity[4] and the functioning of ecosystems[9]. A recent study on the phenology and reproductive success of A. longifolia has taken place in two different locations of Portugal – Osso da Baleia and Pinheiro da Cruz – and the results showed strong differences between the two sites, namely in the reproductive success, which is higher in Osso da Baleia, and in the phenological timings, which occurred earlier in Pinheiro da Cruz than in Osso da Baleia, in particular the fruit growth and ripening and the reproductive phenophases[8]. Also, acacias from Pinheiro da Cruz show a shorter flowering period when compared to those from Osso da Baleia[8]. These results show a clear influence of
environmental factors in the phenology of A. longifolia, since Osso da Baleia is classified as a mesic habitat (higher moisture) while Pinheiro da Cruz is classified as a xeric habitat (lower moisture)[8].
Despite all these studies, not much is known about A. longifolia on a molecular level. In recent years, the interest in molecular studies for invasive species has increased due to their importance in this field. One subject that is the target to many studies is the influence of the genome size in the invasiveness capacity of a species. In 2010, Lavergne et al.[10] found that invasive Phalaris arundinacea had smaller genome sizes when compared to non-invasive, and that this phenomenon is probably due to the natural selection of smaller genomes during the invasive process. Later, in 2014, Pandit et al.[11] performed a larger study that included 890 species from 63 genera and found that genome size correlates negatively with invasiveness, while ploidy level correlated positively. Interestingly, Gallagher et al.[12] performed this type of study in Australian species of Acacia – including A. longifolia – and found no correlation between genome size and invasiveness. However, invasive acacias tended to be taller and had a larger native range distribution. All these results stated above clearly show that incorporating genome size and other molecular analysis should elucidate invasive mechanisms. In this study, we performed an assessment of the genetic variability of A. longifolia in three different regions of the Portuguese coast line using two types of molecular markers: Inter-Simple Sequence Repeats (ISSRs) and Simple Sequence Repeats (SSRs) or microsatellites. Such analysis is important to better understand the invasion patterns of this species, and thus to better control and prevent further invasions in Portugal and other locations.
1.2. Molecular Markers
Genetic markers are features located in specific regions of a chromosome that allow distinction between individuals, populations or species, and are considered representative of changes in the genome. Genetic markers consist of two types: morphological and molecular[13]. Morphological markers have been widely used since they are easily monitored by visual analysis. However, they have several limitations, including their limited number and alterations by environmental, epistatic and pleiotropic interactions[14], which turned researchers’ attention towards molecular markers in recent years. Molecular markers are not affected by environmental interactions, epistatic or pleiotropic effects, and can be used regardless of the type of tissue[13]. They can be classified as biochemical (isozymes) or DNA markers[13], and since isozymes also have some limitations, many efforts are made to develop new and more precise DNA markers. DNA markers can be divided into two categories: hybridization-based markers, like Restriction Fragment
1.2.1. Inter-Simple Sequence Repeats (ISSRs)
Inter-simple sequence repeats (ISSRs) are highly polymorphic dominant molecular markers used mainly to study plant genetic diversity, described for the first time in 1994[15]. ISSRs are amplified by a polymerase chain reaction (PCR) in the presence of primers consisting of repeated sequences of DNA motifs (for example (AG)n or (TC)n)[16]. In other words, ISSR primers contain
microsatellite sequences that will anneal to complementary regions in the genome. The PCR reaction amplifies the region between two oppositely oriented adjacent microsatellites [15,17], originating amplification products that can be polymorphic. Therefore, no previous knowledge of the sequence is needed[18] and the same primer sequence function as both the forward and reverse primer, making this technique simple, low cost and with high level of polymorphism[19] and throughput. A diagram of the amplification process with an ISSR primer is shown on Figure 1.2.
ISSR markers have been widely used in many studies of genetic variability of populations and cultivars of many species in Portugal. An example is the assessment of the genetic diversity in Azorean Pittosporum undulatum[20], an invasive species from Australia, using ISSR markers and volatile analysis. Acacia species have already been studied with molecular markers: an example is the assessment of genetic diversity in A. senegal from Kenya using both RAPD and ISSR markers[21]. However, for A. longifolia no previous reports using molecular markers are available on the literature.
1.2.2. Simple Sequence Repeats (SSRs) or Microsatellites
Simple sequence repeats (SSRs) or microsatellites are composed of 5 to 40 repeats of tandem DNA motifs ranging between 1 to 6 nucleotides in length[22]. SSRs are found in high frequency in most taxa and can be used as co-dominant markers[23] to infer variability among individuals of the same species by performing a PCR reaction[22]. Microsatellites are highly informative and, since they are co-dominant, allow distinction between homozygotes and heterozygotes. However, non-repetitive DNA flanks SSRs and thus previous knowledge of the DNA sequence is needed in order to design primers for the PCR reaction[18]. Also, when using an automated method like capillary electrophoresis for fragment analysis, the primers must be labeled with fluorescent dyes, which make this technique rather costly. Figure 1.2 is an example of the PCR process with microsatellite primers.
Figure 1.2: Example of the PCR amplification at a locus with ISSR and microsatellite primers. During the annealing process,
the ISSR primer (red) attaches to two adjacent microsatellites (sequence in blue as an example), resulting in the amplification of the region between them. Different fragments of different sizes will be amplified as a result of primer annealing throughout the genome. The microsatellite technique relies on the attachment of a forward primer (orange) and reverse (green) to a known region of the genome; the primers attach themselves to regions adjacent to the microsatellites, allowing the primed amplification of microsatellites regions in between.
The SSRs analysis is very popular nowadays for assessments of genetic diversity, and population studies using this marker have already been done in many species of Acacia spp. like A. dealbata[24], A. koa[25] and A. senegal[26]. Also, cross-species studies have taken place where SSRs primers designed for one species of Acacia are used on other species within the same genus, and some have yielded positive results including studies with vulnerable Acacias from Australia’s arid zone[27,28]. However, there are no studies with A. longifolia, and thus no SSR primers for this species have been described yet.
1.3. Population Studies and Descriptive Parameters: Wright’s F-statistics
Population subdivision is an occurring phenomenon in natural populations, and it usually leads to reduction of heterozygosity due to inbreeding[29]. Therefore, subdivision of the population generates some degree of genetic differentiation between subpopulations[29]. Wright defined descriptive parameters that quantify the extent of the effects on heterozygosity due to subdivision, Legend: ISSR primer Microsatellite forward primer Microsatellite reverse primer Microsatellites DNA P C R NNNNNATATATATATATNNNNNNNGCGCGCGCGCGCNNNNNNNNNNNNNNGCGCGCGCGCGCNNNN NNNNNTATATATATATANNNNNNNCGCGCGCGCGCGNNNNNNNNNNNNNNCGCGCGCGCGCGNNNN Amplifica=on products ISSRs Microsatellites
between -1 and +1, with -1 meaning all individuals are heterozygous and +1 meaning all individuals are homozygous; the fixation index – FST – defined as a measure of the extent of genetic
differentiation between subpopulations and varies between 0 and 1, with 0 meaning no differentiation and 1 meaning complete differentiation between subpopulations; and the overall fixation index – FIT – which measures the reduction of heterozygosity relative to the total population.
The F-statistics were extended to multiple alleles by Nei[31], originating the GST parameter
analog to FST, and then to multiple locus by averaging the values FST of all loci or by averaging the
values of observed and expected heterozygosity over all loci, which is more appropriate. The value of GST for multiple alleles is equivalent to the weighted average of FST over all alleles[31]. Later on, Lynch
and Milligan[32] developed a corrected method for computation of parameters to be applied to dominant molecular markers (like ISSRs), minimizing the generated bias due to the impossibility of distinction between homozygotes and heterozygotes.
Wright[33] also defined guidelines to interpret the FST values by creating four levels of
genetic differentiation based on allozyme loci: little genetic differentiation, if FST is between 0 and
0.05; moderate genetic differentiation, if FST is between 0.05 and 0.15; great genetic differentiation, if
FST is between 0.15 and 0.25; and very great genetic differentiation, if FST is greater than 0.25. Wright
also noted that even if values of FST are below 0.05 they are not necessarily negligible. However,
Hedrick (1999)[34] showed that in practical cases the maximum value of FST is not one but the
expected level of homozygosity, meaning that extremely polymorphic molecular markers (like microsatellites) the FST values will always be low. Therefore, Wright’s guidelines can give a general idea of the degree of genetic differentiation but should be evaluated with caution according to the chosen molecular marker.
1.4. Aims
In this study, we set out to compare the genetic diversity of A. longifolia in three different locations along the Portuguese coast – Vila Nova de Milfontes, Pinheiro da Cruz and Osso da Baleia – and determine if there is a correlation between the genetic diversity and the stark differences in phenology of this species found in the last two locations in a recent study. Furthermore, we also compare the genetic diversity of A. longifolia in these three locations with the genetic diversity of the deliberately introduced acacias in the coastline of Vila Nova de Milfontes in the late 1960s/early 1970s. Also, we conducted a more detailed study of the genetic diversity of A. longifolia in Vila Nova de Milfontes, assessing the genetic diversity of this species in this location alone.With this study, we also intend to determine the origin of A. longifolia in Portugal, namely if the introduction of this species in Portugal occurred only through the plantation by the forestry
2. Materials and Methods
2.1. Plant Material
Ten phyllodes of Acacia longifolia were collected per accession and stored at -20°C until DNA extraction. Only green phyllodes were collected from individuals of approximately the same size. DNA extraction was performed as soon as possible, and after the extraction process the phyllodes were stored at -80°C. In Osso da Baleia (denoted OB) and Pinheiro da Cruz (denoted PC), 25 samples were collected in the vicinity of a set of central geographic coordinates (see Table 6.1 and Table 6.1 in Appendix I, respectively) in November and December 2015, respectively. In Vila Nova de Milfontes, samples were collected from different sites at this location for a more detailed study, and the geographic coordinates were determined for each individual (Table 6.3 in Appendix I). Samples from the 1960s/70s site (denoted MFAnt, 14 samples) and from the recently invaded site (denoted MFRec, 25 samples) were collected in September 2015 along with a sample of Acacia saligna to serve as an external control for the analysis, while samples from the coastal line (denoted MFCL, 14 samples) were collected in January 2016. The geographical distribution of the samples is shown in Figure 2.1.
2.2. DNA Extraction and Quantification
Three different extraction protocols were tested with 3 samples of Acacia longifolia and the external control sample, A. saligna: the mini-CTAB method with ethanol; the mini-CTAB method with isopropanol, both adapted from Doyle & Doyle (1987)[35]; and the GF-1 plant DNA extraction kit (Vivantis, Malaysia). For detailed protocols see Appendix II. In all the protocols, A. longifolia phyllodes were macerated with liquid nitrogen and incubated at 65 °C with a 2% CTAB extraction buffer. After extraction, DNA was quantified by spectrophotometry, diluted to 10 µM and amplified through a PCR reaction with the ISSR primer 817 to confirm viability of the samples. The mini-CTAB method where DNA was precipitated with ethanol yielded the best results and was therefore chosen for this species.
2.3. Inter-Simple Sequence Repeats (ISSRs)
Each PCR reaction was performed in a total volume of 15 μL containing 6 ng of genomic DNA, 1 μM of each ISSR primer (STAB Vida, Portugal), 0.2 mM of dNTP mix, 1 mg/mL of BSA, 1.5 mM of MgCl2, 0.6 U of GoTaq Flexi DNA polymerase and 1x green GoTaq Flexi buffer (Promega, USA). A totalof 31 primers were tested but only a few were selected for further analysis: 16 were selected for analysis of genetic diversity of A. longifolia in the 3 collection sites and 11 were selected for a detailed study of this species’ diversity in Vila Nova de Milfontes (see Table 6.4 in Appendix III). Primers that showed no amplification or low polymorphism level were excluded. Each PCR reaction included a negative control with all the components except the genomic DNA. The amplification was performed in a BioRad T100 thermocycler and included an initial denaturation step at 95°C for 5 min; followed by 40 cycles of 45 s at 95°C, 45 s at the corresponding annealing temperature for each primer (Table 6.4 in Appendix III), and 1.5 min at 72°C; followed by a final extension step at 72°C for 7 min. Primers 840, 846, 901, 903 and 904 required a touch-down amplification program as follows: initial denaturation step at 95°C for 5 min; followed by 11 cycles of 45 s at 95°C, 45 s at 57°C, and 1.5 min at 72°C; followed by 29 cycles of 45 s at 95°C, 45 s at 52°C (primers 901, 903 and 904), 53°C for primer 846 or 54°C for primer 840, and 1.5 min at 72°C; followed by a final extension step at 72°C for 7 min. The amplification products were separated by electrophoresis in a 2% agarose gel with 2 μL of GreenSafe per 100 mL of agarose, using 1x TAE as both the gel buffer and the running buffer. Gels were run at 60 V for 4h and were visualized in the GeneFlash UV transilluminator (Syngene, UK). Each gel image was analyzed with the GeneTools software (Syngene, UK) and only bands with sizes between 250 and 2.400 bp were considered in the analysis. For each primer, a binary matrix was filled with either a 1 or a 0, whether a certain band was present or absent, respectively. At least 10% of the PCR amplifications were performed twice to confirm the reproducibility of the technique. The
data from all the primers was then combined and computed using NTSYS v2.1[36] software to obtain the dendrograms by UPGMA with Dice’s coefficient. Descriptive parameters were computed using the AFLP-Surv v1.0[37] software.
2.4. Simple Sequence Repeats (SSRs) or Microsatellites
Primers designed for other species of Acacia reported by Roberts et al.[27] and Forrest et al.[28] were selected to check for amplification in A. longifolia. A total of 11 pairs of microsatellite primers were tested and three were selected for further analysis (Table 6.5 in Appendix IV). Most primers showed amplification with this species but required some optimization, namely the annealing temperature of the PCR cycle, concentration of MgCl2 or quantity of genomic DNA. The
selected primers, amplifying locus APZIZ, DCLOC and CPUH4, showed mostly low molecular weight amplification products. The forward primers for these loci were labeled with ATTO-550, 6-FAM and HEX, respectively, for capillary electrophoresis. See Table 6.6 in Appendix IV for the selected primer’s details. Each PCR reaction was performed in a total volume of 15 μL containing 10 ng of genomic DNA, 0.2 μM of forward primer labeled with a fluorescent dye on the 5’ end (STAB Vida), 0.2 μM of reverse primer (STAB Vida), 0.2 mM of dNTP mix, 2 mM of MgCl2, 1 U of GoTaq Flexi DNA polymerase
and 1x colorless GoTaq Flexi buffer (Promega, USA). Each PCR reaction included a negative control containing all the components except the genomic DNA. Twelve repeated samples were performed for confirmation of reproducibility. Twelve positive controls (random selected samples) were also performed for confirmation of amplification before proceeding to capillary electrophoresis. The amplification was performed in a BioRad T100 thermocycler as follows: initial denaturation step at 95°C for 5 min; followed by 40 cycles of 30 s at 94°C, 1 min at 59°C, and 30 s at 72°C; followed by a final extension step at 72°C for 7 min. The positive and negative controls were analyzed by electrophoresis in a 2% agarose gel prepared as described before, at 80 V for 2h. The results were then visualized as previously described. Each PCR with a given pair of primers was performed separately and then the amplification products were combined for simultaneous analysis. The samples were analyzed through capillary electrophoresis by STAB Vida (Portugal). The results were analyzed with Peak Scanner v1.0 software (Applied Biosystems, USA) with GS500(-250) as size standard. Descriptive parameters and allelic frequencies were calculated using the GenAlEx v6.502[38,39] software.
3. Results and Discussion
3.1. Inter-Simple Sequence Repeats (ISSR) Analysis
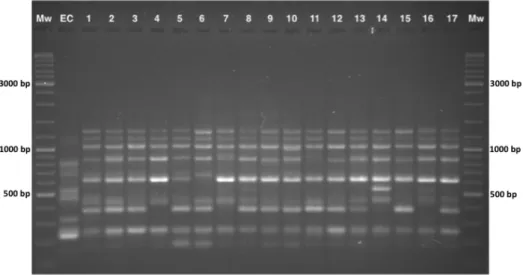
3.1.1. Acacia longifolia through Portugal A total of 31 ISSR primers were tested and 16 were selected to assess the genetic variability of Acacia longifolia in Vila Nova de Milfontes (MFAnt and MFRec), Osso da Baleia (OB) and Pinheiro da Cruz (PC). The choice of the primers was based on the amplification of clear and polymorphic bands as shown in the agarose gel in Figure 3.1. A total of 275 bands (243 excluding the external control) were obtained and 253 were polymorphic (Table 3.1), resulting in the dendrogram presented in Figure 3.2. The dendrogram shows a high genetic differentiation of all A. longifolia samples from the external control (EC) A. saligna (SDice = 0.20). Separation among A. longifoliasamples occurred at a much higher Dice’s coefficient (first separation at SDice = 0.63) and the clusters
are all close together (last clustering at SDice = 0.85), indicating that these samples share a high degree
of genetic similarity despite their geographical collection site.
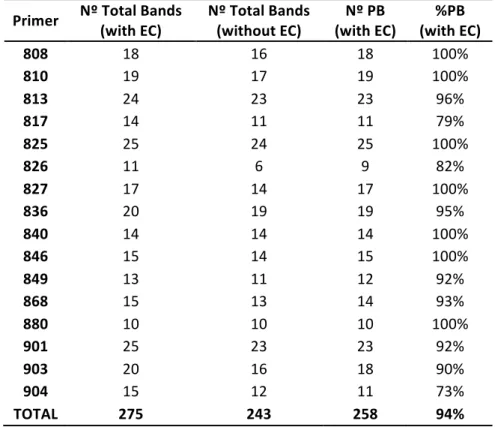
Table 3.1: Total number of bands with and without the external control (EC), number and percentage of polymorphic bands (PB) for each ISSR primer for analysis of samples from Vila Nova de Milfontes (MFAnt, MFRec), Osso da Baleia (OB) and Pinheiro da Cruz (PC).
Primer Nº Total Bands (with EC) Nº Total Bands (without EC) (with EC) Nº PB (with EC) %PB
808 18 16 18 100% 810 19 17 19 100% 813 24 23 23 96% 817 14 11 11 79% 825 25 24 25 100% 826 11 6 9 82% 827 17 14 17 100% 836 20 19 19 95% 840 14 14 14 100% 846 15 14 15 100% 849 13 11 12 92% 868 15 13 14 93% 880 10 10 10 100% 901 25 23 23 92% 903 20 16 18 90% 904 15 12 11 73% TOTAL 275 243 258 94% Analyzing the dendrogram, the first separation originates two clusters: cluster I and cluster II. Cluster I then subdivides into groups A and B. Group A includes all samples from MFAnt and three
samples from MFRec. Group B subdivides into two subgroups: subgroup 1 contains most of the samples from OB; and subgroup 2 contains all samples from PC. Cluster II is divided into groups C and D: group C contains most of the samples from MFRec and group D contains nine samples from OB. Therefore, samples cluster according to their geographical location, which seems to be indicative of some differentiation. Figure 3.1: Agarose gel of the amplification products obtained with ISSR primer 849. Mw – molecular weight standard, with the three most intense bands (3.000, 1.000, 500 bp) indicated; EC – external control (A. saligna); Lanes 1-17 – samples of A. longifolia.
The computation of descriptive population genetic parameters allowed a better understanding of the genetic diversity of A. longifolia throughout Portugal (Table 3.2). The obtained Nei’s gene diversity (h) values are low in general (mean h = 0.190, equivalent to HS), with the highest value belonging to MFAnt (h = 0.213) and the lowest value belonging to PC (h = 0.166), indicating that acacias found in PC are genetically less diverse than acacias found in MFAnt (discussed later). Table 3.2: Descriptive parameters of genetic variability of A. longifolia obtained with ISSR markers for samples from Vila Nova de Milfontes (MFAnt and MFRec), Osso da Baleia (OB) and Pinheiro da Cruz (PC). Nº PB – number of polymorphic
bands without the external control; %PB – percentage of polymorphic bands; h – Nei’s gene diversity, analogous to the expected heterozygosity under Hardy-Weinberg equilibrium; HS – mean expected heterozygosity within subpopulations; HT – expected heterozygosity in total population; FST – Wright’s fixation index. Standard error is shown in parenthesis. *P(rand ≥ data) < 0.01 based on 500 permutations. Location Nº PB (without EC) %PB h HS HT FST MFAnt 135 55.6 (0.012) 0.213 0.190 0.070* MFRec 129 53.1 (0.011) 0.187
The computation of the Wright’s fixation index showed a moderate genetic diversity, with a value of 0.070 (P(rand ≥ data) < 0.01). This supports the hypothesis stated above that samples of A.
longifolia from the four locations under analysis have a relatively high level of similarity at a molecular level. However, there is low but significant genetic differentiation between locations. Furthermore, to check the values of the fixation index between each and every location, the pairwise FST matrix was computed (Table 3.3).
Table 3.3: Pairwise FST matrix for samples from Vila Nova de Milfontes (MFAnt and MFRec), Osso da Baleia (OB) and Pinheiro da Cruz (PC) obtained from ISSR markers.
MFAnt MFRec OB PC
MFAnt 0.000
MFRec 0.056 0.000
OB 0.072 0.046 0.000
PC 0.094 0.078 0.074 0.000
The lowest value of FST was obtained between MFRec and OB (FST = 0.046), indicating that
samples in these two locations were the most similar. This is supported by the fact that MFRec and 9 samples from OB clustered together on the dendrogram (Cluster II). The highest FST value was
obtained between MFAnt and PC (FST = 0.094), indicating that these two locations were the most
genetically different and indeed these two regions are located in different groups (A and B) in Cluster I. Also important to notice is the FST between MFAnt and MFRec (FST = 0.056), which is the second
lowest value of the matrix. This seems to indicate some kind of genetic differentiation between these two locations, which belong to different clusters in the dendrogram, even though they are genetically similar and geographically close. Also, the fact that OB shows different FST values with
both MFAnt (FST = 0.072) and MFRec (FST = 0.046) is indicative of some genetic differentiation
between these last two locations, with OB being more similar to MFRec than the MFAnt location. Still, it is important to notice that three samples from MFRec appeared together with the samples from MFAnt in the dendrogram, which supports the fact that these locations also have some degree of similarity despite their separation in different clusters. Also, the highest FST values computed
belong all to PC, indicating that this was the most differentiated location of all four. In short, all FST
values but one fall into Wright’s moderate genetic differentiation category and seem to vary between locations, evidencing low but existent genetic differentiation that might explain why the samples have a tendency of grouping by their geographical site. The exception is the FST value
between MFRec and OB, which falls into Wright’s low genetic differentiation category. However, the FST values are low in general, reinforcing the hypothesis that all locations had a considerable degree
longifolia in Portugal, and that the stark differences in this species’ phenology found in Osso da Baleia and Pinheiro da Cruz by Fernandes et al. (2015)[8] are consequence of its amazing phenotypic plasticity and not of genotypic variation.
A similar approach to the one presented in this study reports the genetic diversity of Oeceoclades maculata, an orchid original from Africa but invasive in Brazil[40]. The authors collected samples from several sites in Brazil and performed ISSR analysis based on 13 primers, yielding a total of 192 bands, 189 of which were polymorphic. The Nei’s gene diversity (h) obtained for O. maculate is 0.2556, higher than the one obtained in this study for A. longifolia (h = 0.190) and indicative of a greater genetic diversity of O. maculate when compared to A. longifolia. The authors also computed the ΦST parameter, which is a measure of genetic differentiation, and obtained a value of 0.933,
indicating great genetic differentiation between the Brazilian populations of O. maculate, unlike the case of A. longifolia in Portugal. Another study, this time with AFLP markers, compared native and invasive populations of Solidago canadensis, a species original from North America and introduced in China[41]. The authors computed the ΦPT parameter, an analog of FST, and found that the North
American populations showed lower genetic differentiation than the Chinese populations (ΦPT =
0.103 vs. ΦPT = 0.182, respectively), which might be indicative, among other possibilities, of multiple
native populations as the origin of this species in China. Conversely, the results obtained for A. longifolia show low genetic differentiation (FST = 0.070) and seem to be indicative of a single origin of
this species in Portugal.
Regarding the genus Acacia, not much has been done regarding molecular analysis. A. Senegal, a native species from four districts of Kenya[21], was the subject of a study where 5 ISSR markers and 10 RAPD markers were combined. The mean Nei’s gene diversity value obtained was 0.283, which was higher than the one obtained with A. longifolia (h = 0.190), indicating that A. senegal has a higher level of genetic diversity in Kenya than A. longifolia has in Portugal. This is to be expected since A. senegal is native in Kenya, but A. longifolia is an invader introduced in Portugal. Still, evidence was found that there is some genetic differentiation between populations of A. senegal in Kenya, and the authors raise the possibility that it might be consequence of geographical separation of the populations. Conversely, Vachellia (Acacia) karroo, a native species from South Africa, was also subject to a study using ISSR markers, and it was found that this species is a panmictic entity[42], which means that there are no subpopulations genetically differentiated even if geographically distanced. These are some of the few studies reported in the genus Acacia using ISSRs, although these molecular markers have been used in many diversity studies with numerous
Figure 3.2: Dendrogram obtained with ISSR markers with samples from Vila Nova de Milfontes (MFAnt and MFRec), Osso da Baleia (OB) and Pinheiro da Cruz (PC). EC – external control; Samples 1-15 – MFAnt; Samples 16-40 – MFRec; Samples 41-65 – OB; Samples 71-95 – PC.
MFRec
Dice's Coefficient 0.15 0.40 0.65 0.90 ECMW EC 1 2 18 10 15 11 13 17 12 16 3 14 4 5 6 9 7 50 52 51 60 59 63 57 65 62 61 53 56 55 54 58 64 71 72 89 77 79 75 81 84 73 74 76 78 80 82 83 85 86 87 88 90 91 94 92 93 95 19 23 21 22 35 36 33 34 20 24 26 29 27 30 31 40 28 32 25 37 39 38 41 43 46 44 45 47 49 48 42CL
U
ST
ER
I
CL
U
ST
ER
II
MFAnt
OB
PC
OB
I
II
A
B
C
D
1
2
3.1.2. Acacia longifolia in Vila Nova de Milfontes
For the detailed analysis of Vila Nova de Milfontes only 11 primers revealing high polymorphism were selected (see table 4 in Appendix III), generating a total of 137 bands (128 excluding the external control), all of which are plolymorphic (Table 3.4). The dendrogram presented in Figure 3.3 shows again a clear separation of the external control A. saligna from all the A. longifolia samples (SDice = 0.31). The samples from Vila Nova de Milfontes shared roughly the same
similarity level obtained with all the sampling (first level at SDice = 0.61, last level at SDice = 0.79 vs SDice
= 0.63, last level SDice = 0.85 as previously reported). However, neither MFAnt nor MFRec or MFCL
samples clustered according to the collection sites.
Table 3.4: Total number of bands with and without the external control (EC), number and percentage of polymorphic bands (PB) for each ISSR primer for analysis of samples from Vila Nova de Milfontes (MFAnt, MFRec and MFCL).
Primer Nº Total Bands (with EC) Nº Total Bands (without EC) (with EC) Nº PB (with EC) %PB
808 11 11 11 100% 810 17 15 17 100% 813 10 9 10 100% 823 13 13 13 100% 827 11 8 11 100% 836 11 10 11 100% 840 14 14 14 100% 846 10 10 10 100% 849 14 14 14 100% 868 9 8 9 100% 901 17 16 17 100% TOTAL 137 128 137 100% The descriptive parameters were also computed for this data as previously (Table 3.5). The values of Nei’s gene diversity (h) were low in general (HS = 0.261) and quite similar among sites, with
the highest value again belonging to MFAnt (h = 0.275) and the lowest belonging to MFRec (h = 0.246). The obtained value of FST was below 0.05 (FST = 0.013, P(rand ≥ data) < 0.01), corresponding
to a Wright’s low genetic differentiation category, indicating high genetic similarity between sites. However, this value was significant and, as mentioned before, not necessarily negligible, but it was much lower than the one obtained previously when considering Osso da Baleia, Pinheiro da Cruz and Vila Nova de Milfontes all together (FST = 0.070).
Table 3.5: Descriptive parameters of genetic variability of A. longifolia obtained with ISSR markers for samples from Vila Nova de Milfontes (MFAnt, MFRec and MFCL). Nº PB – number of polymorphic bands without the external control; %PB –
percentage of polymorphic bands; h – Nei’s gene diversity, analogous to the expected heterozygosity under Hardy-Weinberg equilibrium; HS – mean expected heterozygosity within subpopulations; HT – expected heterozygosity in total
population; FST – Wright’s fixation index. Standard error is shown in parenthesis. *P(rand ≥ data) < 0.01 based on 500
permutations. Location Nº PB (without EC) %PB h HS HT FST MFAnt 86 67.2 (0.016) 0.275 0.261 (0.009) 0.265 0.013* (0.046) MFRec 86 67.2 0.246 (0.015) MFCL 89 69.5 (0.016) 0.263 The pairwise FST matrix was computed (Table 3.6), revealing in general low values, not very
different from one another. Also, they were much lower than those obtained previously with samples from Vila Nova de Milfontes (MFAnt and MFRec only), Osso da Baleia and Pinheiro da Cruz. The lowest FST value (0.009) was obtained between MFAnt and MFRec, indicating that these sites
were the most similar. Interestingly, the FST value previously obtained between these two sites (FST =
0.056) was much higher, suggesting some sort of genetic differentiation. We believe that this was caused by the presence of data from OB when computing the FST. When considering the MFAnt,
MFRec and OB locations, MFRec was indeed slightly more similar to OB than to MFAnt. However, when comparing MFAnt and MFRec with MFCL, the first two sites seemed to be much more similar than before. This indicates that MFAnt and MFRec despite being most similar clearly have low but existing genetic differentiation. This might justify why MFAnt and MFRec sites appeared in different clusters of the dendrogram obtained with samples from all locations (Figure 3.2) despite their geographical proximity. The highest FST (0.017) belonged to MFRec and MFCL, indicating that these two sites were the most genetically different of the three. Table 3.6: Pairwise FST matrix for samples from Vila Nova de Milfontes (MFAnt, MFRec and MFCL) obtained from ISSR analysis. MFAnt MFRec MFCL MFAnt 0.000 MFRec 0.009 0.000 MFCL 0.013 0.017 0.000 However, as previously mentioned, all FST values were very low and seemed to indicate great
genetic similarity of A. longifolia across Vila Nova de Milfontes, raising the hypothesis that the individuals from the MFRec and MFCL sites originated from the MFAnt site that spread and invaded the nearby soils.
Comparing the obtained results with the previously mentioned studies of Oeceoclades maculata[40] and Solidago canadensis[41], it is clear that the genetic differentiation of A. longifolia found in the three sites of Vila Nova de Milfontes is much lower, which is to be expected considering that since these studies included samples from a higher area when compared to our Vila Nova de Milfonte’s study area, and also considering that the genetic differentiation between Vila Nova de Milfontes, Osso da Baleia and Pinheiro da Cruz is not high even considering the distance that separates these locations. However, the mean value of Nei’s gene diversity obtained for Vila Nova de Milfontes alone is higher than the one obtained previously for all three locations (HS = 0.190),
indicating that the diversity of acacias from Vila Nova de Milfontes is higher than the average along the country.
Figure 3.3: Dendrogram obtained with ISSR markers of samples from Vila Nova de Milfontes (MFAnt, MFRec and MFCL). EC – external control; Samples 1-15 – MFAnt; Samples 16-40 – MFRec; Samples 101-114 – MFCL (samples collected along the coastal line of Vila Nova de Milfontes). Dice's Coefficient 0.30 0.50 0.70 0.90 101MW EC 1 18 2 101 27 112 21 34 6 36 14 103 13 110 37 102 38 9 28 22 26 29 33 11 25 35 30 32 109 31 113 114 12 24 17 104 16 111 7 40 39 20 10 15 106 107 4 5 105 19 23 3 108
3.2. Simple-Sequence Repeats (SSRs) or Microsatellites Analysis
Eleven pairs of microsatellite primers were tested in A. longifolia and three pairs were selected for the final analysis - the pairs of primers that amplified the locus APZIZ, DCLOC and CPUH4 according to Roberts et al.[27] and Forrest et al.[28]. However, after capillary electrophoresis the results with the primers APZIZ were not considered due to the unspecific amplification of high molecular weight fragments (visible as several peaks occurring in some samples). Therefore, they were excluded from the final analysis. The results with the pair of primers CPUH4 led to the exclusion of samples 9, 26, 29, 61, 79 and 91 from the final analysis. The reason for excluding samples 9 and 29 was the absence of amplification, while the remaining mentioned samples showed more than two peaks in the electropherogram, indicating that some other region of the genome was being amplified together with the microsatellite. This problem also happened with samples 1, 12, 13, 14, 25, 37, 46, 62, 78, 86 and 90 but in these cases we were able to determine which peaks resulted from microsatellite amplification and which peaks had to be excluded. Analyzing the resulting electropherograms obtained for locus DCLOC and CPUH4 resulted in a total of 7 alleles: alleles 98, 102 and 108 bp for DCLOC; and alleles 93, 95, 98 and 121 bp for CPUH4. No private alleles were found within these loci. Figure 3.4: Allelic frequencies of loci DCLOC and CPUH4 for samples from Vila Nova de Milfontes (MFAnt, MFRec and MFCL), Osso da Baleia (OB) and Pinheiro da Cruz (PC).
Locus DCLOC has two alleles with high frequency in all populations – alleles 98 and 102 – while allele 108 has a lower frequency and was absent from the PC location (Figure 3.4). In locus
0,0 0,2 0,4 0,6 0,8 1,0 98 102 108 93 95 98 121 DCLOC CPUH4 Fr eq ue nc y Locus MFAnt MFRec MFCL OB PC