A
Lama Issam Beseisso
Dissertação
Mestrado Integrado em Medicina Dentária
2013
Universidade de Lisboa
Faculdade de Medicina Dentária
Avaliação indireta da profundidade de polimerização de um
compómero colorido com análise de microdureza Knoop
.
Dissertação orientada
Pela Professora Doutora Sofia Arantes e Oliveira
Mestrado Integrado em Medicina Dentária
2013
Depth of Cure of a Colored Compomer. Indirect Evaluation using
Knoop Hardness Analysis.
Lama Issam Beseisso
Avaliação indireta da profundidade de polimerização de um
compómero colorido com análise de microdureza Knoop.
Universidade de Lisboa
Faculdade de Medicina Dentária
“A ciência? Ao fim e ao cabo, o que é ela senão uma longa e sistemática curiosidade?” André Maurois
Table of Contents
Agradecimentos I Resumo III
Abstract VII Palavras-Chave/ Keywords VII
Introduction 1
Objectives 5
Methods and Materials 7
Results 11
Discussion 17
Conclusion 21
References 23
Agradecimentos
À Professora Doutora Sofia Arantes e Oliveira, minha orientadora, pela sua disponibilidade, pelos preciosos ensinamentos, pela oportunidade de realizar este estudo, de aprofundar e de alargar os meus conhecimentos. Pela paciência, pela amizade e o seu sentido de humor.
Ao Professor Doutor Jaime Portugal, pelo apoio e pela sua simpatia que sempre estiveram presentes.
À empresa Voco pelo fornecimento do material e ao laboratório de biomateriais pelo financiamento de materiais para a concretização deste estudo
À Claudia e a Lénia, pela sua amizade, pelo apoio e pelo incentivo que sempre prestaram ao longo da minha vida académica.
À minha mãe, ao meu pai, pelo constante apoio, pela disponibilidade, pela compreensão e pela paciência que sempre prestaram ao longo da minha vida e que fizeram de mim o que sou hoje.
À minha irmã que sempre esteve presente e disponível para me apoiar, através dos seus valiosos conhecimentos, durante o meu percurso académico.
Ao meu irmão, que sempre esteve disponível e pela amizade.
II
Resumo Introdução
Em Medicina Dentária, os materiais de restauração estão constantemente a evoluir no sentido de melhorar a manipulação do material, a sua aplicação clínica, a sua durabilidade, a sua resistência mecânica e a sua estética. Em Odontopediatria existe um vasto leque de materiais dentários que nos permite a selecção mais eficiente do material de acordo com o presente caso. Estes materiais abrangem a amálgama dentária, a coroa de aço, a resina composta, os selantes, o ionómero de vidro, o ionómero de vidro modicado com resina e recentemente os compómeros (Rugg-Gunn et al., 2011).
Devido à elevada taxa de dureza do esmalte num dente permanente, é indicado a utilização do compómero nos dentes decíduous (Correr et al., 2007). De acordo com o Vandenbulcke et al., a dureza superficial de um material restaurador, associada aos valores da microdureza (Mandikos et al., 2001), deve ser próxima à dureza de um dente para a prevenção de uma fratura subsequente do material (Vandenbulcke et al., 2010).
Há menos de 10 anos, foram introduzidos no mercado compómeros coloridos com o principal âmbito de aumentar o compliance, durante a consulta, em crianças com lesões de cárie na dentição deçídua. Estes compómeros coloridos tem a particularidade de constituirem partículas responsáveis pelo brilho e pela diversas cores: prateado, limão,dourado, latanja, cor de rosa, roxo, verde e azul (Akbay Oba et al., 2009; Ertugrul et al., 2010).
O principal problema dos materiais cromáticos com diversas tonalidades é a profundidade de polimerização. Materiais resinosos com tonalidade mais escura apresentam uma reduzida profundidade de polimerização em comparação com os materiais de tonalidade mais clara (Tirtha et al., 1982; Koupis et al., 2006; Vandenbulcke et al., 2010). Como consequência, esse reduzido grau de conversão repercute-se numa polimerização incompleta compremetendo as propriedades mecânicas (sorpção de água, resistência ao desgaste e resistência mecânica (Vandenbulcke et al., 2010), a biocompatibilidade (associada ao aumento dos monómeros residuais com a capacidade de irritar os tecidos moles e a polpa, de estimular o crescimento bacteriano e causar reacções alérgicas) (Pilo et al., 2007; Moore et al., 2008) e o sucesso clinico (pigmentação e infiltração marginal) (Pilo et al., 2007; Camargo et al., 2009).
IV
A profundidade de polimerização depende não só das propriedades do material (tipo do fotoiniciador, na resina e no tamanho e no volume das partículas de carga), nas propriedades ópticas (tonalidade, translucidez, índice de refração) mas também na fonte da luz visível (Pilo et al., 1999; Nicholson et al., 2006; Moore et al., 2008; Bala et al., 2009).
Foram comprovados que a intensidade da luz e o espetro de ação do fotopolimerizador, o tamanho, a localização e a orientação da extremidade do aparelho fotopolimerizador influenciam no grau de conversão na base de um incremento com 2mm de espessura (Hubbezoglu et al., 2007; Moore et al., 2008; Bala et al., 2009).
Assim, a reduzida iluminação resultaria num incompleto grau de conversão, subjacentemente à superfície fotopolimerizada, reduzindo a eficiência da polimerização e a profundidade de polimerização (Pilo et al., 1999; Hubbezoglu et al., 2007).
Objetivos
Determinar se a profundidade de polimerização das diversas cores do compómero, com aplicação de diferentes protocolos, é adequada e comparar a sua dureza superficial.
Materiais e Métodos
Dez espécimes de cada grupo, Twinky Star (VOCO, Cuxhaven, Germany) e Dyract Extra (Dentsply International, Konstanz, Germany) cor A3, foram preparados num molde em acrílico (Samplkwick Liquid Fastcure Acrylic-USA) com dimensões padronizadas de
2mm×4mm, cujas dimensões confirmadas por uma craveira digital (Digimat Caliper
Mitutoyo- Japan), e fotopolimerizadas, de acordo com as instruções do fabricante, através da luz LED (bluephase 20i, Ivoclar Vivadent, Shaan, Liechtenstein) a baixa intensidade e a alta
intensidade, 570 mW/cm2 e 1280mW/cm2 respetivamente. Foi colocado o molde em acrílico
sobre a face vestibular de um incisivo embebido num bloco transparente em acrílico para reproduzir o índice de refração de uma cavidade dentária. Recorreu-se ao microdurómetro (Duramin - Struers, WestLake, USA) para a avaliação in vitro da microdureza através da microdureza Knoop com 98,12mN de carga e um tempo de permanência durante 10s. Foram realizadas três indentações em cada superfície do espécime, uma no centro e duas na ponta.
A microdureza Knoop foi realizada em dois períodos de tempo após a fotopolimerização: o imediato, 60s após a fotopolimerização e a 24h, após a fotopolimerização pós-irradiação. Após a análise da microdureza a 60, as amostras foram armazenadas numa caixa protegida por papel de alumínio, para a sua proteção da luz, durante 24h a 37ºC.
Dados da microdureza superficial dos espécimes foram comparados através do Kruskall-Wallis e o teste post hoc test de LSD de comparações multiplas
Recorreu-se ao teste de Wilcoxon para comparar a microdureza aos 60s e às 24h. O teste de Mann-Whitney foi utilizado para comparação em média da microdureza em diferentes intensidades de luz. A significância estatistica foi predeterminada a 5%.
Resultados
Foram observados um adequado ratio de microdureza para cada cor quando
fotopolimerizados a alta intensiadade de luz a 1280mw/cm2 comparativamente com a luz
baixa 570mW/cm2.
Os valores médios da microdureza Knoop no topo de cada espécime varia entre 15,88 KHN no Group DL60, e 57,50 KHN no Group TSOH24.
De acordo com os protocolos de fotopolimerização, observaram-se diferenças nos valores médios da microdureza entre o Dyract (p<0,05) e a maioria dos materias em cada protocolo de fotopolimerização. Á exceção destes, não observaram diferenças (p>0,05) entre os pares DL60/TSL60, DH60/TBH60, DH60/TSH60, DL24/TSL24, DH24/TSH24, DH24/TBH24 and DH24/TPH24. Outras diferenças foram encontradas nos protocolos de 24h após a
fotopolimerização e a 1280mw/cm2 entre os pares TSH24/TLH24 e TSH24/TOH24
(p<0,05).
Discussão
O objetivo deste estudo é observar e analisar se as diferentes cores do compómero poderiam influenciar em diferenças na profundidade de polimerização e na dureza superficial. Diferentes protocolos de fotopolimerização foram aplicadas a fin de perceber a influência de uma elevada intensidade de luz e uma fotopolimerização pós-irradiação poderiam alterar os variantes a serem estudadas.
VI
TS Gold e o Dyract A3 não obtiveram uma satisfatória e adequada profundidade de polimerização em nenhuns dos protocolos aplicados. A cor da partícula de carga encontrada na TSGold é amarela enquanto nas restantes cores da Twinky Star é acinzentada. Por isso, foram tiradas fotografias de diferentes cores da TS através do esteromicrocópio (EMZ-873, Meiji, Japan) com imagem de software (IM50, version 4, Leika, UK) para uma melhor compreenção na sua estrutura e excluir possíveis diferenças.
Porém, a informação sobre os constituintes dos materiais é escassa o que não nos permite confirmar este fato. Contudo, as divergências nas partículas de carga poderia justificar as diferenças na profundidade de polimerização.
De acordo com as recomendações do fabricante, o inferior tempo de fotopolimerização do Dyract em relação ao Twinky Star, sendo de 10s e de 40s respetivamente, poderá explicar a insatisfatória profundidade de polimerização produzida no material. Será necessário aprofundar o estudo com o Dyract a fin de deteminar o correto e suficiente tempo de fotopolimerização para alcançar uma eficiente profundidade de polimerização.
Como foi especulado, a fotopolimerização pós-irradiação não manifestou impacto na profundidade de polimerização dos materiais. Desde que a fotopolimerização pós-irradiação ocorre tanto no topo como na base de cada especíme, não houve alterações no ratio da microdureza.
Tornou-se claro e evidente neste estudo que existe uma correlação direta entre a intensidade da luz e a profundidade de polimerização dos materiais.
À exceção do TSBlue, uma elevada intensidade de luz conduziu a um aumento em média da microdureza superficial em todos materiais. Esse fato deve-se aos reduzidos valores da
dureza ocorridas no TSBlue, após a fotopolimerização a 1280mw/cm2.
Conclusão
Os compómeros cloridos mostraram uma óptima profundidade de polimerização quando
fotopolimerizados a 1280mW/cm2. Serão necessários mais estudos para estabelecer uma
correta densidade de energia para alcançar uma satisfatória profundidade de polimerização do Dyract..
Abstract
Introduction: Depth of cure could be a problem for the colored materials since darker
shades have reduced depth of cure in comparison to lighter shades.
Objectives: To determine if the depth of cure of different color compomer materials, with
different application protocols, is adequate and to compare their mean microhardness.
Materials and Methods: Ten specimens of each group, Twinky Star (VOCO, Cuxhaven,
Germany) and Dyract Extra (Dentsply International, Konstanz, Germany) color A3, were
prepared with standardized dimensions (2mm×4mm) and light cured as per manufacturer´s
instructions with a LED curing unit (bluephase 20i, Ivoclar Vivadent, Shaan, Liechtenstein)
at 570 mW/cm2 and at 1280mW/cm2. Evaluation of in vitro microhardness was performed
by means of Knoop microhardness using a micro-indentation tester (Duramin - Struers, WestLake, USA) with 98,12mN load for a dwell time of 10 sec. Knoop microhardness test was performed at two post-curing time delays: immediately (60 sec) after curing and after the post-irradiation curing time (24 hrs). Samples were stored in a dark for 24 hrs at 37ºC after the first microhardness analysis. Microhardness data from the top surface were treated with Kruskall-Wallis, Wilcoxon test and Mann-Whitney statistical tests. Statistical significance was set at 5%.
Results: More adequate microhardness ratios were found when a curing light with an
intensity of 1280mw/cm2 was used, than with a 570mW/cm2. Mean (standard deviation)
Knoop microhardness from the top of the specimens of each group varied from 15,88 KHN
in Group DL60, to 57,50 KHN in Group TSOH24.As for the materials mean microhardness,
according to the curing protocols, there were differences between Dyract (p<0,05) and most of the materials in every curing protocol.
Conclusion: Colored compomers have shown a good microhardness ratio when light curing
at 1280mW/cm2 is applied. More studies will be needed in order to determine the correct
energy density for the light curing of Dyract.
Palavras-Chave:
“Compómero colorido”; “Profundidade de polimerização”; “Microdureza Knoop”.
Keywords:
Introduction
In Dentistry, restorative materials are continuously changing in order to achieve an adequately clinical application, durability, strength and aesthetics. In Pediatric dentistry, several types of restorative materials can be selected according to the specific clinical situation. Namely, they are dental amalgam, stainless-steel crown, composites, sealants,
glass-ionomer, glass-ionomer modified with resin and recently the compomers(Rugg-Gunn
et al., 2001).
According to Soncini study in 2007, longevity of amalgam is higher than that of
resin-based composite (Soncini et al., 2007; Forss et al., 2003). The study found that
restorations replacement rate was 14,9% for composite and 10,8% for amalgam, over a
five-year period (Soncini et al., 2007). However, amalgam has gain notoriety in the last years due
to the mercury content, hence some parents request that other restorative materials may be
used (Tran and Messer, 2003). In alternative to dental amalgam, a preference has been given
to aesthetics with restorative materials such as composites, glass-ionomer, glass-ionomer modified with resin and recently the compomers. The clinicians demanding for these materials are enhancing also due to fluoride releasing, in order to avoid secondary caries,
and due to the conservative preparation required (Ertugrul et al., 2010;Olderog-Hermiston,
2000).
Even though, there are several studies that refer to the poorer performance of compomer materials in regards to amalgam (Soncini et al., 2007; Daou et al., 2009; Forss et al., 2003) some clinical research has shown that compomers survival rates are comparable to amalgam when used as restorative materials in class II cavities in primary molars after 24 months (Andersson-Wenckert, 1997; Mass et al., 1999; Papagionnoullis et al., 1999), 36 months (Roeters et al., 1998; Marks et al., 1999) and 42 months (Welbury et al., 2000). In a clinical study developed by Trachtenberg et al, and cited by Zimmerli (Zimmerli, 2010) no differences were found in new caries development in children who received compomer restorations compared to those who had amalgam restorations. Data on this subject is widespread, and controversial. Albeit, available evidence indicates that compomer can be as satisfactory as silver amalgam for restoring primary teeth (Andersson-Wenckert et al., 1997; Soncini et al., 2007; Daou et al., 2009;Vibeke et al., 2009; Rugg-Gunn et al., 2001).
Compomer or polyacid-modified resin-based composite was first introduced in Europe in 1993 then in Canada and in North America in 2003 (Croll et al., 2004; Ertugrul et
2
is, as the name suggests, a combination of composite and glass-ionomer containing a polymeric matrix, an ion-leachable glass, usually a calcium-aluminium-fluorosilicate glass and an acid (Meyer et al., 1998; Hedzelek et al., 2008; Carrilho et al., 2010; Zimmerli et al., 2010).
Compomer setting occurs by light-cure polymerization, followed by a secondary setting reaction (Meyer et al., 1998; Jedynakiewicz et al., 2001; Wiegand et al., 2007). Polymerization was found to continue up to 60h after the light was switched off, however it´s mechanical properties do not change beyond 24h post irradiation (Halvorson et al., 2002; Koupis et al., 2004; Nicholson et al., 2006). The secondary reaction, an acid base one, takes place when the material is exposed to the wet oral environment (Nicholson et al., 2006).
The absorption of water by compomers also leads to a fluoride-releasing activity at the surface of the glass-fillers particles (Meyer et al., 1998; Jedynakiewicz et al., 2001; Wiegand et al., 2007). This fluoride release was found insufficient to prevent formation of secondary caries by some authors (Van Dijken, 1997; Daou et al., 2009; Soncini et al., 2007) and, although it was stated that compomers release little fluoride during the first year after setting (Wiegand et al., 2007), Asmussen and Peutzfeld found that after this time the rate of fluoride release became equal to that of glass-ionomer (Asmussen and Peutzfeld, 2002).
Compomers behave more like composite resins than like glass-ionomers due to the very small amount of absorbed water, and consequently a lower effect of water on the materials stiffness, the lack of setting in the absence of light and the higher values of their mechanical properties (Tirtha, 1982, et al.; Meyer et al., 1998).
As mentioned before, compomers have indication to be used in the primary dentition, where the tooth enamel presents a higher wear rate than in the permanent tooth (Correr et al., 2007). According to Vandenbulcke et al., dental materials should have wear rates closer
to the tooth in order to avoid fracture of the material(Vandenbulcke et al., 2010). This wear
resistance of resin materials has been associated to their microhardness values (Mandikos et al., 2001).
Recently, colored compomers were introduced in the market to increase child compliance during the dental treatment by letting them choose their favorite color for the restoration. These compomer materials contain small amounts of glitter particles which produce a color effect in shades of silver, lemon, gold, orange, pink, purple, green and blue (Akbay Oba et al., 2009; Ertugrul et al., 2010).
There are two commercially available colored compomers named MagicFil (Zenith, Englewood, N.1, USA) and Twinky Star (Voco, Cuxhaven, Germany). Both of them are radiopaque and fluoride-releasing compomer filling system, to be used specifically in primary teeth (Croll et al., 2004). A study on the clinical performance of a colored compomer showed that the failure rate of the restorations was 3.9% (3 out of 77) and the clinical success of the restorations, as measured by anatomic form, marginal integrity, marginal discoloration, surface texture, maintenance of interproximal contact and secondary caries, was acceptable. Thus, the study showed that Twinky Star could be used as an alternative to tooth-colored compomers because of its high clinical success after 1 year (Akbay Oba et al., 2009; Ertugrul et al., 2010).).
A potential problem for these colored materials with very different shades is the depth of cure. Indeed, it has been found that darker shades, A4, of traditional composites and compomers have reduced depth of cure (i.e. conversion degree in depth) in comparison to lighter shades, A2 (Tirtha et al., 1982; Koupis et al., 2006; Vandenbulcke et al., 2010), and it is known that incomplete polymerization is associated to the reduction in mechanical properties (water sorption, wear resistance and strength) (Vandenbulcke et al., 2010) and biocompatibility with the increased content of residual monomers that have the potential to irritate soft tissues and pulp, stimulate the growth of bacteria and promote allergic reactions (Pilo et al., 2007; Moore et al., 2008). Furthermore, the lower degree of conversion of the polymers can also lead to altered clinical performance due to esthetic impairment, with high tendency to surface staining and marginal leakage (Pilo et al., 2007; Camargo et al., 2009).
The depth of cure of compomers is dependent not only on material factors, such as type of photo initiator, resin chemistry, filler fraction, particle size and optical properties (shade, translucency, refractory index) but also on factors directly related to the visible light curing source (Pilo et al., 1999; Nicholson et al., 2006; Moore et al., 2008; Bala et al., 2009). It has been proven that intensity and spectrum of light curing device, size, location and orientation of the tip of the source, and illumination time can influence the degree to which the bottom of a 2mm thickness increment of material is cured (Hubbezoglu et al., 2007; Moore et al., 2008; Bala et al., 2009).
As a result of a reduced illumination, the surface of the restoration may be cured, while incomplete polymerized composite may remain underneath resulting in a reduction of the curing effectiveness and a limited depth of cure (Pilo et al., 1999; Hubbezoglu et al., 2007).
Objectives
The main aims of the current study were:
- to determine if the depth of cure of different color compomer materials cured with two light-curing intensities, and with two time delays after light curing, is adequate.
- to compare the mean microhardness of different color compomer materials, processed with different curing protocols, i.e. two light-curing intensities, and two time delays after light curing.
Specifically the objectives to be study were:
1- Verify whether the indirect depth of cure was adequate for the different compomer colors tested.
H0: The indirect depth of cure was adequate for all the different compomer colors. H1: The indirect depth of cure was not adequate for all the different compomer colors.
2- Verify whether there was an effect of the light-curing intensity on the indirect depth of cure of the compomer.
H0: The number of materials tested that yielded an adequate indirect depth of cure was the same independently of the light-curing intensity used.
H1: The number of materials tested that yielded an adequate indirect depth of cure changed with different light-curing intensity used.
3- Verify whether there was an effect of the light curing time delays on the indirect depth of cure of the compomer.
H0: The number of materials tested that yielded an adequate indirect depth of cure was the same independently of the light curing time delays.
H1: The number of materials tested that yielded an adequate indirect depth of cure changed after different light curing time delays.
4- Determine the influence of the post-curing time delay on the mean microhardness of the different compomer colors tested, for each light curing intensity.
6
H0: Post curing time delay did not influence the mean microhardness of the different compomer colors tested.
H1: Post curing time delay did influence the mean microhardness of the different compomer colors tested.
5- Determine the influence of the light curing intensity on the mean microhardness of the different compomer colors for each post-curing time delay.
H0: The different light curing intensities did not influence the microhardness of the different colors tested.
H1: The different light curing intensities influenced the microhardness of the different colors tested
Materials and Methods
The materials tested in the current study were Twinky Star (VOCO, Cuxhaven, Germany) colors: blue, berry, gold, green, lemon, orange, pink, and silver) and Dyract Extra (Dentsply International, Konstanz, Germany), color A3. Material composition is presented in Table A1 in appendix.
Samples (n=10) were made in an acrylic mold (Samplkwick Liquid Fastcure Acrylic-USA) where the hole for the restorative material (2mm width and 4mm diameter dimensions measured by a caliper- Digimat Caliper Mitutoyo- Japan) was filled (0,09g of material), and light cured as per manufacturer´s instructions (40 seconds for the Twinky Star and 10 seconds for the Dyract Extra). The acrylic mold was placed on top of the vestibular face of an incisor tooth that was embedded in an acrylic transparent bloc in order to reproduce the refractive index of a tooth cavity (Figure 1). An acetate matrix was placed on each side of acrylic mold to avoid compomer overflow and adhesiveness to the surface. The material was compressed by a glass plate before light curing with a LED curing unit (bluephase 20i, Ivoclar Vivadent, Shaan, Liechtenstein).
LED´s intensity was confirmed using a radiometer (bluephase meter, Ivoclar Vivadent, Shaan, Liechtenstein). Light cure of each group of material was performed with
two different curing programs: LED´s bluephase low power (intensity at 570 mW/cm2) and
LED´s bluephase high power (intensity at 1280mW/cm2).
Evaluation of in vitro microhardness was performed by means of Knoop microhardness using a micro-indentation tester (Duramin - Struers, WestLake, USA) with 98,12mN load for a dwell time of 10 sec (Figure 2). Three indentations (one in center and two close to the edges) were made in each surface. Knoop microhardness test was performed at two curing time delays: immediately (60 sec) after curing and after the post-irradiation curing time (24 hrs). Samples were stored in a box involved with aluminum foil in order to shield it from light and kept for 24 hrs at 37ºC after the first microhardness analysis.
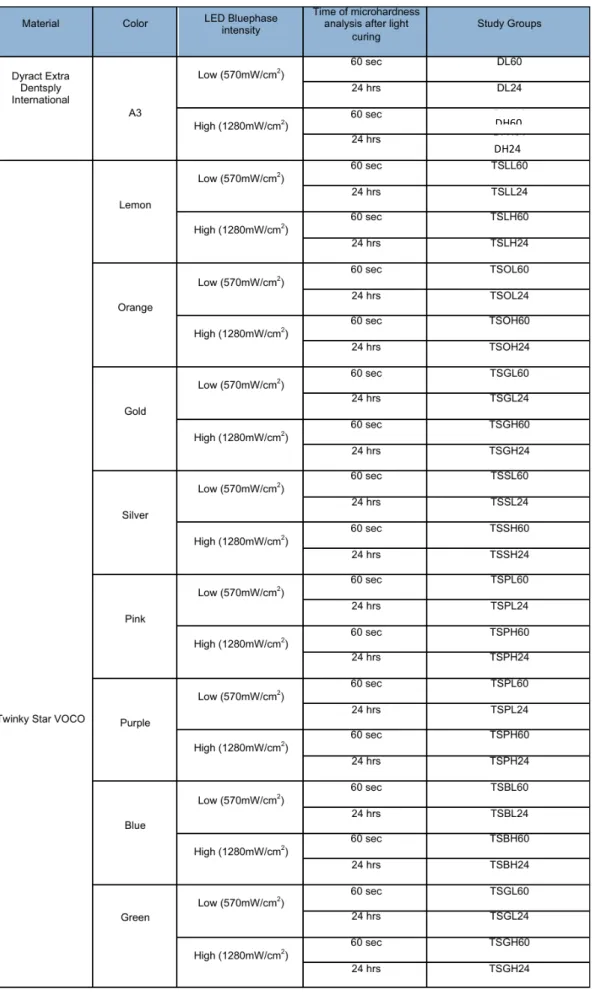
This way, before microhardness measurements each sample was subjected to a different light curing protocols. These protocols were based on the light curing intensity and on the post curing time delay. This study design led to the formulation of 36 subgroups of specimens that are described in Table 1.
8
Mean Knoop microhardness values were compared between the top and the bottom surfaces of each specimen in order to indirectly assess the depth of cure. Ratios above 80% were considered to express good depth of cure.
Microhardness data from the top surface were treated with SPSS, version 21.0 (SPSS Inc. Chicago, IL 60606, EUA). Kolmogorov-Smirnov statistical test and Levene were used to assess the normality and variance homogeneity. Microhardness data from the top of the specimens were compared using Kruskall-Wallis and post hoc test used was LSD pairwise comparisons, for the 9 different materials with each curing protocol.
Wilcoxon test was used to compare the microhardness after each post curing time delay (60sec and 24hrs).
Mann-Whitney test was used to compare the mean microhardness provided by each light curing intensity.
Statistical significance was fixed at 5%.
Figure 1- Acrylic transparent bloc with an incisor used to reflect the curing light at
the base of the specimens
Figure 2- Micro-indentation tester (Duramin - Struers,
WestLake, USA) where was preformed the Knoop microhardness.
Table 1- Description of 36 subgroups of specimens led to different curing protocols: each
material at low intensity and high intensity and two different curing time delay.
DH60 DH24
Results
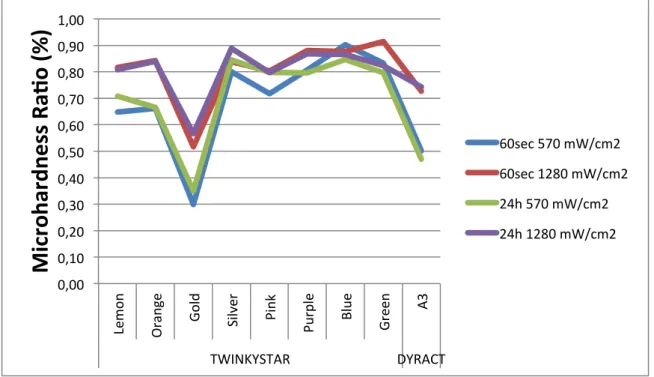
Microhardness ratios are presented in Figure 3 and in Table A2 in appendix.
There were more adequate microhardness ratios for every color when a curing light
with an intensity of 1280mw/cm2 was used than with a 570mW/cm2. For the higher intensity
only the TS gold (0,52 at 60 sec and 0,57 at 24 hrs post-curing time delay) and Dyract A3 (0,73 at 60 sec and 0,74 at 24 hrs post-curing time delay) had ratios below 80%.
At low intensity and 60 sec post curing time delay, Knoop ratios above of 80% were found only in TS silver (0.80), TS purple (0,81), TS blue (0.90) and TS green (0,83) colors. After a post-curing time delay of 24hrs, Knoop ratios above of 80% were found in the same colors as for the 60 sec post curing time delay and also in TS pink (0,80).
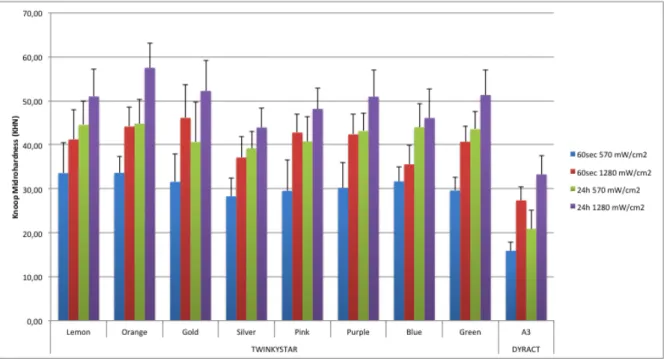
Mean (standard deviation) Knoop microhardness from the top of the specimens of each group are presented in figures 4 to 7 below and in table A3 and Figure A2 at the appendix, and varied from 15,88 KHN in Group DL60, to 57,50 KHN in Group TSOH24.
0,00 0,10 0,20 0,30 0,40 0,50 0,60 0,70 0,80 0,90 1,00 Le m on O ran ge Gol d Silv er Pi nk Pu rp le Bl ue Green A3 TWINKYSTAR DYRACT
Mi
cr
oh
ar
dn
es
s
Ra
.o
(%)
60sec 570 mW/cm2 60sec 1280 mW/cm2 24h 570 mW/cm2 24h 1280 mW/cm2
Figure 3- Depth of cure ratios for Twinky Star colors and Dyract A3, measured
immediately after being light cured (60sec), and after 24hrs post curing time delay.
12
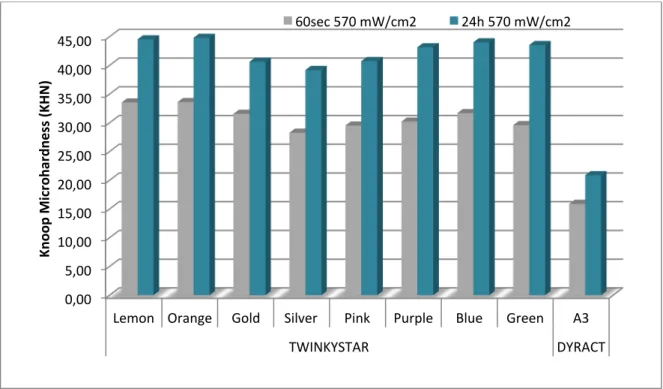
Figure 4- Knoop microhardness of the tested materials 60 sec after irradiation with a
570mW/cm2 LED unit.
Figure 5- Knoop microhardness of the tested materials 60 sec after irradiation with a
Figure 6- Knoop microhardness of the tested materials 24 hrs after irradiation with a
570mW/cm2 LED unit.
Figure 7- Knoop microhardness of the tested materials 24 hrs after irradiation with a
1280mW/cm2 LED unit. 0,00 10,00 20,00 30,00 40,00 50,00 60,00
Lemon Orange Gold Silver Pink Purple Blue Green A3 TWINKYSTAR DYRACT Kn oo p Mi cr oh ar dn es s (K H N )
Knoop Microhardness
a6er 24 h (1280mw/cm2)
14
Figure 8- Knoop microhardness for each material cured with a 570mW/cm2 LED. The
comparison is made between 60sec and 24hrs post-curing delay time. After 24 hrs there was a significant increase in KHN for all the materials tested (p<0,05).
Figure 9- Knoop microhardness for each material cured with a 1280mW/cm2 LED. The
comparison is made between 60sec and 24hrs post-curing delay time. After 24 hrs there was a significant increase in KHN for all the materials tested (p<0,05).
0,00 5,00 10,00 15,00 20,00 25,00 30,00 35,00 40,00 45,00
Lemon Orange Gold Silver Pink Purple Blue Green A3 TWINKYSTAR DYRACT Kn oo p Mi cr oh ar dn es s (K H N ) 60sec 570 mW/cm2 24h 570 mW/cm2 0,00 10,00 20,00 30,00 40,00 50,00 60,00
Lemon Orange Gold Silver Pink Purple Blue Green A3 TWINKYSTAR DYRACT Kn oo p Mi cr oh ar dn es s (K H N ) 60sec 1280 mW/cm2 24h 1280 mW/cm2
Homogeneity and Normality and were rejected by Levene (Table A4, in appendix) and Kolmogorov-Smirnov statistical tests (Table A5, in appendix) and non-parametric tests were used.
As presented in Table A6 in appendix, the Wilcoxon test showed a significant increase in mean microhardness for all the materials tested after 24 hrs post curing delay time (p<0,05) (Figure 8 and 9).
Higher curing light intensity led to higher mean microhardness for all the materials tested (p<0,05) except for the TSBlue that yielded similar mean hardness when light cured
with 570mw/cm2 or 1280mw/cm2 (p>0,05).
As for the materials mean microhardness, according to the curing protocols, there were differences between Dyract (p<0,05) and most of the materials in every curing protocol. Exceptions to these were found between the pairs DL60/TSL60, DH60/TBH60, DH60/TSH60, DL24/TSL24, DH24/TSH24, DH24/TBH24 and DH24/TPH24 that were not different (p>0,05). Further differences were found at the 24hrs post curing delay time and
1280mw/cm2 curing protocol, between the pairs TSH24/TLH24 and TSH24/ TOH24
Discussion
The present study aimed at examining if different compomer colors could have different depth of cure and different mean microhardness. Different curing protocols were used, to understand how light intensity and post-curing time delay could affect the variables to be study.
Microhardness data provides information about the material properties related to hardness such as wear resistance (Mandikos et al., 2001), compressive strength, proportional limit and ductility (Anusavice and Brantley, 2003). According to Souza (1982, apud Poskus, 2004) Knoop hardness is mainly used in low elastic modulus materials such as the compomer that were analyzed in this study. The impression is rhombic and the length of the largest diagonal was measured, to avoid errors introduced by elastic recovery, since after the indentation, elastic recovery occurs mostly along the shorter diagonal (Anusavice and Brantley, 2003).
Microhardness analysis of the compomer materials has been used in other studies to assess its depth of cure (Batu Can Yaman et al., 2011; Koupis et al., 2004). This indirect method can evaluate the depth of cure of the materials by comparing micro hardness values from the bottom and the top surfaces of 2mm specimens (Hubbezoglu et al., 2007; Camargo et al., 2009) and a ratio above 80% has been used to indicate a good depth of cure (Moore et al., 2008).
Other methods have been used to determine depth of cure (Moore et al., 2008). However the microhardness ratio has good correlation to the direct methods (DeWald and
Ferracane, 1987; Ferracane et al., 1985). Furthermore, no significant difference was found,
in a study performed by Koupis et al in 2004, between the depth of cure of a compomer when it was measured by scraping away uncured material, as indicated by ISO (ISO, 2000), or by means of micro hardness (Koupis et al., 2004).
Depth of cure depends on the dissemination of the curing light into the material (Soh
et al., 2003) resulting in an accurate and efficient light transmission to the bottom of the
specimen and a greater conversion degree that leads to increase hardness.
As studied by Lim and Lee (Lim and Lee, 2007) the material used to promote light reflection at the bottom of the specimen can influence the material´s depth of cure. Therefore, in the present study, samples were produced over the vestibular surface of an
18
incisor embedded in an acrylic bloc (Portugal, 2008), to closer reproduce the clinical setting of a restoration.
There is a well-defined relationship between resin optical properties and depth of cure, which also depends on spectral output, irradiance and exposure time associated with the curing light (Howard et al., 2010). It was found that as the refractive index of the base monomer became closer to the filler, the curing depth of compomer became deeper (Fugita et al., 2005). As the difference in refractive index between resin and filler narrows, scattering coefficient decreases and transmission efficiency improves (Howard et al., 2010). Based on the optical properties, the dependence of refractive index between the pigmented filler, known as the glitter, and the resin could explain why some colors had acceptable depth of cure and others did not.
TS Gold and Dyract A3 failed to reach acceptable depth of cure with all the curing protocols. Thus, the first null hypothesis had to be rejected. The glitter found in TSGold was yellowish, and the one found in the other colors was greyish. Due to this fact different colors were photographed with a steromicroscope (EMZ-873, Meiji, Japan) with an imaging software (IM50, version 4, Leika, UK) to further understand their structure and discard possible differences. The images are presented in Figure A1 in appendix, and due to the glittering effect do not represent exactly the differences found. Unfortunately the information on the materials components is sparse and could not verify this fact, however, as discussed above, differences in the glitter could explain differences in depth of cure. As far as Dyract is concern, the manufacturer recommends 10 sec curing time, lower than the 40 sec recommended for the Twinky Star, and this could explain the unacceptable depth of cure yielded by this material. Further work should be developed with Dyract, in order to determine the right curing time to achieve acceptable depth of cure.
In the present study, the colors Lemmon, Orange and Pink presented an increase in depth of cure to acceptable levels after being cured with a higher intensity light. Therefore the second null hypothesis was also rejected. This fact could also relate to the transmission efficiency of the material, that for these colors would be overtaken with a higher intensity light.
Conversely to the results from the present work, a study from Atabek et al. determined the depth of cure using Fourier Transform Infrared Spectrometer and concluded that the silver colored samples showed the poorest DC results, which ranged from 13% to 18%
(Atabek et al., 2011). These results are in conflit with our study, but the method used was different, and could justify these differences.
On the other hand, as expected, post curing time delay had not a major impact in the depth of cure of the materials as post-irradiation curing takes place at the top and at the bottom of the specimens, and the ratio does not change. The third null hypothesis was accepted.
The results from the present work are substantiated by another study on the curing depth of a colored compomer by means of penetrometer test. Vandenbulcke et al. study concluded that depth of cure differed significantly among the colors and Twinky Star Blue yielded the highest depth of cure. The curing device with the highest energy density exhibited the highest curing depths (Vandenbulcke, et al., 2010). In the present study it is also clear that there is a close relationship between the light intensity and the depth of cure of the materials.
Higher light intensity also led to a significant increase in mean microhardness of all the materials, except for the TSBlue. The fourth null hypothesis was rejected. This was could be due to the comparatively low hardness values yielded by TSBlue, after light-cured
with 1280mw/cm2. While for TSSilver and Dyract that yielded similar mean hardness values
as TSBlue after light-cured with 1280mw/cm2, the values were already low when they were
cured with a low intensity light, therefore for these the increase in hardness was significant. Mean microhardness at the top of the surface significantly increased in all the materials tested at 24 hrs post-curing time delays, also as expected, due to the documented post-irradiation curing of these materials (Halvorson et al., 2002; Koupis et al., 2004; Nicholson et al., 2006). Thus the fifth null hypothesis was rejected.
Once again, now with mean top surface microhardness, low irradiation time of Dyract could be the cause for the lower mean microhardness of this material when compared to the others. However for this particular variable, since Twinky Star and Dyract are different materials, they could have differences between microhardness that would not be related solely to the conversion degree since for instances it has been reported that increasing the filler content in the composite is associated with greater surface hardness (Lambrechts et al., 2006; Hubbezoglu et al., 2007; Batu Can Yaman et al., 2011).
20
Clinical significance
Microhardness of compomer materials increased after 24 hrs postcuring time delay and care should be taken to accommodate this change when clinically applying this material. Also a higher intensity light-curing unit should be used in order to achieve the highest possible hardness of the material, and the highest depth of cure, i.e. a better degree of conversion with increase properties.
For Dyract A3 Extra curing time recommended by the manufacturer is not enough to guarantee good properties of the material.
Conclusion
Within the limitations of the present in vitro study, it is concluded that:
1- There were more acceptable microhardness ratios for every color after being cured
with a 1280mw/cm2 curing light than after 570mW/cm2.
2- The unacceptable depth of cure found in Dyract was probably related to the insufficient curing time recommended by the manufacturer.
3- Post curing time delay had not a major impact in the depth of cure of the materials. 4 - Microhardness of compomer materials increase after 24 hrs post-curing time delay.
References
1. Akbay Oba A, Sönmez IS, Sari S (2009). “Clínical Evaluation of a Colored Compomer in Primary Molars.” Med Princ Pract 18(1): 31-34.
2. Andersson-Wenckert IE, Folkesson UH,Van Dijken JW (1997). “Durability of a polyacid-modified composite resin (compomer) in primary teeth: a multi centre study.” Acta Odontol Scand 55(4): 255-260.
3. Anusavice KJ, Brantley WA (2003). “Physical properties of dental materials.” In:
AnusaviceKJ. Phillip’s Science of dental materials. 11th ed., Elsevier Science, St
Louis, USA: 41-71.
4. Asmussen E, Peutzfelt A (2002). “Long-term fluoride release from a glass ionomer cement, a compomer, and from experimental resin composites.” Acta Odontol Scand
60(2): 93-97.
5. Atabek D, Bodur H, Kalayci S, Baygin O, Tirali E (2011). “Conversion Degrees of a Colored Compomer in Different Colors Utilized by Various Curing Times.” J Dent Child 78(2): 83-87.
6. Bala O, Arisu HC, Kivanc BH, Samur S (2009). “Effect of different light curing systems on the shear bond strength of resin-modified glass ionomer cement and polyacid-modified composite resin.” J Dent and Oral Hygiene 1(2): 17-21.
7. Batu Can Yaman, Begum Guray Efes, Can Dorter, Yavuz Gomec, Dina Erdilek, Sami Buyukgokçesu (2011). “The effects of halogen and light-emitting diode light curing on the depth of cure and surface microhardness of composite resins.” J Conservative Dentistry 14(2): 136-139.
8. Camargo EJ, Moreschi E, BaseggioW, Cury JA, Pascotto RC(2009). “Composite
depth of cure using four polymerization techniques.” J Applied Oral Science 17(5): 446-450.
9. Carrilho E, Marques S, Moreira F, Paula A, Tomaz J (2010). “Materiais restauradores libertadores de flúor.” Revista Portugues Estomatologia Medicina Dentária e Cirurgia Maxilofacial 51(1): 27-34.
10. Correr GM, Alonso RCB, Consani S, Puppin-Rontani RM, Ferracane JL (2007). “In vitro wear of primary and permanent enamel. Simultaneous erosion and abrasion.” Am J Dentist 20(6): 394-399.
11. Croll TP, Helpin ML, Donly KJ (2004). “Multi-colored Dual-cured Compomer.” Pediatr Dent 26(3): 273-276.
24
12. Daou M, Attin T, Gohring T (2009). “Clinical success of compomer and amalgam restorations in primary molars. Follow up in 36 months.” Schweiz Monatsschr Zahnmed 119(11): 1082-1088.
13. DeWald JP, Ferracane JL (1987). “A comparison of four modes of evaluating depth of cure of light-activated composites.” J Dent Res 66(3): 727-30.
14. Ertugrul F, Cogulu D, Ozdemir Y, Ersin N (2010). “Comparison of Conventional versus Colored Compomers for Class II Restorations in Primary Molars: A 12-Month Clinical Study.” Medical Principles Practice 19(2): 148–152.
15. Ferracane JL (1985). “Correlation between hardness and degree of conversion during the setting reaction of unfilled dental restorative resins.” Dent Mate 1(1): 11-4. 16. Forss H, Widstrom E (2003). “The post-amalgam era: a selection of materials and
their longevity in the primary and young permanent dentitions.” Int J Paediatr Dent
13(3): 158-64.
17. Fujita K, Nishiyama N, Nemoto K, Okada T, Ikemi T (2005). “Effect of base monomer´s refractive índex on curing depth and ploymerization conversion of phto-cured resin composites.” Dental Mat J 24(3): 403-408.
18. Halvorson RH, Erickson RL, Davidson CL (2002). “Energy dependent polymerization of resin-based composite.” Dental Mater 18(6): 463-469.
19. Hedzelek W, Wachowiak R, Marcinkowska A, Domka L (2008). “Infrared spectroscopic identification of chosen dental materials and natural teeth.” Acta Physica Plonica 114(2): 471-484.
20. Howard B, Wilson ND, Newman SM, Pfeifer CS, Stansbury (2010). “Relationships between conversion, temperature and optical properties during composite photopolymerization.” Acta Biomater 6(6): 2053-2059.
21. Hubbezoglu I, Bolayir G, Doğan OM, Doğan A, Ozer A, Bek B (2007). “Microhardness Evaluation of Resin Composites Polymerized by Three Different Light Sources.” Dental Materials J 26(6): 845-853.
22. ISO 4049. Dentistry – Polymer – Based filling, restorative and luting materials. International Standard. 2000.
23. Jedynakiewicz NM, Martin N (2001). “Expansion behavior of compomer restoratives.” Biomaterials 22(7): 743-748.
24. Koupis N, Vercruysse C, Marks L, Martens L, Verbeeck R (2004). “Curing depth of (polyacid-modified) composite resins determined by scraping and a penetrometer.” Dental Materials 20(10): 908-914.
Van Meerbeek B (2006). “Degradation of tooth Structure and Restorative Materials: A review Wear.” Tribocorrosion 261(9): 980-986.
26. Lim Y-K and Lee Y-K (2007). "Influence of light transmittance and background reflectance on the light curing of adhesives used to bond esthetics brackets." Am J Ortho & Dentofacial Orthopedics 132(1): 5.e17-5.e24.
27. Mandikos MN, McGivney GP, Davis E, Bush PJ, Carter JM Mandikos MN, McGivney GP (2001). “A comparison of the wear resistance and hardness of indirect composite resins.” J Prosthet Dent 85(4): 386-395.
28. Marks LAM, Weerheijm KL, Van Amerongrn WE, Groen HJ (1999). “ Dyract versus Tytin class II restorations in primary molars: 36 months evaluation.” Caries Research
33(5): 143-148.
29. Meyer JM, Cattani-Lorente MA, Dupuis V (1998). “Compomers: between glass-ionomer cements and composites.” Biomaterials 19(6): 529-539.
30. Moore BK, Platt JA, Borges G, Chu T-M G, Katsilieri I (2008). “Depth of Cure of Dental Resin Composites: ISO 4049 Depth and Microhardness of Types of Materials and Shades.” Op Dent 33(4): 408-412.
31. Nicholson JW (2007).“Polyacid-modified composite resins (“compomers”) and their use in clinical dentistry.” Dental Materials 23(5): 615-622
32. Olderog-Hermiston E (2000). PEDIARIC DENTISTRY. ACCESS – SPECIAL
SUPLEMENTAL ISSUE. 1: 1-20.
33. Papagionnoulis L, Kakaboura A, Pantaleon F, Kavvadia K (1999). “Clinical evaluation of a polyacid-modified resin composite (compomer) in class II restorations in primary teeth: a two years follow-up study.” Paediatrics Dentistry
21(4): 231-234.
34. Pilo R, Oelgiesser D, Cardash HS (1999). “A survey of output intensity and potential for depth of cure among light-curing units in clinical use.” J Dent 27(3): 235–241. 35. Roeters JJM, Frankenmolen F, Burgersdijk RCW (1998). “Clinical evaluation of
Dyract in primary molars: 3 years results.” American J Dentist 11(3): 143-148. 36. Rugg-Gunn AJ, Welbury RR, Toumba J (2001). “British Society of Paediatric
Dentistry: a policy document on the use of amalgam in paediatric dentistry.” Int J Paediatric Dentist 11(2): 233-238.
37. Soh MS, Yap AU, Siow KS (2003). “The effectiveness of cure of LED and halogen
curing lights at varying cavity depths.” Oper Dent 28(6): 707-715.
38. Soncini JA, Maserejian NM, Trachtenberg F, Tavares M, Hayes C (2007). “The longevity of amalgam versus compomer/ composite restorations in primary and
26
permanent teeth. Findings from the New England Children´s Amalgam Trial.” JADA
138(6): 763-772.
39. Tirtha R, Fan PL, Dennison JB, Powers JM (1982). “In vitro depth of cure of Photo-activated composites.” J Dental Research 10(61): 1184-1187.
40. Van Dijken JW (1996). “Three-year clinical evaluation of a compomer, a resin modified glass ionomer and a resin composite in Class II restorations.” Am J Dent
9(5): 195-198.
41. Vandenbulcke JD, Marks LA, Martens LC, Verbeeck RM (2010). “Comparison of curing depth of a colored polyacid-modified composite resin with different light-curing units.” Quintessence Int 41(9): 787-794.
42. Vandewalle KS, Ferracane JL, Hilton TJ, Erickson RL, Sakaguchi RL (2004). “ Effect of energy density on properties and marginal integrity of posterior resin composite restorations.” Dental Mat 20(1): 96-106.
43. Vibeke Q, Agneta P, Teglers PT, Mjor I (2010). “The longevity of different restorations in primary teeth.” International J Paediatric Dentist 20(1): 1-7.
44. Welbury RR, Shaw AJ, Murray JJ, Gordon PH, McCabe JF (2000). “Compomer versus glass-ionomer cement in paired cavities in primary molars: final results after 42 months.” British Dentist J 189(2): 93-97.
45. Wiegand A, Buchalla W, Attin T (2007). “Review on fluoride- releasing restorative materials- Fluoride release and uptake characteristics, antibacterial activity and influence on caries formation.” Dental Mat 23(3): 343-362.
46. Zimmerli B, Strub M, Jeger F, Stadler O, Lussi A (2010). “Composite materials: composition, properties and clinical applications.” Schweiz Monatsschr Zahnmed
Appendix
Materials Types Composition
Twinky Star
LOT1301096; Val:02/2016;
Compomer SiO2- silicon dioxide or silica
FAISi- fluoro alumino silicate glass
CDMA-2-hydroxy-1,3-dimethacryloxy-propane GDMA- glyceryl dimethacrylate
HMWHP- high-molecular-weight hydrophilic polymer 77,5 wt% filler and 0,7µm average filler size
Dyract eXtra LOT 1212000671; Val: 11/2014;
Compomer ethoxylated Bisphenol-A-dimethacrylate (BisGma);
urethane dimethacrylate (UDMA);
carboxylic acid modified dimethacrylate (TCB resin); triethylene glycol dimethacrylate (TEGDMA),
trimethylolpropane trimethacrylate resin,(TMPTMA); camphorquinone, alumino-sodium-fluoro-phosphor-silicate glass, highly dispersed silicon dioxide, strontium fluoride, iron oxide,
titanium oxide pigments 0,8µm average filler size
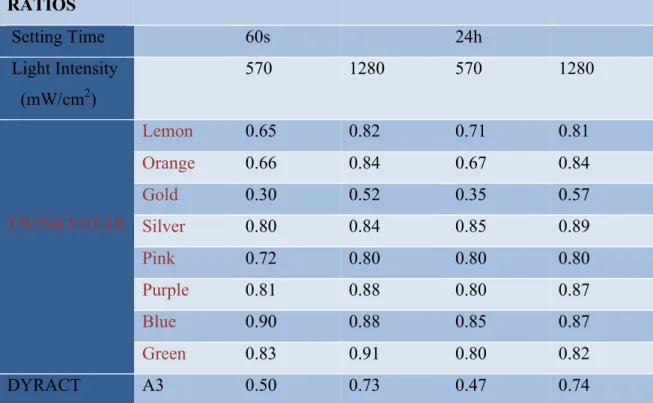
ii RATIOS Setting Time 60s 24h Light Intensity (mW/cm2) 570 1280 570 1280 TWINKYSTAR Lemon 0.65 0.82 0.71 0.81 Orange 0.66 0.84 0.67 0.84 Gold 0.30 0.52 0.35 0.57 Silver 0.80 0.84 0.85 0.89 Pink 0.72 0.80 0.80 0.80 Purple 0.81 0.88 0.80 0.87 Blue 0.90 0.88 0.85 0.87 Green 0.83 0.91 0.80 0.82 DYRACT A3 0.50 0.73 0.47 0.74
Table A2: Microhardness Knoop Ratios for each material with diferent curing protocols
Figure A1- Picture of each TS color taken in steromicroscope (EMZ-873, Meiji, Japan)
following the color guide above.
Table A3- Descriptive Statistics from top surface Knoop microhardness data, with means
iv
Figure A2 – Knoop Microhardness values for each material tested after each curing
protocol.
Table A4 - Levene test
Curing_device
Levene
Statistic df1 df2 LED 570mW/cm2 Knoop_Microhardness_
60sec Based on Mean
Based on Median Based on Median and with adjusted df
Based on trimmed mean Knoop_Microhardness_
24h Based on Mean
Based on Median Based on Median and with adjusted df
Based on trimmed mean LED 1280mW/cm2 Knoop_Microhardness_
60sec Based on MeanBased on Median Based on Median and with adjusted df
Based on trimmed mean Knoop_Microhardness_
24h Based on Mean
Based on Median Based on Median and with adjusted df
Based on trimmed mean
4,284 8 8 1 ,000 3,024 8 8 1 ,005 3,024 8 52,828 ,007 4,259 8 8 1 ,000 2,642 8 8 1 ,013 2,445 8 8 1 ,020 2,445 8 61,670 ,023 2,624 8 8 1 ,013 2,470 8 8 1 ,019 1,969 8 8 1 ,061 1,969 8 65,698 ,064 2,455 8 8 1 ,020 ,453 8 8 1 ,885 ,394 8 8 1 ,921 ,394 8 68,064 ,920 ,459 8 8 1 ,881
Test of Homogeneity of Variance
Curing_device Sig.
LED 570mW/cm2 Knoop_Microhardness_
60sec Based on MeanBased on Median Based on Median and with adjusted df
Based on trimmed mean Knoop_Microhardness_
24h Based on Mean
Based on Median Based on Median and with adjusted df
Based on trimmed mean LED 1280mW/cm2 Knoop_Microhardness_
60sec Based on Mean
Based on Median Based on Median and with adjusted df
Based on trimmed mean Knoop_Microhardness_
24h Based on Mean
Based on Median Based on Median and with adjusted df
Based on trimmed mean
,000 ,005 ,007 ,000 ,013 ,020 ,023 ,013 ,019 ,061 ,064 ,020 ,885 ,921 ,920 ,881
Curing_device
Table A5 – Kolmogorov-Smirnov test
Table A6 – Kruskall-Wallis for Knoop microhardness data of the top surface of each
material after light curing with an intensity of 570mw/cm2 .
Curing_device Case Number Value 3 4 5 9 6 31,50 9 4 31,63 9 1 31,87 Tests of Normality Curing_device Kolmogorov-Smirnova Shapiro-Wilk
Statistic df Sig. Statistic df Sig.
Knoop_Microhardness_
60sec LED 570mW/cm2LED 1280mW/cm2 Knoop_Microhardness_ 24h LED 570mW/cm2 LED 1280mW/cm2 ,068 9 0 ,200* ,978 9 0 ,129 ,070 9 0 ,200* ,988 9 0 ,553 ,151 9 0 ,000 ,892 9 0 ,000 ,087 9 0 ,092 ,982 9 0 ,241
This is a lower bound of the true significance. *.
Lilliefors Significance Correction a.
Test of Homogeneity of Variance
Curing_device
Levene Statistic LED 570mW/cm2 Knoop_Microhardness_
60sec Based on Mean
Knoop_Microhardness_ 24h Based on Mean LED 1280mW/cm2 Knoop_Microhardness_ 60sec Based on Mean Knoop_Microhardness_ 24h Based on Mean .a .a .a .a
There are not enough unique spread/level pairs to compute the Levene statistic. a.
*Nonparametric Tests: Independent Samples. NPTESTS
/INDEPENDENT TEST (Knoop_Microhardness_60sec Knoop_Microhardness_24h) GROUP (Material) KRUSKAL_WALLIS(COMPARE=PAIRWISE) /MISSING SCOPE=ANALYSIS USERMISSING=EXCLUDE
/CRITERIA ALPHA=0.05 CILEVEL=95.
Nonparametric Tests
vi
Figure A3- Box plot of Knoop microhardness values on top surface of each material group
Table A7- Pairwise LSD post-hoc statistical test- Comparisons of microhardness values
from the top surface of each material group specimens measured immediately (60sec) after
viii
Figure A4- Box plot of Knoop microhardness values on top surface of each material group
specimens measured after the post-irradiation curing (24hrs) that followed the light curing
Table A8- Pairwise LSD post-hoc statistical test- Comparisons of microhardness values
from the top surface of each material group specimens measured after the post-irradiation
x
Table A9 – Kruskall-Wallis for Knoop microhardness data of the top surface of each
material after light curing with an intensity of 1280 mw/cm2.
Figure A5- Box plot of Knoop microhardness values on top surface of each material group
specimens measured immediately (60sec) after light curing with an intensity of
Table A10- Pairwise LSD post-hoc statistical test- Comparisons of microhardness values
from the top surface of each material group specimens measured immediately (60sec) after
xii
Figure A6- Box plot of Knoop microhardness values on top surface of each material group
specimens measured after the post-irradiation curing (24hrs) that followed the light curing
Table A11- Pairwise LSD post-hoc statistical test- Comparisons of microhardness values
from the top surface of each material group specimens measured after the post-irradiation
xiv
Table A12- Wilcoxon Signed Rank Test- Comparisons between Knoop microhardness
values, of the top surface of each material group, measured immediately (60sec) after light curing and after the post-irradiation curing (24hrs) that followed light curing.
Test Statisticsa Curing_device Material Knoop_Micro hardness_24 h - Knoop_Micro hardness_60 sec LED 570mW/cm2 TS Lemmon Z
Asymp. Sig. (2-tailed) TS Orange Z
Asymp. Sig. (2-tailed)
TS Gold Z
Asymp. Sig. (2-tailed) TS Silver Z
Asymp. Sig. (2-tailed)
TS Pink Z
Asymp. Sig. (2-tailed) TS Purple Z
Asymp. Sig. (2-tailed)
TS Blue Z
Asymp. Sig. (2-tailed) TS Green Z
Asymp. Sig. (2-tailed) Dyract A3 Z
Asymp. Sig. (2-tailed) LED 1280mW/cm2 TS Lemmon Z
Asymp. Sig. (2-tailed) TS Orange Z
Asymp. Sig. (2-tailed)
TS Gold Z
Asymp. Sig. (2-tailed) TS Silver Z
Asymp. Sig. (2-tailed)
TS Pink Z
Asymp. Sig. (2-tailed) TS Purple Z
Asymp. Sig. (2-tailed)
TS Blue Z
Asymp. Sig. (2-tailed) TS Green Z
Asymp. Sig. (2-tailed) Dyract A3 Z
Asymp. Sig. (2-tailed)
- 2 , 8 0 3b , 0 0 5 - 2 , 8 0 3b , 0 0 5 - 2 , 4 9 7b , 0 1 3 - 2 , 8 0 3b , 0 0 5 - 2 , 6 0 1b , 0 0 9 - 2 , 8 0 3b , 0 0 5 - 2 , 8 0 3b , 0 0 5 - 2 , 8 0 3b , 0 0 5 - 2 , 8 0 5b , 0 0 5 - 2 , 8 0 3b , 0 0 5 - 2 , 8 0 3b , 0 0 5 - 2 , 4 9 7b , 0 1 3 - 2 , 5 9 9b , 0 0 9 - 2 , 4 9 7b , 0 1 3 - 2 , 5 9 9b , 0 0 9 - 2 , 8 0 3b , 0 0 5 - 2 , 8 0 3b , 0 0 5 - 2 , 7 0 1b , 0 0 7 Wilcoxon Signed Ranks Test
a.
Based on negative ranks. b.