Repeatability of fruit traits from two
Hancornia speciosa
populations from the core region of the Brazilian Cerrado
Carlos Eduardo Lazarini da Fonseca(1), Fernanda Monteiro de Morais(1), Helenice Moura Gonçalves(1), Fabiana de Gois Aquino(1) and Fernando Souza Rocha(1)
(1)Embrapa Cerrados, BR-020, Km 18, CEP 73310-970 Planaltina, DF, Brazil. E-mail: carlos.lazarini@embrapa.br,
fernanda.morais@embrapa.br, helenice.goncalves@embrapa.br, fabiana.aquino@embrapa.br, fernando.rocha@embrapa.br
Abstract – The objective of this work was to estimate the repeatability coefficients of mangaba (Hancornia speciosa) fruit traits, in order to define the number of fruit needed for an accurate selection of superior genotypes, as well as to conjecture about the nature of the phenotypic variation of these traits. Evaluations were performed for 160 fruit of 16 genotypes from two native H. speciosa populations of Goiás Velho and Padre Bernardo, in the state of Goiás, Brazil. Repeatability was estimated by the analysis of variance, principal component analyses based on covariance and on the correlation matrix, and structural analysis based on the correlation matrix. Repeatability estimates for fruit weight, diameter, and length, as well as seed number and weight, were of low magnitude, from 0.02 to 0.62, indicating low heritability. Repeatability estimates for ºBrix, titratable acidity, and ºBrix/acidity ratio were higher, from 0.34 to 0.91, indicating a low to potentially moderate heritability. The number of fruit for an effective selection of the best genotypes for titratable acidity, ºBrix, ºBrix/acidity ratio, and fruit weight is four for a 0.85 accuracy level. However, seven fruit would allow 0.90 accuracy for the same traits, and 0.85 accuracy for fruit length and diameter. The number and weight of seed per fruit are not effective for predicting the real value of a genotype.
Index terms: coefficient of determination, mangaba, repeated measures, savannah, selection efficiency.
Repetibilidade de características de frutos de duas populações de
Hancornia speciosa
da região “core” do Cerrado do Brasil
Resumo – O objetivo deste trabalho foi estimar os coeficientes de repetibilidade de características dos frutos de mangaba (Hancornia speciosa), para definir o número de frutos necessários para seleção precisa de genótipos superiores, assim como conjecturar sobre a natureza da variação fenotípica dessas características. Avaliaram-se 160 frutos de 16 genótipos de duas populações nativas de H. speciosa de Goiás Velho e Padre Bernardo, no Estado de Goiás. A repetibilidade foi estimada por análise de variância, análise de componentes principais com base na covariância e na matriz de correlação, e por análise estrutural baseada na matriz de correlação. As estimativas de repetibilidade quanto à massa, ao diâmetro e ao comprimento dos frutos, bem como quanto ao número e à massa de sementes, foram de baixa magnitude, de 0,02 a 0,62, o que indica baixa herdabilidade. As estimativas de repetibilidade quanto a ºBrix, à acidez titulável e à relação ºBrix/acidez foram maiores, de 0,34 a 0,91, o que indica herdabilidade que varia de baixa a potencialmente moderada. O número de frutos para seleção efetiva dos melhores genótipos quanto à acidez titulável, a ºBrix, à relação ºBrix/acidez e à massa de fruto é de quatro para um nível de acurácia de 0,85. No entanto, sete frutas permitiriam acurácia de 0,90, para as mesmas características, e acurácia de 0,85 para comprimento e diâmetro do fruto. O número e a massa de sementes por fruto não são eficazes para prever o valor real de um genótipo.
Termos para indexação: coeficiente de determinação, mangaba, medidas repetidas, Cerrado, eficiência seletiva.
Introduction
Hancornia speciosa Gomes (Apocynaceae), popularly known as “mangabeira”, is a fruit tree native to Brazil, occurring spontaneously in the Southeast,
North, Northeast, and Midwest regions (Silva et al.,
2013). Its fruit are widely consumed in natura, or as industrialized juice, ice cream, paste, and frozen pulp. Despite its importance and widespread use, the production is mostly from gathering. There are several agronomic efforts to bring the species to a cultivated
al., 2012), and technical information related to its fruit characteristics are essential for any selection program aiming at the development of H. speciosa cultivars.
Selection of superior plants of perennial fruit crops is usually done through the analysis of traits in repeated measures of individual genotypes, such as fruit weight and size, seed number and weight, ºBrix, and acidity from a number of fruit. The main question refers to the quantity of fruit that should be evaluated to select the best genotypes with higher-fruit
quality. The repeatability coefficient is defined as the
correlation among repeated measures from the same individual over time and space, as well as its associated
determination coefficient (R2), that measures accuracy
in the prediction of the real value of an individual
genotype (Cruz & Regazzi, 1994).
Repeatability coefficient and determination coefficient are useful tools to address the above
question. The higher the correlation among fruit within a genotype, the lower may be the number of fruit needed to distinguish them in a selection
procedure. If the trait is of difficult assessment or its
heritability is low, a higher number of fruit may be necessary. However, if the number of fruit increases largely, the evaluation process will be longer, and may substantially increase time and costs of selection.
Evaluations of structural traits in a number of fruit from individual genotypes are often examples
of repeatability over space, and are used to define
the minimum number of phenotypic observations
(fruit) needed to select the best genotypes for certain
characteristics. In this case, there is an expectation that
a higher performance of a specific fruit trait will reflect the superiority of the whole genotype (Cruz & Regazzi,
1994). Analyses by the repeatability model have a completely correlated genetic covariance structure, assuming the genetic correlation between any pair of fruit equal to 1, as well as the same phenotypic variance for all fruit, and the same permanent environmental
correlation for all pairs of fruit (Resende, 2007). Several studies estimate repeatability to define the
number of fruit needed to select superior plants with high accuracy. Repeatability estimates ranging from
0.50 to 0.66 for fruit characteristics of peach (Prunus persica L. Batsch) were reported (Albuquerque et al., 2004). These authors concluded that the use of nine fruit lead to the accuracy of 0.90 in the evaluations of phenotypic values for length, diameter, and fruit
weight, pit weight, pulp hardness, and the pulp/pit and
length/diameter ratios. Yellow mombim (Spondias mombin L.) repeatability estimates ranged from 0.45 to 0.83 for fruit characteristics, and the evaluation of 11 fruit were enough to predict the real phenotypic value of fruit weight, fruit diameter, seed weight, acidity, and soluble solids/acidity ratio with an accuracy of
0.90 (Soares et al., 2008). Repeatability estimates for acerola (Malpighia emarginata D.C.) fruit traits such as
height, diameter, weight, vitamin C, and acidity ranged
from 0.81 to 0.94, with 0.90 and higher accuracy from
only two measurements (Lopes et al., 2001). Besides,
eight measurements for total soluble solids and, at least, 26 measurements for pulp/fruit weights ratio, were needed to achieve 0.90 accuracy. Repeatability
estimates for yellow passion fruit (Passiflora edulis Sims) traits ranged from 0.28 to 0.54 with 0.79 and
higher accuracy, according to Neves et al. (2010), who
concluded that ten fruit are enough for 0.80-accuracy selection process for all evaluated fruit traits.
Low-magnitude repeatability coefficients for all
physical fruit traits were reported for H. speciosa from
the savannas of Amapá state, Brazil (Yokomizo & Farias Neto, 1999). The repeatability magnitude was
0.31 for the number of seed, 0.32 for fruit weight, 0.36 for fruit diameter, and 0.42 for fruit length, with most
of the accuracy estimates (R2) lower than 0.80. Those
authors concluded that 12 repeated measures for fruit length, 16 for fruit diameter, and 20 for number of seed and fruit weight would be required to reach 0.90 accuracy. Because repeatability estimates consider the effect of permanent environment, it is important to carry out additional studies, in different locations, to have a broader understanding of the phenotypic and
genetic variation on the definition of the number of
fruit to be evaluated. To our knowledge, no information is available on repeatability estimates of fruit traits for H. speciosa from the core savanna areas of Brazil. Therefore, repeatability studies would help a better understanding of the nature of the phenotypic and
genetic variation of the fruit traits, as well as to define the number of repeated measures (fruit) that is reliable
for an effective individual plant selection.
The objective of this work was to estimate the
repeatability coefficients of H. speciosa fruit traits,
in order to define the number of fruit needed for an
conjecture about the nature of the phenotypic variation of these traits.
Materials and Methods
Two H. speciosa populations native to a core savanna area, in the municipalities of Goiás, at 15.9338°S, 50.1404°W, and Padre Bernardo, at 15.1680°S, 48.2845°W, in the state of Goiás, both in Brazil, were studied. The species is registered in Sistema Nacional
de Gestão do Patrimônio Genético e do Conhecimento
Tradicional Associado, as ABDA66A.
Fruit from 26 and 18 fully-grown trees were
respectively collected from each population, based on their visual vegetative development, fruit production, as well as absence of pests and disease. Eight genotypes from each population and 10 fruit from each genotype were randomly selected for laboratory quality evaluation. One hundred and sixty fruit were then evaluated for fruit diameter, length, weight, number and weight of seed per fruit, titratable total acidity
(percentage of free organic acids), °Brix (percentage
of soluble solids), and for the ratio ºBrix /acidity. The acidity was determined by titration with a 0.1N NaOH
solution (4.0008 g L-1 water), using phenolphthalein
as indicator (0.01 g cc-1 of 96% alcohol) according
to AOAC (1990). The soluble solids content was
determined by a Brix refractometer.
The repeatability coefficients (r) were estimated
by four statistical procedures, as follows: analysis of
variance based on the variance components; principal components based on the covariance matrix; principal components based on the correlation matrix; and
structural analysis based on the correlation matrix
(Cruz, 2013). The coefficient of repeatability based
on the analysis of variance was estimated by using the statistical model with two factors Yij = μ + gi +
aj + eij , in which: Yij is the phenotypic value of the
ith genotype at the jth fruit; μ is the overall mean; g i
is the random effect of the ith genotype under the
influence of the permanent environment; aj is the
fixed effect of the localized environment at the jth
fruit; and eij is the effect of the localized environment
associated with the jth fruit, in the ith genotype.
Repeatability coefficients were estimated by:
r=σ σ +σ
gi 2
e 2
gi 2
in which: r is the repeatability coefficient; σgi2
is the
estimated covariance among fruit in each genotype; and
σe
2 is the estimated random residual variance, given by:
σgi2 = (MSg – MSe)/n and σ
e 2
= MSe
in which: MSg is the mean square associated to
genotypes; MSe is the error mean square from the table of the analysis of variance; and n is the number
of fruit.
Repeatability coefficients were estimated by the
analysis of the principal components based on the correlation matrix, and on the matrix of phenotypic
variances and covariances (Cruz & Regazzi, 1994).
The estimates were obtained by a correlation matrix between the repeated measures and by estimating the normalized eigenvalues and eigenvectors. All estimated eigenvectors that have the elements with the same sign and closer magnitudes are the ones that best express the trend of the genotypes to maintain the relative performance for different repeated measures. The
coefficient was estimated by the following equation:
r=λ1−1 η−1
in which: λ1 is the eigenvalue of the correlation matrix
associated to the eigenvector whose elements have the
same sign and similar magnitude, and η is the number of repeated measures. The repeatability coefficients,
based on the phenotypic variance and covariance matrix, were then obtained by the following equation:
r=λ1−σY2 σY2(η−1)
in which: λ1 is the estimated eigenvalue of the phenotypic variance and covariance matrices, which are associated to the eigenvector whose elements
have the same sign and similar magnitude; σY2
is
the estimated Y trait variance; and η is the number of repeated measures. The repeatability coefficients estimated by the structural analysis (Cruz & Regazzi,
1994) based on the interclass correlation matrix were obtained by the following equation: r=α'Rα−1η−1
in which: α'Rα =λ
1 is the intraclass correlation
eigenvalues associated to the eigenvector whose
elements have the same sign and similar magnitude; α' is the eigenvector associated to λ α α
1, ' =1; and η is the
number of repeated measures. For each repeatability estimate, the determination coefficient R2 (Cruz &
Regazzi, 1994) was estimated by the following equation:
R2 =ηr 1+r(η−1)
minimum number of repeated measures needed to
achieve efficiency in the selection process, for the pre-defined determination coefficients _80, 85, 90, 95, and 99% _ was estimated by the following equation:
η0=R2(1−r) (1−R r2)
All repeatability analyses were developed using Genes, a software package for analysis in experimental statistics and quantitative genetics, in the Biometrics
section (Cruz, 2013, 2016).
Results and Discussion
The repeatability coefficient indicates the ability
of the genotypes to repeat the expression of a
trait over repeated measures, and the coefficient of determination (R2) indicates the accuracy in
predicting the real value of an individual genotype
(Table 1). Repeatability indicates how much is to be
gained by repeated measures, as well as to set the upper limit to the broad-sense heritability, and predict
the future performance from past records (Falconer, 1981). Repeatability coefficients for fruit traits were
of low to moderate magnitude and very similar and consistent over individual populations, as well as for both populations together. The repeatability estimates for fruit weight ranged from 0.29 to 0.45, in Padre Bernardo population, and from 0.51 to 0.61 in the municipality of Goiás population, by the analysis of variance, and by the principal component correlation methods, respectively. The analysis of variance consistently came up with the lowest estimates, while the principal component covariance, with the highest
ones, similarly to other reports (Martuscello et al., 2007; Lédo et al., 2008; Braz et al., 2015; Fernandes
et al., 2017).
The principal component methods estimate the
coefficient of repeatability more efficiently when
the genotypes show a cyclic behavior in relation to the trait because they are based on the covariance matrix between genotypes obtained in each pair of
measurements (Abeywardena 1972). In addition, this
author states that the principal component methods
offer a more efficient criterion of selection, as the
elements of the latent vector help to obtain a weighted average which is superior to the arithmetic mean, which can be biased by abnormal conditions that may occur during the period of the observations. Besides, the different estimates of the repeatability among methods
may reflect a range in which the actual value of the parameter is most likely to be found (Martuscello et
al., 2007).
Fruit diameter had low-magnitude estimates with
a greater variation, ranging from 0.18 to 0.62 over
all four methods and populations. Likewise, fruit
length had low-repeatability estimates, ranging from 0.32 to 0.58, consistently over both populations and combined populations. The repeatability estimates of low magnitude for fruit weight, diameter, and length of H. speciosa suggests a multigene genetic control,
largely influenced by environmental conditions, which
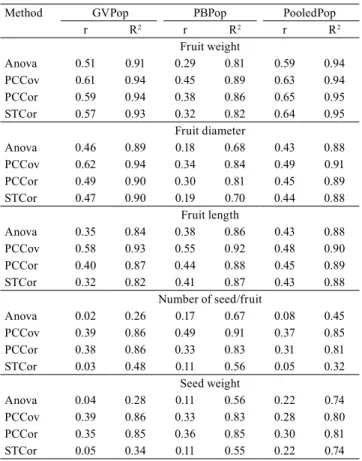
Table 1. Estimates of repeatability coefficient (r) and
coefficient of determination (R2) of Hancornia speciosa for
fruit weight, diameter, length, number of seed per fruit, and seed weight, from individual and pooled population data by the analysis of variance (Anova), principal component covariance (PCCov), principal component correlation (PCCor), and structural analysis (STCor) of two populations, from the core region of the Brazilian Cerrado.
Method GVPop PBPop PooledPop r R2 r R2 r R2
Fruit weight
Anova 0.51 0.91 0.29 0.81 0.59 0.94
PCCov 0.61 0.94 0.45 0.89 0.63 0.94
PCCor 0.59 0.94 0.38 0.86 0.65 0.95
STCor 0.57 0.93 0.32 0.82 0.64 0.95
Fruit diameter
Anova 0.46 0.89 0.18 0.68 0.43 0.88
PCCov 0.62 0.94 0.34 0.84 0.49 0.91
PCCor 0.49 0.90 0.30 0.81 0.45 0.89
STCor 0.47 0.90 0.19 0.70 0.44 0.88
Fruit length
Anova 0.35 0.84 0.38 0.86 0.43 0.88
PCCov 0.58 0.93 0.55 0.92 0.48 0.90
PCCor 0.40 0.87 0.44 0.88 0.45 0.89
STCor 0.32 0.82 0.41 0.87 0.43 0.88 Number of seed/fruit
Anova 0.02 0.26 0.17 0.67 0.08 0.45
PCCov 0.39 0.86 0.49 0.91 0.37 0.85
PCCor 0.38 0.86 0.33 0.83 0.31 0.81
STCor 0.03 0.48 0.11 0.56 0.05 0.32 Seed weight
Anova 0.04 0.28 0.11 0.56 0.22 0.74
PCCov 0.39 0.86 0.33 0.83 0.28 0.80
PCCor 0.35 0.85 0.36 0.85 0.30 0.81
STCor 0.05 0.34 0.11 0.55 0.22 0.74
may lead to low gains in phenotypic selection due to low heritability.
Repeatability estimates for seed number and weight were the lowest ones and the most variable in both populations, ranging from 0.02 to 0.49, for the number of seed per fruit, and from 0.04 to 0.39, for
seed weight per fruit, reflecting a high dependence on
the environmental conditions. The low magnitude of
the repeatability coefficient indicates that there was
no regularity on repeating the characteristic from one
fruit to another. These low-repeatability coefficients may reflect closely the real low-heritability values of
both seed characteristics. The environmental effect on them may be linked to the availability of pollinating insects. Any factor affecting the natural dynamics of these insects may strongly affect the number and weight of seed per fruit, as well. H. speciosa pollination. A study on fruit production of the savannas of the National Reserve of Guaribas, in Paraíba State,
northeastern Brazil, confirmed that flowers of H. speciosa attract nocturnal and diurnal flower visitors
of various species, mainly Lepidoptera ones (Darrault & Schlindwein, 2005). They reported a low-seed
setting, ranging from 1 to 25 per fruit, for 76 ovules on average. They concluded that fruit set may vary with oscillations of pollinator richness and abundance, and that the development of small fruit with only one or few seed emphasizes the pollinator limitation in H. speciosa at that study site.
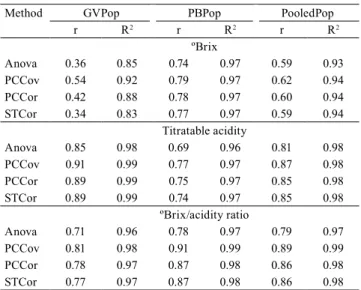
The highest estimates of repeatability coefficient
were of moderate to high magnitude for titratable acidity and ºBrix/acidity ratio,and ranged from 0.71 to 0.91 for the population of the municipality of Goiás, and from 0.69 to 0.91 for Padre Bernardo population
(Table 2). The estimates of repeatability coefficient
were lower, but still moderate in magnitude for ºBrix in the Padre Bernardo population, and ranged from 0.74 to 0.79. The lowest estimates occurred for ºBrix in the municipality of Goiás population, which ranged from 0.34 to 0.54. The higher-magnitude repeatability estimates may indicate a moderate heritability for the above fruit traits and potential gains through phenotypic selection. In addition, those higher repeatability estimates were associated with the highest R2, reflecting a good accuracy of the prediction
values of an individual genotype by the analysis of ten fruit.
Accuracy (R2) values were moderate to high in
magnitude over methods and populations for all fruit traits, but number of seeds per fruit and seed weight
(Tables 1 and 2). The R2 ranged from 0.81 to 0.95 for
fruit weight, 0.82 to 0.93 for fruit length, and 0.68 to 0.94 for fruit diameter, 0.83 to 0.97 for ºBrix, 0.97 to 0.99 for titratable acidity, and 0.96 to 0.99 for ºBrix/
acidity, suggesting the high efficiency of ten fruit,
when selecting the best H. speciosa genotypes for those traits. The accuracy level was highly variable over the methods and ranged from 0.26 to 0.91 for number of seed per fruit, and from 0.28 to 0.86 for seed weight per fruit, strengthening the need of more repeated measures to predict the real value of a genotype for those latter traits.
Since the repeatability estimates and their associated accuracy were highly consistent over populations
(Tables 1 and 2), the number of fruit for an efficient
selection was estimated by combining the data from
both populations (Table 3). The estimated number of
fruit needed to select the best genotypes, by the four methods for titratable acidity and ºBrix/acidity ratios,
Table 2. Estimates of repeatability coefficient (r) and
coefficient of determination (R2) of Hancornia speciosa
fruit chemical traits, from each and pooled population data, by the analysis of variance (Anova), principal component covariance (PCCov), principal component correlation (PCCor), and structural analysis (STCor) of two populations, from the core region of the Brazilian Cerrado.
Method GVPop PBPop PooledPop r R2 r R2 r R2
ºBrix
Anova 0.36 0.85 0.74 0.97 0.59 0.93
PCCov 0.54 0.92 0.79 0.97 0.62 0.94
PCCor 0.42 0.88 0.78 0.97 0.60 0.94
STCor 0.34 0.83 0.77 0.97 0.59 0.94 Titratable acidity
Anova 0.85 0.98 0.69 0.96 0.81 0.98
PCCov 0.91 0.99 0.77 0.97 0.87 0.98
PCCor 0.89 0.99 0.75 0.97 0.85 0.98
STCor 0.89 0.99 0.74 0.97 0.85 0.98 ºBrix/acidity ratio
Anova 0.71 0.96 0.78 0.97 0.79 0.97
PCCov 0.81 0.98 0.91 0.99 0.89 0.99
PCCor 0.78 0.97 0.87 0.98 0.86 0.98
STCor 0.77 0.97 0.87 0.98 0.86 0.98
ranged from 2 to 3 at 0.85 accuracy level, and from
three to five at 0.90 accuracy level. The estimated
number of fruit for fruit weight and ºBrix was four,
at 0.85 accuracy level, and ranged from five to seven, at 0.90 accuracy level. For fruit diameter and length,
the number of fruit ranged from six to eight, for 0.85 accuracy, and from 10 to 12, for 0.90 accuracy. Thus, seven fruit would allow selecting genotypes with 0.90 accuracy for titratable acidity, ºBrix, ºBrix/acidity ratio, and fruit weight, as well as 0.85 accuracy for fruit length and diameter.
The estimated number of fruit when selecting for seed number and weight were high and highly variable
over the four methods (Table 3). The number of fruit
ranged from 10 to 119, for 0.85 accuracy, and from 16 to 189 for 0.90 accuracy, for the number of seed per fruit, and from 15 to 20, for 0.85 accuracy, and 21 to 33 for seed weight per fruit. The estimates were higher for the analysis of variance and the structural correlation,
when compared with the other principal component methods. The principal component analyses resulted in lower, closer, and more consistent estimates. A conservative approach can be the use of the average over all four methods to generate an estimate of the number of repeated measures. Estimates of the number of fruit combined over methods, for each trait, would fall between 53 to 84 fruit for seed number, and between 17 to 27 fruit for seed weight, for 0.85 and
0.90 accuracy, respectively. For these specific traits, it is very difficult to increase precision on predicting the
real value of a genotype, since a high number of fruit would be infeasible as to the evaluation work. These
results line up with those by Darrault & Schlindwein (2005), Silva et al. (2012), Gonçalves et al. (2013), and Vieira et al. (2017), in which a large variation of seed
number and mass were reported for the H. speciosa populations from the northeastern and central regions of Brazil.
Conclusions
1. The repeatability coefficient estimates for
Hancornia speciosa are of low magnitude for fruit weight, diameter, length, and for the number and
weight of seed; therefore, a low gain in phenotypic
selection is expected for these traits.
2. The repeatability coefficients are of moderate
to high magnitude for ºBrix, titratable acidity, and ºBrix/acidity ratio,indicating a potentially moderate heritability and moderate expected gains through phenotypic selection.
3. The mean number of fruit sufficient for a reliable
selection of the best genotypes for titratable acidity, ºBrix, ºBrix/acidity ratio, and fruit weight, is four fruit, with 0.85 accuracy. However, seven fruit would allow 0.90 accuracy for the same traits, as well as 0.85 accuracy for fruit length and diameter.
4. Seed number and weight per fruit may not be
efficient for predicting the real value of a genotype.
References
ABEYWARDENA, V. An application of principal component analysis in genetics. Journal of Genetics, v.61, p.27-51, 1972. DOI: 10.1007/BF02984099.
ALBUQUERQUE, A.S.; BRUCKNER, C.H.; CRUZ, C.D.; SALOMÃO, L.C.C.; NEVES, J.C.L. Repeatability and correlations among peach physical traits. Crop Breeding and Applied
Table 3. Number of repeated measures of Hancornia
speciosa fruit traits estimated by four methods of repeatability coefficient, and four levels of accuracy (R2),
for the combined data from both Goiás City and Padre Bernardo populations (Goiás State, core region of the Brazilian Cerrado).
R2 Anova(1)PCCov PCCor STCor Anova PCCov PCCor STCor
Fruit weight Fruit diameter
0.80 2.7 2.4 2.2 2.3 5.4 4.1 4.8 5.2 0.85 3.9 3.4 3.1 3.2 7.6 5.8 6.8 7.3 0.90 6.2 5.3 4.9 5.1 12.1 9.2 10.9 11.6 0.95 13.0 11.3 10.4 10.8 25.5 19.4 23.0 24.5
Fruit length Number of seed per fruit 0.80 5.3 4.4 4.9 5.2 48.3 6.8 9.1 83.7 0.85 7.6 6.2 7.0 7.4 68.4 9.7 12.9 118.6 0.90 12.0 9.8 11.1 11.8 108.6 15.4 20.4 188.4 0.95 25.4 20.8 23.4 24.8 229.2 32.6 43.1 397.7
Seed weight ºBrix
0.80 14.3 10.1 9.4 14.1 2.8 2.7 2.7 2.8 0.85 20.3 14.3 13.2 20.0 4.0 3.4 3.8 3.9 0.90 32.3 22.7 21.0 31.8 6.4 5.5 6.1 6.2 0.95 68.2 47.9 44.4 67.0 13.4 11.5 12.8 13.1
Titratable acidity ºBrix/acidity ratio 0.85 1.3 0.9 1.0 1.0 1.5 0.7 0.9 0.9 0.90 2.1 1.4 1.5 1.5 2.4 1.1 1.4 1.4 0.95 4.4 2.9 3.3 3.3 5.1 2.3 3.0 3.0 0.99 22.7 15.2 17.0 17.0 26.6 11.8 15.71 16.0
(1)Methods of estimation: Anova, analysis of variance; PCCov, principal
component covariance; PCCor, principal component correlation; STCor,
Biotechnology, v.4, p.441-445, 2004. DOI: 10.12702/1984-7033. v04n04a10.
AOAC. Association of Official Agricultural Chemists. Official methods of analysis of the Association of Official Agricultural
Chemists. 11th ed. Washington: AOAC, 1990. 1141p.
BRAZ, T.G. dos S.; FONSECA, D.M. da; JANK, L.; CRUZ, C.D.; MARTUSCELLO, J.A. Genotypic stabilization of agronomic traits in Panicum maximum (Jacq.) hybrids. Revista Brasileira
de Zootecnia, v.44, p.377-383, 2015. DOI:
10.1590/S1806-92902015001100001.
CRUZ, C.D. Genes Software: extended and integrated with the R, Matlab and Selegen. Acta Scientiarum. Agronomy, v.38, p.547-552, 2016. DOI: 10.4025/actasciagron.v38i4.32629.
CRUZ, C.D. Genes: a software package for analysis in experimental statistics and quantitative genetics. Acta
Scientiarum. Agronomy, v.35, p.271-276, 2013. DOI: 10.4025/
actasciagron.v35i3.21251.
CRUZ, C.D.; REGAZZI, A.J. Modelos biométricos aplicados ao
melhoramento genético. Viçosa: Ed. da UFV, 1994. 390p.
DARRAULT, R.O.; SCHLINDWEIN, C. Limited fruit production
in Hancornia speciosa (Apocynaceae) and pollination by
nocturnal and diurnal insects. Biotropica, v.37, p.381-388, 2005. DOI: 10.1111/j.1744-7429.2005.00050.x.
FALCONER, D. S. Introduction to quantitative genetics. 2nd ed.
New York: Longman, 1981. 340p.
FERNANDES, F.D.; BRAGA, G.J.; RAMOS, A.K.B.; JANK, L.; CARVALHO, M.A.; MACIEL, G.A.; KARIA, C.T.; FONSECA, C.E.L. da. Repeatability, number of harvests, and phenotypic stability of dry matter yield and quality traits of Panicum maximum jacq. Acta Scientiarum. Animal Sciences, v.39, p.149-155, 2017. DOI: 10.4025/actascianimsci.v39i2.32915.
FREITAS, M.K.C. de; COIMBRA, R.R.; AGUIAR, G.B.; AGUIAR, C.B.N.; CHAGAS, D.B. das; FERREIRA, W. de M.; OLIVEIRA, R.J. de. Variabilidade fenotípica e caracterização morfológica de uma população natural de Hancornia speciosa
Gomes. Bioscience Journal, v.28, p.833-841, 2012.
GONÇALVES, L.G.V.; ANDRADE, F.R.; MARIMON JUNIOR, B.H.; SCHOSSLER, T.R.; LENZA, E.; MARIMON, B.S. Biometria de frutos e sementes de mangaba (Hancornia speciosa
Gomes) em vegetação natural na região leste de Mato Grosso, Brasil. Revista de Ciências Agrárias, v.36, p.31-40, 2013. LÉDO, F.J. da S.; PEREIRA, A.V.; SOUZA SOBRINHO, F. de; AUAD, A.M.; JANK, L.; OLIVEIRA, J.S. e. Estimativas de repetibilidade para caracteres forrageiros em Panicum maximum.
Ciência e Agrotecnologia, v.32, p.1299-1303, 2008. DOI: 10.1590/
S1413-70542008000400040.
LOPES, R.; BRUCKNER, C.H.; CRUZ, C.D.; LOPES, M.T.G.; FREITAS, G.B. de. Repetibilidade de características do fruto de aceroleira. Pesquisa Agropecuária Brasileira, v.36, p.507-513, 2001. DOI: 10.1590/S0100-204X2001000300015.
MARTUSCELLO, J.A.; JANK, L.; FONSECA, D.M. da; CRUZ, C.D.; CUNHA, D. de N.F.V. da. Repetibilidade de caracteres agronômicos em Panicum maximum Jacq. Revista Brasileira de
Zootecnia, v.36, p.1975-1981, 2007. Suplemento. DOI: 10.1590/
S1516-35982007000900005.
NEVES, L.G.; BRUCKNER, C.H.; CRUZ, C.D.; BARELLI, M.A.A. Avaliação da repetibilidade no melhoramento de famílias de maracujazeiro. Revista Ceres, v.57, p.480-485, 2010. DOI: 10.1590/S0034-737X2010000400007.
RESENDE, M.D.V. de. Matemática e estatística na análise de
experimentos e no melhoramento genético. Colombo: Embrapa
Florestas, 2007. 561p.
SILVA, A.V.C. da; RABBANI, A.R.C.; SENA-FILHO, J.G. de; ALMEIDA, C.S.; FEITOSA, R.B. Genetic diversity analysis of mangaba (Hancornia speciosa Gomes), an exotic brazilian tropical species. Tropical and Subtropical Agroecosystems, v.15, p.217-225, 2012.
SILVA, S.A.; CRUZ, E.M. de O.; REIS, R.V. dos; FERREIRA, C.F.; PASSOS, A.R. Caracterização morfológica e molecular de genótipos de mangaba. Revista Brasileira de Fruticultura, v.35, p.1093-1100, 2013. DOI: 10.1590/S0100-29452013000400021. SOARES, E.B.; GOMES, R.L.F.; CAMPELO, J.E.G.; LOPES, Â.C. de A.; MATOS FILHO, C.H.A. Repetibilidade e correlações entre caracteres morfo-agronômicos de cajazeira. Ciência e
Agrotecnologia, v.32, p.1851-1857, 2008. DOI:
10.1590/S1413-70542008000600025.
SOUZA, E. R. B; VIEIRA, M. C.; NAVES, R. V.; MOZENA, W. L.; SILVA, G. D. Dados de massa de frutos e sementes de mangabeira (Hancornia speciosa Gomes) do Cerrado do Estado de Goiás. In:
CONGRESSO BRASILEIRO DE FRUTICULTURA, 22., 2012, Bento Gonçalves. Anais. Bento Gonçalves: SBF, 2012. 1 CD-ROM.
VIEIRA, M.C.; NAVES, R.V.; SOUZA, E.R.B.; PAULA, M.S.P.; LEANDRO, W.M.; MOURA, N.F. Biometria de frutos de
Hancornia speciosa (Gomes) de ocorrência natural no Cerrado do
Estado de Goiás. Scientific Electronic Archives, v.10, p.6-12, 2017. YOKOMIZO, G.K.-I.; FARIAS NETO, J.T. de. Coeficientes de repetibilidade e de correlação para caracteres dos frutos de mangabeiras. Genetics and Molecular Biology, v.22, p.696-697, 1999. Suplemento.