Universidade de Lisboa
Faculdade de Ciências
Departamento de Biologia Animal
COUPLING METABOLIC FOOTPRINTING AND FLUX
BALANCE ANALYSIS TO PREDICT HOW SINGLE GENE
KNOCKOUTS PERTURB MICROBIAL METABOLISM
Gonçalo dos Santos Correia
Mestrado em Bioinformática e Biologia Computacional
Ramo Biologia Computacional
1
Universidade de Lisboa
Faculdade de Ciências
Departamento de Biologia Animal
COUPLING METABOLIC FOOTPRINTING AND FLUX
BALANCE ANALYSIS TO PREDICT HOW SINGLE GENE
KNOCKOUTS PERTURB MICROBIAL METABOLISM
Gonçalo dos Santos Correia External Supervisor: Dr. David Weinkove Internal Supervisor: Dr. Octávio S. Paulo
Mestrado em Bioinformática e Biologia Computacional
Ramo Biologia Computacional
2
ABSTRACT
The model organisms Caenorhabditis elegans and E. coli form one of the simplest gut microbe host interaction models. Interventions in the microbe that increase the host longevity including inhibition of folate synthesis have been reported previously. To find novel single gene knockouts with an effect on lifespan, a screen of the Keio collection of E. coli was undertaken, and some of the genes found are directly involved in metabolism. The next step in those specific cases is to understand how these mutations perturb metabolism systematically, so that hypotheses can be generated. For that, I employed dynamic Flux Balance Analysis (dFBA), a constraint-based modeling technique capable of simulating the dynamics of metabolism in a batch culture and making predictions about changes in intracellular flux distribution. Since the specificities of the C. elegans lifespan experiments demand us to culture microbes in conditions differing from most of the published literature on E. coli physiology, novel data must be acquired to characterize and make dFBA simulations as realistic as possible. To do this exchange fluxes were measured using quantitative H NMR Time-Resolved Metabolic Footprinting. Furthermore, I also investigate the combination of TReF and dFBA as a tool in microbial metabolism studies.
These approaches were tested by comparing wild type E. coli with one of the knockout strains found, ΔmetL, a knockout of the metL gene which encodes a byfunctional enzyme involved in aspartate and threonine metabolism. I found that the strain exhibits a slower growth rate than the wild type. Model simulation results revealed that reduced homoserine and methionine synthesis, as well as impaired sulfur and folate metabolism are the main effects of this knockout and the reasons for the growth deficiency. These results indicate that there are common mechanisms of the lifespan extension between ΔmetL and inhibition of folate biosynthesis and that the flux balance analysis/metabolic footprinting approach can help us understand the nature of these mechanisms.
KEYWORDS: Gut Microbes; Ageing; C. elegans; E. coli; Metabolic Footprinting; Flux Balance Analysis
3
RESUMO
Os organismos modelo Caenorhabditis elegans e E. coli formam um dos modelos mais simples de interacções entre micróbio do tracto digestivo e hospedeiro. Intervenções no micróbio capazes de aumentar a longevidade do hospedeiro, incluindo inibição de síntese de folatos, foram reportadas previamente. Para encontrar novas delecções génicas do micróbio capazes de aumentar a longevidade do hospedeiro, a colecção Keio de deleções génicas de E. coli foi rastreada. Alguns dos genes encontrados participam em processos metabólicos, e nesses casos, o próximpo passo é perceber como as deleções perturbam o metabolismo sistémicamente, para gerar hipóteses. Para isso, utilizo dynamic Flux Balance Analysis (dFBA), uma técnica de modelação metabólica capaz de fazer previsões sobre alterações na distribuição intracelular de fluxos. As especificidades das experiências de tempo de vida em C.elegans obrigam-nos a trabalhar em condições diferentes das usadas na maioria da literatura publicada em fisiologia de E. coli, e para dar o máximo realismo às simulações de dFBA novos dados foram adquiridos, utilizando H NMR Time-Resolved Metabolic Footprinting para medir fluxos de troca de metabolitos entre microorganismo e meio de cultura. A combinação de TReF e dFBA como ferramenta de estudo do metabolism microbiano é também investigada.
Estas abordagens foram testadas ao comparar E. coli wild-type com uma das estirpes encontradas no rastreio, ΔmetL, knockout do gene metL, que codifica um enzima bifunctional participante no metabolismo de aspartato e treonina, e que exibe uma taxa de crescimento reduzida comparativamente ao wild-type. Os resultados das simulações revelaram que os principais efeitos da deleção deste gene, e as razões para a menor taxa de crescimento observada, são a produção reduzida de homoserina e metionina e os efeitos que provoca no metabolismo de folatos e enxofre. Estes resultados indicam que há mecanismos comuns na extensão da longevidade causada por esta deleção e inibição de síntese de folatos, e que a combinação metabolic footprinting/flux balance analysis pode ajudar-nos a compreender a natureza desses mecanismos.
Palavras-Chave: Micróbios do tracto digestivo; Envelhecimento; C. elegans; E. coli;
4
ACKNOWLEDGMENTS
The work reported in this dissertation wouldn’t be possible without the help, support, collaboration and research of other people.
I’ll start by expressing my gratitude to Dr. David Weinkove, who supervised me, for his support, advice and mentorship, as well as his contagious curiosity and love of science, and whom I, as an aspiring scientist, consider a great role model, both scientifically and humanely.
Next, I also want to thank Dr. Junli Liu who co-supervised me, for his advice and useful insights and discussions regarding metabolic modeling and the computational aspects of this project. I will always remember the meetings and discussions I had with both my supervisors, usually concerning how finding the right compromises between experiments and modeling could enhance their strengths and minimize the shortcomings, as an example of good practices in multidisciplinary work.
I must thank all other members of Dr. Weinkove’s worm lab, particularly Jie for her help and discussions concerning the microbiological aspects of this work, and Adelaide, Boo, Harry, Jolien and Yen, who also helped me, and whose research influenced this project one way or another. A special mention to everyone involved in the Keio collection screen, whose intensive hard work generated interesting new scientific knowledge and motivated this work. I enjoyed a very nice and friendly working environment in the lab. I’m also thankful to Mwape and Natalie, members of Dr. Paul Chazot’s research team, for that reason and also for help and sharing of resources.
Another special mention goes to Dr. Alan Kenwright, from the Durham University Department of Chemistry, for his willingness to join the project, contributing with the NMR data acquisition which was essential to this work.
From Imperial College London, I would like to thank Dr. Jake Bundy for advice and discussions about the project and for providing training in metabolomic NMR data analysis and quantification on a visit to London, as well as Florian and Manuel, both members of his research team. I’m also grateful to Dr. Jackie Mosely and Dr. Pete Stokes, from the Durham University Department of Chemistry Mass Spectrometry service, for running LC-MS samples of the metabolic footprint. Although this data wasn’t used in the final work, it still generated some interesting data and is definitely something to be improved in the future.
From the Faculty of Sciences of the University of Lisbon, I would like to thank Dr. Octávio Paulo, my supervisor at the “home” institution.
This work was developed at Durham University, in the School of Biological and Biomedical Sciences. I’m also indebted to this department for receiving me, the Erasmus Programme for allowing this experience and funding part of my stay in Durham, and especially, the Durham University Biophysical Sciences Institute who provided funding for this project.
I cannot finish without thanking my parents, for their support, encouragement and sacrifice, which enabled me to freely pursue my goals and dreams.
5
TABLE OF CONTENTS
I – INTRODUCTION ... 6
II – METHODS ... 9
III – RESULTS AND DISCUSSION ... 13
IV – CONCLUSIONS ... 25
ABREVIATIONS………..27
6
I – INTRODUCTION
Although outnumbering our own cells ten to one1, commensal microbes, including the gut microbes (the umbrella term for all the microbial species settled on the animal gastrointestinal tract), and their role in health and disease were for a long time literally forgotten2.
However, a greater and sometimes completely unexpected role of gut microbes in diverse pathologies and phenotypes has been suggested by recent research findings. Without being extensive, atherosclerosis3, obesity4,5, metabolic syndrome6, drug metabolism7, autism8,9, depression10, cancer11,12 or autoimmune diseases13,14 are a few good examples. Our gut microbes change with age15,18, and the idea of enterotypes, a gut microbe equivalent of blood groups has even been raised16. The Human Microbiome Project17 aims to increase the knowledge of our own microbiome with the help of recent genomic techniques. The increasing body of evidence clearly suggests that we need to extend our definition of organism, including also the gut and other commensal microbes, if we are to discover and understand the causes of some diseases and phenotypes18.
New and very promising therapeutic or even longevity enhancing approaches involving modulating or direct targeting of the gut microbes are already being envisioned19,20. But most of these findings are still lacking precise mechanistic explanations. To uncover those mechanisms, simpler and more tractable models are required. A number of models have been suggested21.
The nematode C. elegans, an established model in the development and ageing fields is also “accidentally” a gut microbe – animal host interaction model: its standard culture protocol22 uses live bacteria, the E. coli strain OP50, as a food source. Although it is possible to culture this model organism in axenic medium, development is retarded and fecundity is reduced23. Garigan and coworkers24 were among the first to investigate the role of E. coli in worm ageing and mortality. The worm lifespan is extremely susceptible to the microbial species and even strain fed25, from the extreme examples of pathogenic bacteria, to microbes like Lactobacillus acidophilus, that exert a positive effect on longevity and even enhance protection against infection by pathogenic microbes26. C. elegans interaction with E.
coli or other microbes is likely to modulate its lifespan through the combined effects on
pathogenesis/immunity, nutrition and behaviour27,28,29. Altered metabolic status in the microbe can also affect the host lifespan in this system. Longevity extension can be caused by altered Q production and metabolism in E. coli30, an effect initially attributed to Q restriction in the
7 worm itself31, or impairment of folate biosynthesis by sulphonamide treatment or bacterial genetic mutations32, for example.
Using this model, and to find novel gut microbe host interaction mechanisms capable of modulating C.elegans lifespan, the Weinkove group screened the Keio collection33 of E.
coli single gene knockouts for mutants that increased lifespan relative to the control Keio
parent strain, finding novel E. coli genes influencing worm lifespan (Jia et al, unpublished). Some of them, like the one we will focus on this work, encode enzymes or directly affect metabolism. It is reasonable to assume that in those cases, the lifespan effect stems from the metabolic alterations. The next logical question is: how does the knockout perturb metabolism? What metabolic functions, reactions and pathways are tampered with and how does the metabolic network reacts, systemically, to the perturbation? Answering this question is not straightforward, and it’s in this type of situations that mathematical models can guide us and help unravel the complexity. There are many metabolic modeling frameworks, each with its own strengths and weaknesses34. In this case, it would be preferable to have a framework capable of predicting how the found gene knockouts could be affecting metabolism at a systemic scale, and if possible, help plan new experiments, either biochemical or genetic. Of all the available modeling techniques, Flux Balance Analysis35, a constraint-based approach, is closest to meeting these requirements36,37, 38.
Flux Balance Analysis requires a stoichiometric matrix S, representing the metabolic network. Those are usually derived from a genomic reconstruction of the organism metabolic network39. Reconstructions of the E. coli K-12 metabolic network are available40,41. By assuming a steady-state (metabolite concentrations remain constant), which is expressed by the equation S.v = 0, the stoichiometric matrix is used to obtain a set of equality constraints, and all the possible flux distributions (v) are in null space of that linear equation system. Additional inequality constraints impose maximal and minimal values on the reactions fluxes. Because this is an under-determined linear equation system, there is no single solution but a solution space, a multidimensional convex polyhedra42, the flux cone. The flux cone is a geometrical and mathematical representation of the metabolic capabilities of the organism in specific environmental conditions. To determine which of the multiple flux distributions that make up the flux cone is closer to reality, we assume that the network will channel its fluxes to better fulfill a given objective. Common biological objectives used in FBA are maximization of biomass yield, ATP and other metabolite productions or minimization of intracellular fluxes43,44,45,46, for example. Mathematical optimization tools, like linear or quadratic programming are deployed to solve the problem and find the optimal flux distribution. Summing up, FBA combines stoichiometric network steady-state analysis with optimization to predict a flux distribution in the whole network.
8 But Flux Balance Analysis returns a single and static steady state solution. How can we use a static technique to model batch culture, a dynamic process where the metabolic network has to constantly adjust to new environmental conditions? Dynamic Flux Balance Analysis (dFBA)47,48,49 is an extension of the technique capable of simulating growth on batch culture. To bypass the static nature of FBA, the time course of the simulation is divided into smaller time intervals, and at each of those a FBA solution is obtained, after changing the constraints to match the updated environmental conditions and using optimization. In a batch culture, the stoichiometric network remains unchanged (equality constraints), while the exchange reaction fluxes change with time (inequality constraints), as the uptake and excretion fluxes change. The underlying assumption is that intracellular metabolic reprogramming and adjustment to the environmental conditions occurs instantly, and the whole metabolic trajectory can be well approximated by a series of sequential snapshots.
The C. elegans protocol has some particular characteristics differentiating it from most of the standard research on E. coli physiology: incubation at 25ºC, with growth on a mixture of oligopeptides as both carbon and nitrogen source, and novel information to constraint FBA must be gathered. Experimentally, this can be done with metabolic footprinting50,51. Metabolic footprinting consists of measuring not the intracellular metabolome but the culture media and profile the “exometabolome”. The information obtained from this approach can be further enhanced by analyzing the changes in the metabolic footprint across time, or Time-Resolved Metabolic Footprinting (TReF)52, and if a quantitative technique is used, exchange fluxes can be measured. This is precisely what we need for dFBA.
The objective of this work is thus to integrate a TreF experimental protocol with Flux Balance Analysis, and generated dynamic time-dependent intracellular flux predictions, (a similar approach was applied with Metabolic Flux Analysis53) that can be used to investigate some of the lifespan increasing strains found in the genetic screen.
The approach is deployed to study the metabolic changes in one of the strains found in the screen, ΔmetL, a knockout of the metL gene. The MetL protein contains two catalytic subunits, homoserine dehydrogenase (EC 1.1.1.3), and aspartate kinase (EC 2.7.2.4), involved in amino acid metabolism, particularly, aspartate, lysine and threonine. TReF data, acquired with HNMR spectroscopy is used to obtain flux measurements and spot differences in the ΔmetL metabolic footprint relative to its wild-type, the Keio parent strain. This information will be used by dFBA which helps in “decoding” the message relayed by the metabolic footprint, and hopefully, learn something and generate hypotheses about what is special about ΔmetL metabolism that increases C. elegans lifespan.
9
II – METHODS
E. coli Strains
The two strains used are part of the Keio E. coli K-12 single gene knockout collection33. The wild-type is the Keio background K-12 BW25113, with addition of a PGreen0229 plasmid carrying the same kanamycin resistance gene present on all the collection knockouts. The ΔmetL strain is the Keio collection knockout of this gene.
Metabolic Footprinting of Microbial C ultures
The liquid culture medium was adapted from the traditional Nematode Growth Medium22, by replacing the common polypeptide mixture (either peptone or tryptone) with Difco™ Casamino Acids, Vitamin Assay, a mixture containing mostly free amino acids. The recipe for our Casamino Acid Liquid Medium (CALM) is as follows: for 900 mL, mix 2.7g NaCl and 2.25 g of Casamino Acids, Vitamin assay in distilled water. Autoclave and add afterwards 22.5mL 1M KHPO4, 0.9 mL 1M MgSO4 and 0.9 1M CaCl2, also sterile.
The bacterial strains were inoculated onto 15mL tubes containing 10 mL of CALM and left to grow overnight at 37ºC, in anaerobic conditions with gentle shaking. All replicate flasks were inoculated from the same respective starter culture, after these cultures were diluted as appropriate to ensure similar initial biomass amounts in all flasks. There were 3 replicates cultures for both the wild-type and the ΔmetL strain.
For each replicate, 50 mL of culture media was added to a 250 mL erlenmeyer flask, and after being inoculated with 250 µL of the initial 10mL culture in CALM, covered with a cotton plug and incubated at 25ºC, while shaking at 250 rpm. Cultures were sampled at 3, 5, 7 and 9 hours and after 9 hours with a 1 hour interval until they reached stationary phase. At each time point, 1 mL of culture was removed from the flask, used to measure the OD600 and afterwards centrifuged for 5 minutes at 16.3 x g, pelleting the bacterial cells. 750 µL of supernatant was pipetted to a new 1 mL microcentrifuge tube and 250 µL of NMR buffer was added, ensuring a D2O percentage of 25% in the final NMR sample.
The NMR buffer contained 5mM of sodium 3-trimethylsilyl-2,2,3,3-2H4-propionate (TSP), used as chemical shift reference and internal standard for quantification. It was made in D2O and buffered to pH 7.0 with phosphate buffer (made with monobasic KPO4 and dibasic NaPO4). TSP and D2O were obtained from Cambridge Isotope Laboratories, Inc.
10 Microbial growth was recorded using a spectrophotometer to measure the optical density at 600 nm. OD600 absorbance values were converted to g of dry cell weight per liter (gDCW/l) using the linear conversion factor of 1 OD600 = 0.431 gDCW/l, obtained in the literature54.
NMR Spectra Acquisition and Processing
1D H1 NMR spectra were acquired on a Varian VNMRS-600 (Varian, Inc.) operating at 599.8 MHz, using a 5mm inverse triple resonance (HFX) probe. The pulse sequence consisted of a 90º degree pulse, with a 3.9 second acquisition time and 2.0 second recycle delay. The water signal was reduced using simple presaturation during the recycle delay with the frequency of the presaturation irradiation being optimised prior to acquiring the spectrum of each sample. For each sample, 32 transients were acquired. Zero filling by more than the number of acquired data points and 1 Hz line broadening were applied prior to Fourier transformation.
MestreReNova (Mnova version 7.1.2) was used for visual inspection of the spectra and figure plotting. Spectra were preprocessed individually with the Chenomx Processor (Chenomx NMR suite 7.5, Chenomx, Inc., Edmonton, Alberta, Canada). Both the automatic phase correction from Vnmr (Varian, Inc.), the software used during spectral acquisition, and automatic baseline correction from Chenomx Processor gave satisfactory results, without the need for manual adjustment in all but a small number of spectra. Shimming correction was applied in all of them. Metabolites were assigned and quantified with the Chenomx NMR suite Profiler.
Statistical Analysis and Curve Fitting of the NMR Data
To detect if the concentration changes in the measurements across time showed a significant underlying trend or could just be caused by random noise, each individual time series was subjected to a Ljung-Box55 test with a lag value of 1, generating 3 p-values per metabolite in a condition (wild-type and ΔmetL mutant). Holm’s method56 for multiple testing correction was used to adjust these p-values. Further analysis was only done when the null hypothesis was rejected, the only exceptions being serine, where the small number of points with a value different than 0 made the Ljung-Box test unusable, and methionine in the mutant strain, with just one outlier replicate being discarded. R57 functions Box.test and p.adjust
11 were used for the Ljung-Box test and Holm’s correction. No significant trend was detected in the phenylalanine and tyrosine time series, and they were discarded.
All curve fitting was done with MATLAB Curve Fitting Toolbox™ (MATLAB version 7.10.0.499 R2010a Natick, Massachusetts: The MathWorks Inc., February 5, 2010), using the averages from the pooled replicates. The growth and metabolite concentration curves were obtained with smoothing splines. The smoothing parameter was chosen manually. Points in the early or late phase of the experiment where the concentration was stationary (the zero points after depleting a substrate, for example) were excluded to improve the fit of the smoothing splines in the regions where concentration was non-stationary.
Flux Balance Analysis Simulations
All the described simulations relied on methods provided in the COBRA Toolbox 2.058 for MATLABTM, with Gurobi (Gurobi Optimizer Version 5.0. Houston, Texas: Gurobi Optimization, Inc.) as the QP or LP solver. libSBML59,60 was required for SBML model import. The stoichiometric matrix used comes from the genome-scale E. coli K-12 MG1655 metabolic network reconstruction iAF126040. Both the reconstruction and the pathway maps used to superimpose the flux values were downloaded from the BiGG database61. The METabcpp and OROT2pp lower flux bounds were set at -1000 mmol/gDCWh, to allow methionine and orotate excretion.
In all simulations, exchange fluxes for metals and trace elements are assumed to be present in non-limiting conditions and left unconstrained. Oxygen was constrained to the literature value of -15 mmol/gDWCh47. Metabolites with exchange reactions in the model and not detected by NMR were only allowed excretion. In the wild-type dFBA simulations, at each time point the biomass reaction value is constrained to the specific growth rate observed and the solution with the minimal Euclidean distance to the measured extracellular fluxes and minimal intracellular fluxes is chosen by QP. This QP problem can be described in the following manner, where Q is a square, positive semidefinite diagonal matrix, with 2 as the diagonal value, M is vector of the same size as v, with the measured fluxes values in the index of the corresponding exchange reaction and 0 otherwise, and v are the variables to be optimized (fluxes).
( )
12 To obtain the ΔmetL flux distribution, MoMA62 was used. Wild-type flux distributions were initially obtained in the manner described. Flux through the biomass reaction on the mutant was constrained between the wild-type and ΔmetL specific growth rate values. Exchange reactions were adjusted only qualitatively to allow them to match the observed patterns, and their actual flux values were found by MoMA just like intracellular fluxes. During MoMA, to simulate the knockout, the ASPK and HSDy fluxes were minimized instead of minimizing their Euclidean distance to the wild-type flux values.
For the flux variability analysis of the GLYCL, METS, DHPS2, GHMT2r and biomass reactions displayed in table 1, the lower bound on alanine, arginine, aspartate, glutamate, glycine, serine, proline and threonine exchange reactions was set at the arbitrary value of -5 mmol/gDCWh. The maximum and minimum fluxes were obtained by maximizing and minimizing the flux in the respective reaction, using MILP (ll-Cobra63 implementation, to ensure solutions have no thermodynamically unfeasible loops) and with the HSDy reaction constrained between -0.05 and 0.05, to mimic the ΔmetL knockout, and unconstrained for the normal situation. This simulation was repeated after adding a thf sink reaction to the model.
Flux values were superimposed on the pathway maps using the Cobra Toolbox drawCbMap function.
13
III – RESULTS AND DISCUSSION
Growth Curves and Metabolite Time-Series
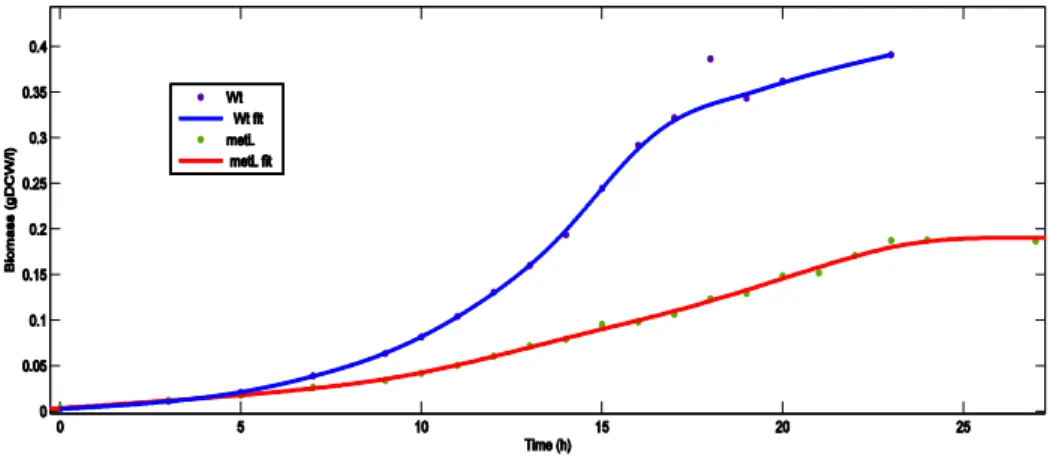
In order to capture fluxes in and out of the microbe over a time course, a longitudinal design was used for the experiments. Samples from each culture flask were taken across time. Measurements of optical density and metabolites using 1H NMR allowed the generation of biomass and metabolite time-series. Conceptually each measurement is an observation of a smooth time-dependent concentration function plus Gaussian noise ( ) ( ) . To calculate accurate fluxes, the observed time-series has to be smoothened to reveal the underlying function. This data was acquired on liquid culture at 25ºC, and with a mixture of free amino acids, casamino acid, as the nutrient source. Liquid culture and free amino acids had to be used instead of solid culture and peptones, as in the C. elegans lifespan experiments, to ensure better quality of the metabolite quantification and measurement of substrate uptake.
Figure 1 – Growth curves for the wild-type and ΔmetL strain, with the respective smoothing spline fits.
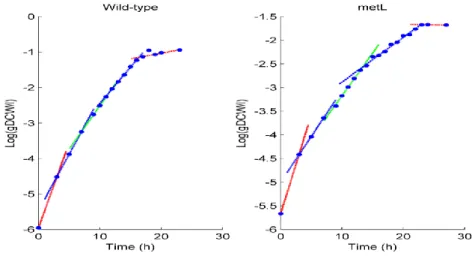
To obtain growth curves, smoothing splines64 were fitted to the biomass values obtained by converting the OD600 to gDCW/l. Sigmoids or other parametric curves are a common choice in modeling microbial growth65, since they are able to represent the stereotypical three phases (lag, exponential and stationary) picture. However, a plot of the natural logarithm of the growth data shows a more complex scenario (Figure 2). There are four different exponential growth phases with quick transitions between them, without noticeable growth lags, suggesting fast adaptation to new conditions. The ΔmetL mutant displays a similar trend, with smaller specific growth rates (the slopes of the local linear
14 regressions in the log plot). Smoothing splines can readily capture these finer details in the data, in contrast with more traditional parametric models.
Figure 2 – Log plot of the growth values, with linear regression lines over imposed
The evolution of the specific growth rate resembles a step function. The specific growth rates calculated from the fitted smoothing splines also display this trend.
Figure 3 – Specifc growth values obtained from the logplot linear regressions (A) and the fitted smoothing splines (B)
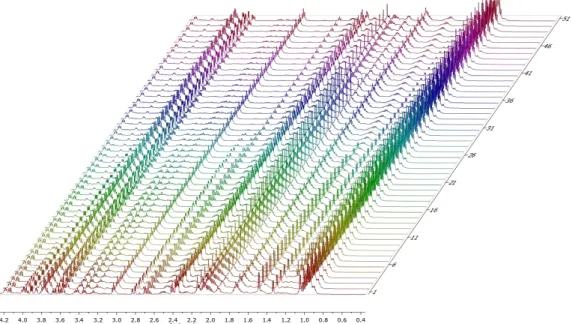
A total of 114 H1 NMR spectra were manually processed in Chenomx, 51 for the wild-type and 63 for ΔmetL. Chenomx has a built in metabolite library, with models representative of the compound peaks and its quantitative relationship to common chemical shape indicators, like TSP. These are manually overlaid and adjusted on the spectrum. Alanine, arginine, aspartate, glutamate, glycine, histidine, isoleucine, leucine, threonine, valine, serine, proline, methionine and orotate were detected, as well as phenylalanine, tyrosine, glycerol, ethanol, pyroglutamate and methionine S-oxide, although the concentrations of
15 these last metabolites did not change with time, apart from ethanol, which was secreted only in the first 3 hours of the culture.
Figure 4 – NMR spectra of the wild-type TReF experiment
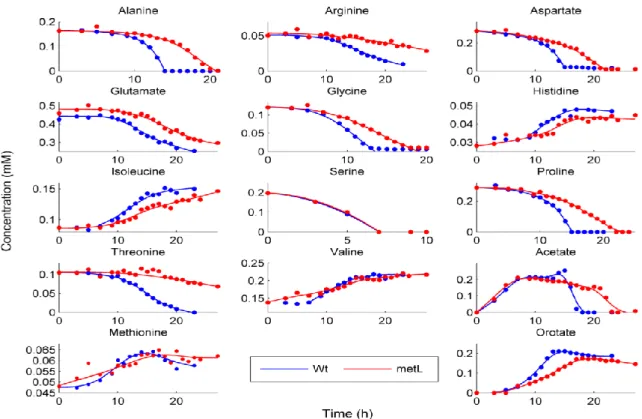
To derive the curves representative of each metabolite, I used smoothing splines again, a staple tool in functional data analysis66 (Figure 5). They are very versatile, can easily recreate the multiple functional forms seen on the metabolite time series and are a good choice to extract smooth derivatives from the data. Only a smoothing parameter needs to be tuned, to specific the amount of smoothing: too much and we get linear-least squares estimation, while no smoothing equals direct cubic interpolation. Capturing the true functional form of the underlying smooth function is crucial for accurate calculation of fluxes, and a non-parametric approach such as smoothing splines doesn’t bring along additional assumptions about the uptake or production kinetics.
16 Figure 5 – Metabolite concentration time series and their smoothing spline curve fits
Overall, these results are in good agreement with one of the most comprehensive sources of information on E.coli K-12 growth in a mixture of amino acids, where amino acid concentrations where measured with HPLC67. However, other common excretion products and overflow metabolites of E. coli weren’t detected, compared with the TReF method used by Behrends et al52.This hints that the LOD of our NMR method is probably too high.
Excretion of acetate, orotate, histidine, methionine, lysine and the branched chain amino acids isoleucine, leucine, and valine was observed. Overflow metabolism of acetate and later reuptake is a known feature of E. coli metabolism68. Pyrimidine synthesis overflow of orotate is characteristic of the K-12 strain W3110, parent strain from which the BW25113 was made, and it’s hypothesized that the cause lies in defective pyrF and pyrE genes69.
To constrain the model specific uptake and specific production rates (qsub and qprod, respectively, in mmol/gDCWh) are needed. These are calculated by dividing the derivative obtained with the fitted curves by the amount of biomass at that instant obtained from the smoothing splines fit to the growth data. Some of these rates exhibit marked differences between the wild-type and ΔmetL, and are our first source of information about their metabolic differences.
17 Figure 6 – Time profiles of the specific uptake and production rates. Blue: Wild-type. Red: ΔmetL
Dynamic Flux Balance Analysis
The metabolic network used is the iAF126040, an E. coli K-12 MG1655 genomic metabolic reconstruction containing 2382 reactions and 1039 metabolites (actually 1668 in the stoichiometric matrix, due to compartmentalization). 304 of these reactions are exchange reactions. This strain is metabolically very similar to the BW25113, and this reconstruction can be used directly (the only differences concern catabolism of sugars not relevant to this situation33). iAF1260 contains a core biomass reaction, whose flux represents a system output of metabolites required to make new cells. Since growth and non-growth associated maintenance costs were included in the stoichiometry of this reaction we can interpret its flux value directly as the predicted specific growth rate46. We will assume during this work that this biomass reaction is accurate, and both the composition and the maintenance costs are still adequate to describe E. coli biology at 25ºC. The iAF1260 model had only to be adjusted to allow excretion of methionine and orotate, both reported in the literature70,69. To do this, the flux boundaries of periplasm to cytoplasm transport reactions present in the reconstruction (METabcpp and OROT2pp), were adjusted to allow flux in the reverse direction. The
18 magnitude of the variation in concentration of methionine, lysine and leucine was small (around 0.01 mM or even less) so I opted to leave these measured fluxes out of the dFBA simulations, but excretion of those metabolites is allowed in the constraints.
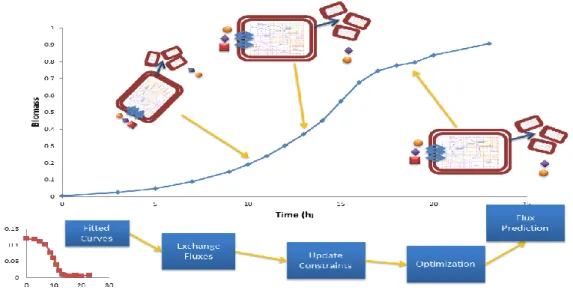
The dynamic FBA scheme employed is similar to the first and classic example of dFBA47, following what Mahadevan and coworkers48 dubbed as the Static Optimization Approach. The main difference from these examples is that assumptions are not being made about the exchange fluxes, but they updated in a time-dependent fashion using the experimental data. The effects of substrate inhibition, diauxie, and sequential utilization of substrates, as determined by the E.coli regulatory network, are already present in the measured fluxes.
Figure 7 – Conceptual scheme of the dFBA approach followed
The observed growth rate is assumed to be the most reliable measurement and is used as an equality constraint. Error in the measurements can generate an unfeasible optimization problem if they are directly imposed as equality constraints. Data reconciliation can be posed as a geometrical problem: find a point belonging to the flux cone that minimizes the Euclidean distance (or L2 norm) to the measurements, with a biomass reaction flux equal to the measured growth rate.
Because the specific growth rate is used to constraint the flux cone, it no longer makes sense to use maximization of biomass yield as the optimization criteria. Instead, I chose minimization of the intracellular fluxes Euclidean norm45 .This objective selects the solution that preferentially uses pathways with fewer steps and penalizes higher flux values (due to the quadratic terms in the objective function), all of which, in theory, would require a
19 lesser amount of enzyme production. Summing up, the more parsimonious and “cheap” flux distribution that more closely matches our measured fluxes allowing the observed biomass yield is selected.
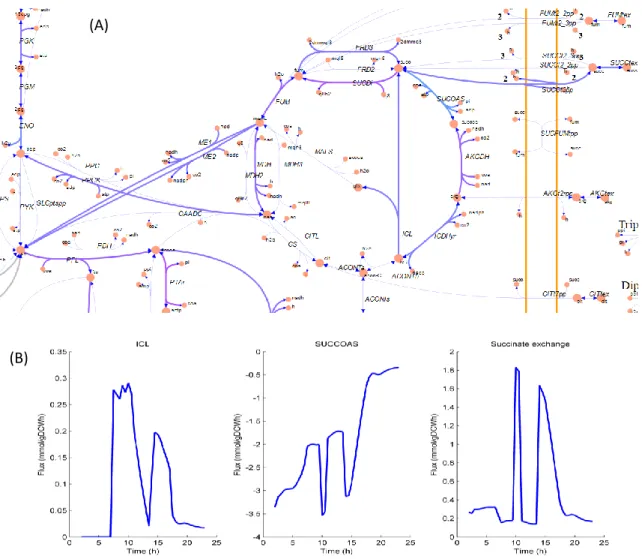
Figure 8 exemplifies the type of results obtained from such simulations. The ability of dFBA to make large scale predictions has a negative side: validation and analysis of the computational results is a truly overwhelming task. The most straightforward way to validate them is to compare computed metabolite excretion with experimental measurements.
Figure 8 – Example dFBA results. (A) – Wild-type TCA cycle flux distribution at 9.5 hours. Solid blue and purple (flux in the reverse direction) lines represent active reactions (B) – Time series for individual
reactions
The mass balance condition of Flux Balance Analysis is equivalent to the Kirchhoff node law63. But there is no equivalent loop law in standard FBA, and violations of energy conservation can occur in internal reaction loops. This is particularly troublesome in large reconstructions, such as iAF1260, and many unfeasible fluxes can be seen in loops in the optimization results. The loopless Cobra (ll-Cobra)63, available in its namesake Toolbox,
(A)
20 implements the loop law for Flux Balance Analysis. Adapting the QP approach proposed would require its conversion to a very computationally demanding MIQP problem that couldn’t be solved in an acceptable time, and thermodynamically unfeasible loops still remain an issue.
Large discrepancies were found between experimental measured fluxes and their counterparts predicted using Quadratic Programming. The measured inputs into the system are insufficient to permit the observed growth rate when these constraints are used in a classic FBA simulation with maximization of biomass as the objective criteria. The QP corrected fluxes are considerably higher than the measurements. This hints at an underestimation in the measured fluxes. The quadratic programming formulation used for data reconciliation actually distributes the necessary increase by all exchange reactions where substrate input fluxes were detected by NMR. This ends up being similar to allowing uptake of a substrate as long we see a reduction in the concentration with time (or the reverse for a product), and might blur the time-dependent preference of particular amino acids, but still allows for a qualitatively accurate interpretation of the data. This reduces the accuracy of the intracellular flux predictions, since we’re using more “artificial” constraints, and the precise reason for this underestimation needs to be understood.
Comparison between Wild-Type and ΔmetL mutant
Given the dynamic nature of microbial growth in batch culture strain metabolic differences can be more evident within specific time windows. The slower growth of ΔmetL changes the time dynamics of its whole metabolic trajectory relatively to the wild-type, making a strictly parallel comparison unrealistic (for example, because substrates are depleted earlier in the wild-type, the system will also adjust to compensate this earlier than in the mutant). To keep things simple, we use the information in the log plot, and compare the two strains by obtaining their flux distributions, at the mean time points of the growth phases observed in the log plot, (excluding only the 1st and the5th), assuming that since the ΔmetL strain displays reduced growth rates across the whole experiment, we will be able to spot the knockout effects at any time point, provided that we compare them at similar stages of their growth “history”.
ASPK and HSDy reactions can be catalyzed by enzymes other than MetL, and simply blocking them is unrealistic. From what is known about the culture media composition, these
21 are expected to be essential reactions, and stopping those reactions unsurprisingly stops in
silico growth. In the conditional gene essentiality assessment made when the Keio collection
was constructed33, this strain was found to be unable to grow on MOPS minimal media, and to grow slightly less on LB, comparative to the wild-type. Growth efficiency on CALM lies between these two extremes, which makes sense since LB is a richer medium, and hints that its extra nutrients and cofactors can compensate the loss of function. A reduction in these reactions fluxes is expected, but they still need to allow enough flux to match the experimental growth rate. To simulate the metL knockout, instead of altering the original network by removing reactions or altering flux bounds, that expectation is incorporated on the optimization problem used to find the perturbed solution at a given instant. That problem is formulated similarly to MoMA62, with the particularity that the allowed biomass reaction fluxes are bounded between the wild-type and mutant specific growth rates, and the ASPK and HSDy fluxes are minimized instead of minimizing the distance to the wild-type fluxes. This way the objective function selects the minimal flux values through ASPK and HSDy which still allow the ΔmetL specific growth rate, and the overall flux distribution is found by the MoMA principle. Because of the problem found with the measured fluxes, constraining the ΔmetL exchanges during MoMA brings additional difficulties. I decided instead to leave them out, and treat them like the other fluxes. However, if it is possible they should be used, as it will improve the reliability of the predictions.
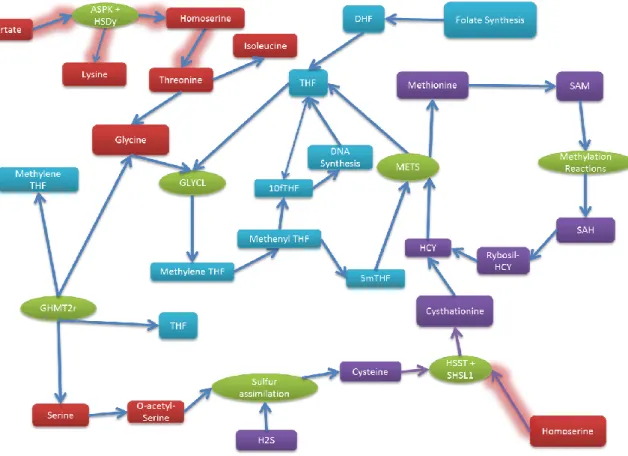
Analysis of the paired flux solutions (wild-type and mutant at similar time points) with the help of COBRA Toolbox Maps shows that this knockout causes a huge perturbation of the global flux distribution, altering the flux through many reactions, and lowering biosynthesis of various biomass precursors. But starting from ASPK and HSDy, and slowly following the thread, I could obtain meaningful information about the “root” of the ΔmetL effect: it starts with reduced homoserine synthesis, creating a bottleneck in the SHSL1 reaction, involved in the transsulfuration pathway. One of the fates of serine is conversion to O-acetyl-L-serine, required in cysteine synthesis and sulfur assimilation, and consequent formation of cystathionine and homocysteine. Reduced homocysteine remethylation to methionine, also impairs folate metabolism, by slowing the reconversion of 5-methyl-tetrahydrofolate to 5-methyl-tetrahydrofolate by methionine synthase. This reaction couples the folate and methionine cycles. The glycine cleavage system is hindered by the reduced flow in the folate cycle, and the uptake of threonine (which could also be used for glycine biosynthesis and further conversion to serine) is decreased. It seems threonine is mostly being uptaken to fulfill proteinogenic and isoleucine biosynthetic requirements, compared to the wild-type situation where the higher uptake amount is channeled to glycine biosynthesis. Glycine is used for protein biosynthesis, cleaved to supply one carbon units to folate cofactors, and also
22 converted to serine by GHMT2r, in a folate dependent reaction. When the model is modified to allow uptake of homoserine, the consequences of reduced HSDy activity are reverted and a growth rate similar to the wild-type can be achieved, even without intervening on the ASPK reaction.
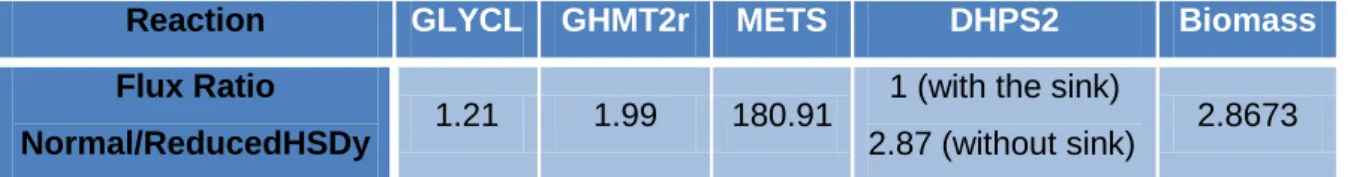
To investigate the effects on folate metabolism of reduced HSDy activity, and confirm if METS, GHMT2r and GLYCL are indeed sensitive to an HSDy bottleneck, flux variability analysis71 of these reactions plus DHPS2 (dihydropteroate synthetase, which is involved in folate synthesis and is here verified to ensure the changes in the other reactions are not caused by a defect in folate biosynthesis) was performed in normal conditions and with an HSDy bottleneck (simulated by changing the flux bounds of this reaction to -0.5 and 0.5 mmol/gDCWh). There aren’t folate cofactor sinks or exchange reactions, and apart from the biomass reaction there is no other way these cofactors can leave the system. A tetrahydrofolate sink was added to the model. With the sink, the DHPS2 reaction is unaffected by HSDy knockout, showing that the flux reduction seen in the simulation without it is not caused by any limitation in folate biosynthesis but caused by the steady-state assumption (metabolite concentrations must stay constant).
Figure 8 – Simplified metabolic sub network affected by the metL knockout. Arrows represent reactions, with green oval shapes used to name the most relevant. The glowing arrows signal the initial perturbations of the knockout. Red Boxes: metabolites. Purple boxes: Sulfur containing metabolites. Blue boxes: folate cofactors.
23
Reaction GLYCL GHMT2r METS DHPS2 Biomass Flux Ratio
Normal/ReducedHSDy 1.21 1.99 180.91
1 (with the sink)
2.87 (without sink) 2.8673 Table 1 – Flux Variability Analysis results: ratios of the maximal flux values in the normal situation/maximal flux values with HSDy bottleneck, and minimal Normal/HSDy ratio for GHMT2r. All values obtained with a thf sink added unless stated otherwise.
Table 1 shows the relative changes in the maximum flux values (or minimum, in the case of GHMT2r, the only reversible reaction of the set, and where only the reverse direction, serine biosynthesis from glycine, is affected). The hypotheses made seem plausible, and methionine synthase (METS) is shown to be particularly sensitive to the HSDy bottleneck.
It’s interesting to see that although methionine biosynthesis is affected, a small amount of excretion followed by uptake at entry in stationary phase, just as in the wild-type, is observed, which would cause this strain to become almost methionine depleted. Lysine and leucine, two other amino acids whose biosynthesis is presumably impaired in the mutant strain are also being excreted. However, there is another possibility for the excretion of methionine and other amino acids that should be investigated, and could be “contaminating” the results. Although CALM is a mixture of mostly free amino acids, there might be a non-negligible amount of remaining oligopeptides present. NMR has reduced sensitivity and high limits of detection, so an investigation of the culture media composition using LC-MS, which is much more sensitive, would be informative, as well as screening the CALM for the presence of homoserine, cysteine, cysthationine and homocysteine. A considerable amount of non-measurable peptide uptake could be the reason why the measured substrate intake is insufficient to allow the specific growth rates observed and a QP data reconciliation approach had to be used. The essentiality of the metL gene in MOPS suggests that either these isozymes are not expressed in growth on that culture medium, or that the gene is truly essential but there are small amounts of these compounds in the culture medium, below the NMR limits of detection. These would be completely absent in MOPS, and present in both our CALM and LB, in higher amounts in the latter.
Globally, the main problem in the ΔmetL strain is a defect in homoserine synthesis, which impairs the transsulfuration pathway, leading to reduced cystathionine, homocysteine, and methionine production (summary diagram in figure 8). Reduced homocysteine remethylation to methionine, also reduces fluxes in folate metabolism, by reducing METS activity, a phenomenon known as methyl trapping72, and the lower flux capacity in the folate
24 cycle slows glycine and serine metabolism, used to provide tetrahydrofolate with one carbon units. Overexpression of some amino acid transporters would probably be enough to achieve a growth rate similar to the wild-type, at least while threonine, methionine, lysine and isoleucine were still available, but our data shows no evidence of altered transport of methionine. In fact, threonine uptake is reduced, which even seems counterintuitive, but the reason for this can be seen in the model: the perturbations in the folate cycle lower the capacity of the glycine cleavage system and the reverse direction of GHMT2r, lowering the threonine demands for glycine and serine synthesis.
To confirm these hypotheses an initial straightforward experiment would be to supplement CALM with either homoserine or homocysteine (since methionine is not being uptaken) and check the growth curve of the ΔmetL strain in these conditions. Also measuring the intracellular pools of these metabolites, as well as methionine, would be good to confirm the hypothetical depletion of their intracellular pools in the ΔmetL strain. Comparing the wild-type and mutant 5mTHF, glycine, and serine levels is another possible experiment, to investigate the hypotheses regarding folate metabolism.
There is a strong possibility that the previously found lifespan enhancing effect caused by reduced folate biosynthesis32 could be working through the same mechanism as the ΔmetL effect. These two different longevity enhancing manipulations intersect at the folate and methionine cycles. The modeling results provide an explanation for the reduced ΔmetL growth but identification of the precise mechanism through which altered bacterial metabolism is affecting C. elegans lifespan is harder. Methionine restriction is known to cause lifespan extension in model organisms, and it’s one of the hypothesis for the lifespan extension in the worm72,73. Another interesting and noteworthy fact is the relationship between the methionine cycle and Autoinducers (AI), quorum sensing molecules that induce expression of virulence factors in some E. coli strains75,76,77. AI-2 production, known to occur in E.coli K-12 MG1655, is directly dependent on SAH and flux through the methionine cycle75,76. Although biosynthesis of AI-3 was to my knowledge never investigated in E. coli
K-12, since most studies of this autoinducer focus on Enterohemorragic E. coli serotype
O157:H7, the signaling cascade involved in the response to this molecule is present in this strain background81 and Walters et al77 reported that both homocysteine remethylation and the homocysteine biosynthetic route from aspartate and threonine, both affected by metL knockout, are involved or can interfere with AI-3 production, even if indirectly.
25
IV – CONCLUSIONS
In this work, the coupling of TReF and Flux Balance Analysis to obtain a dynamic description of metabolic transiency and reprogramming during growth in a batch culture has been explored. This is a promising tool for investigation of bacterial metabolism and physiology. TReF provides useful flux measurements to constraint and shape the flux cone, and Flux Balance Analysis uses that information obtained to make predictions about the intracellular flux distribution, besides being an interesting framework to test hypothesis and interpret some of the experimental observations.
I’ve followed a dynamic FBA approach, generating a solution per time point. In a situation like this, discerning what changes are relevant or not is very difficult. Uncertainty in the data, and possible multiple optimal solutions, pose additional problems to a dFBA approach, where strain comparison is based on a single flux distribution per time point. This was a first approach to the situation, and other constraint-based methods36 or mathematical tools in general could be tried, especially those that explore the flux cone instead of focusing on a single point, like Flux Variability Analysis71 or ACHR sampling78, to provide more robust results and help pinpoint what really matters. However, these techniques are computationally more demanding, making their use in dFBA and batch culture simulations slightly harder.
To keep things simple, the information provided in the log plot of the growth curves was used to base the comparison at a small number of time points. However, to fully take advantage of the whole temporal span of a TReF experiment and the dFBA data, more sophisticated approaches are desirable. Development of algorithms for alignment of TReF data, based in similarities in specific rates between the two strains, would greatly benefit dynamic strain comparisons.
It was assumed that the biomass composition of E. coli doesn’t change drastically at 25ºC, compared to biomass composition at 37ºC. Although some information in the literature hints that this assumption is reasonable79,80, a more thorough investigation is required.
The approach described in this thesis was deployed and tested in the study of the ΔmetL strain, a Keio collection single gene knockout of the metL gene with reduced growth in a mixture of amino acids and found in a genetic screen to cause an increase in C. elegans lifespan compared to the wild-type. The model predictions hint that the cause for the growth defect in the mutant strain is reduced homoserine synthesis, an important biosynthetic intermediate of threonine and methionine. This slows down the transsulfuration pathway, lowering homocysteine and methionine biosynthesis. Both the reduction in methionine
26 synthesis and the effect it causes on folate metabolism stall the growth rate. Some experiments were proposed to test these hypotheses.
Just like sulphonamide treatment, the metabolic perturbation caused by the metL gene deletion also affects one carbon metabolism, and it is a very likely possibility that these treatments are enhancing C. elegans lifespan through the same mechanism.
27
ABBREVIATIONS
ACHR – Artificially centered Hit and Run ASPK – Aspartate Kinase
CALM – Casamino Acid Liquid Medium dFBA – Dynamic Flux Balance Analysis DHPS2 – Dihydropteroate Synthetase FBA – Flux Balance Analysis
FVA – Flux Variability Analysis
HPLC – High Performance Liquid Chromatography HSDy – Homoserine Dehydrogenase
LC-MS – Liquid Chromatography-Mass Spectrometry LP/QP – Linear/Quadratic Programming
MILP/MIQP – Mixed Integer Linear/Quadratic Programming MoMA – Minimization of Metabolic Adjustment
MOPS - 3-(N-morpholino)propanesulfonic acid NMR – Nuclear Magnetic Resonance Spectroscopy Q – Coenzyme Q
SAH – S- adenosylHomocysteine SAM – S-adenosylMethionine SHSL1 - O-succinylhomoserine lyase
28
REFERENCES
1 - Rodney D. Berg, The indigenous gastrointestinal microflora, Trends in Microbiology, Volume 4, Issue 11, 1996.
2 - Ann M O'Hara and Fergus Shanahan, The gut flora as a forgotten organ, EMBO Rep. 2006 July; 7(7): 688–693, 2006
3 - Wang Z. et al, Gut flora metabolism of phosphatidylcholine promotes cardiovascular disease, Nature 472, 57–63, doi:10.1038/nature09922, 2011
4 – Turnbaugh PJ, Ley RE, Mahowald MA, Magrini V, Mardis ER, et al. An obesity-associated gut microbiome with increased capacity for energy harvest. Nature 444: 1027–1031, 2006.
5 – Turnbaugh PJ et al, A core gut microbiome in obese and lean twins, Nature 457, 480-484, doi:10.1038/nature07540, 2009
6 – Margaret L. Zupancic et al, Analysis of the Gut Microbiota in the Old Order Amish and Its Relation to the Metabolic Syndrome, PLoS ONE 7(8): e43052. doi:10.1371/journal.pone.0043052, 2012
7 – Kaddurah-Daouk R, Baillie RA, Zhu H, Zeng Z-B, Wiest MM, et al, Enteric Microbiome Metabolites Correlate with Response to Simvastatin Treatment. PLoS ONE 6(10): e25482 doi:10.1371/journal.pone.0025482, 2011
8 – Helena MRT Parracho, Max O Bingham, Glenn R Gibson and Anne L McCartney, Differences between the gut microflora of children with autistic spectrum disorders and that of healthy children, J Med Microbiol October 2005 vol. 54 no. 10 987-991, 2005
9 – Yap IK, Angley M, Veselkov KA, Holmes E, Lindon JC, Nicholson JK, Urinary metabolic phenotyping differentiates children with autism from their unaffected siblings and age-matched controls, J Proteome Res. 2010 Jun 4;9(6):2996-3004, 2010
10 – Javier A. Bravo, Paul Forsythe, Marianne V. Chew, et al, Ingestion of Lactobacillus strain regulates emotional behavior and central GABA receptor expression in a mouse via the vagus nerve, Proceedings of the National Academy of Sciences; DOI: 10.1073/pnas.1102999108, 2011 11 – Sergei I. Grivennikov et al, Adenoma-linked barrier defects and microbial products drive IL-23/IL-17-mediated tumour growth, Nature, doi:10.1038/nature11465, 2012
12 – Janelle C. Arthur et al, Intestinal Inflammation Targets Cancer-Inducing Activity of the Microbiota, Science 5 October 2012: Vol. 338 no. 6103 pp. 120-123 DOI: 10.1126/science.122482, 2012
13 – Berer K, Mues M, Koutrolos M, Rasbi ZA, Boziki M, Johner C, Wekerle H, Krishnamoorthy G, Commensal microbiota and myelin autoantigen cooperate to trigger autoimmune demyelination, Nature. 2011 Nov 24; 479(7374):538-41, 2011
14 – Gomez A, Luckey D, Yeoman CJ, Marietta EV, Berg Miller ME, et al, Loss of Sex and Age Driven Differences in the Gut Microbiome Characterize Arthritis-Susceptible *0401 Mice but Not Arthritis-Resistant *0402 Mice, PLoS ONE 7(4): e36095. doi:10.1371/journal.pone.0036095, 2012 15 – Yatsunenko, T. et al, Human gut microbiome viewed across age and geography, Nature 486, 222–227, 2012
16 – Arumugam, M, Enterotypes of the human gut microbiome, Nature 473, 174–180, doi:10.1038/nature09944, 2011
17 - Peter J. Turnbaugh, Ruth E. Ley, Micah Hamady, Claire M. Fraser-Liggett, Rob Knight & Jeffrey I. Gordon, Feature The Human Microbiome Project, Nature 449, 804-810, doi:10.1038/nature06244, 2007
18 - Biagi E, Candela M, Fairweather-Tait S, Franceschi C, Brigidi P, Aging of the human metaorganism: the microbial counterpart, Age (Dordr). 2012 Feb;34(1):247-67, 2012
19 - Elaine Holmes, James Kinross, Glenn R. Gibson, Remy Burcelin, Wei Jia, Sven Pettersson and Jeremy K. Nicholson, Therapeutic Modulation of Microbiota-Host Metabolic Interactions, Sci Transl Med 6 June 2012: Vol. 4, Issue 137, p. 137rv6 DOI: 10.1126/scitranslmed.3004244, 2012 20 - Ottaviani E, Ventura N, Mandrioli M, Candela M, Franchini A, Franceschi C., Gut microbiota as a candidate for lifespan extension: an ecological/evolutionary perspective targeted on living organisms as metaorganisms, Biogerontology. 2011 Dec;12(6):599-609. doi: 10.1007/s10522-011-9352-5, 2011
21 - Christopher M Rath, Pieter C Dorrestein, The bacterial chemical repertoire mediates metabolic exchange within gut microbiomes, Current Opinion in Microbiology, Volume 15, Issue 2, Pages 147-154, 2012
29
22 - Stiernagle, T. Maintenance of C. elegans, February 11, 2006, WormBook, ed. The C. elegans Research Community, WormBook, doi/10.1895/wormbook.1.101.1, http://www.wormbook.org, 2006 23 – Isabelle Lenaerts, Glenda A. Walker, Luc Van Hoorebeke, David Gems, and Jacques R. Vanfleteren, Dietary Restriction of Caenorhabditis elegans by Axenic Culture Reflects Nutritional Requirement for Constituents Provided by Metabolically Active Microbes, Journal of Gerontology: BIOLOGICAL SCIENCES 2008, Vol. 63A, No. 3, 242–252, 2008
24 – Delia Garigan, Ao-Lin Hsu, Andrew G. Fraser, Ravi S. Kamath, Julie Ahringer and Cynthia Kenyon, Genetic Analysis of Tissue Aging in Caenorhabditis elegans: A Role for Heat-Shock Factor and Bacterial Proliferation, Genetics July 1, vol. 161 no. 3 1101-1112, 2002
25 – Carole Couillault, Jonathan J. Ewbank, Diverse Bacteria are Pathogens of Caenorhabditis elegans, Infect Immun., August; 70(8): 4705–4707, 2002
26 – Kim Y, Mylonakis E., Caenorhabditis elegans immune conditioning with the probiotic bacterium Lactobacillus acidophilus strain NCFM enhances gram-positive immune responses, Infect Immun. Jul;80(7):2500-8. Epub 2012 May 14, 2012
27 – Sánchez-Blanco A, Kim SK, Variable Pathogenicity Determines Individual Lifespan in Caenorhabditis elegans. PLoS Genet 7(4): e1002047. doi:10.1371/journal.pgen.1002047, 2011 28 – Wolfgang Maier, Bakhtiyor Adilov, Martin Regenass, Joy Alcedo, A Neuromedin U Receptor Acts with the Sensory System to Modulate Food Type-Dependent Effects on C. elegans Lifespan, PLoS Biol 8(5): e1000376. doi:10.1371/journal.pbio.1000376, 2010
29 – Cynthia Portal-Celhay, Ellen R Bradley and Martin J Blaser, Control of intestinal bacterial proliferation in regulation of lifespan in Caenorhabditis elegans, BMC Microbiology, 12:49 doi:10.1186/1471-2180-12-49, 2012
30 - Saiki R, Lunceford AL, Bixler T, Dang P, Lee W, Furukawa S, Larsen PL, Clarke CF, Altered bacterial metabolism, not coenzyme Q content, is responsible for the lifespan extension in Caenorhabditis elegans fed an Escherichia coli diet lacking coenzyme Q, Aging Cell. 7(3):291-304, 2008
31 - Pamela L. Larsen, Catherine F. Clarke, Extension of Life-Span in Caenorhabditis elegans by a Diet Lacking Coenzyme Q, Science January 2002: Vol. 295 no. 5552 pp. 120-123 DOI: 10.1126/science.1064653, 2002
32 - Bhupinder Virk, Gonçalo Correia, David P Dixon, Inna Feyst, Jie Jia, Nikolin Oberleitner, Zoe Briggs, Emily Hodge, Robert Edwards, John Ward, David Gems and David Weinkove, Excessive folate synthesis limits lifespan in the C. elegans: E. coli aging model, BMC Biology, 10:67 doi:10.1186/1741-7007-10-67, 2012
33 – Baba T, Ara T, Hasegawa M, Takai Y, Okumura Y, Baba M, Datsenko KA, Tomita M, Wanner BL, Mori H, Construction of Escherichia coli K-12 in-frame, single-gene knockout mutants: the Keio collection, Mol Syst Biol., 2:2006.0008, 2006
34 - Daniel Machado, Rafael S Costa, Miguel Rocha, Eugénio C Ferreira, Bruce Tidor and Isabel Rocha, Modeling formalisms in Systems Biology, AMB Express, 1:45 doi:10.1186/2191-0855-1-45, 2011
35 - Jeffrey D Orth, Ines Thiele and Bernhard Ø Palsson, What is flux balance analysis?, Nature Biotechnology 28, 245–248, doi:10.1038/nbt.1614, 2010
36 – Lewis, N.E., Nagarajan, H., and Palsson, B.Ø. Constraining the metabolic genotype– phenotype relationship using a phylogeny of in silico methods, Nature Reviews Microbiology 10, 291-305, 2012
37 - Matthew A. Oberhardt, Bernhard Ø. Palsson, Jason A. Papin, Applications of genome-scale metabolic reconstructions, Molecular Systems Biology 5:320, 2009
38 – Andrew R. Joyce, Jennifer L. Reed, Aprilfawn White, Robert Edwards, Andrei Osterman, Tomoya Baba,Hirotada Mori,Scott A. Lesely, Bernhard Ø. Palsson and Sanjay Agarwalla, Experimental and Computational Assessment of Conditionally Essential Genes in Escherichia coli, J Bacteriol. 188(23): 8259–8271, 2006
39 – Ines Thieleand Bernhard Ø. Palsson, A protocol for generating a high-quality genome-scale metabolic reconstruction, Nat Protoc; 5(1): 93–121, 2010
40 - Adam M Feist, Christopher S Henry, Jennifer L Reed, Markus Krummenacker, Andrew R Joyce, Peter D Karp, Linda J Broadbelt, Vassily Hatzimanikatis, and Bernhard Ø Palsson, A genome-scale metabolic reconstruction for Escherichia coli K-12 MG1655 that accounts for 1260 ORFs and thermodynamic information, Mol Syst Biology; 3: 121, 2007
30
41 – Orth JD, Conrad TM, Na J, Lerman JA, Nam H, Feist AM and Palsson BØ, A comprehensive genome-scale reconstruction of Escherichia coli metabolism—2011, Mol Syst Biology; 7:535. doi:0.1038/msb.2011.65, 2011
42 – Wagner C, Urbanczik R, The geometry of the flux cone of a metabolic network, Biophys J.; 89(6):3837-45, 2005
43 – Robert Schuetz,Lars Kuepfer, and Uwe Sauer, Systematic evaluation of objective functions for predicting intracellular fluxes in Escherichia coli, Mol Syst Biololgy; 3: 119, 2007
44 – Varma, Amit, Palsson, Bernhard Ø, Metabolic Capabilities of Escherichia coli II. Optimal Growth Patterns, Journal of Theoretical Biology 165(4): 503-522, 1993
45 – Hermann-Georg Holzhütter, The principle of flux minimization and its application to estimate stationary fluxes in metabolic networks, European Journal of Biochemistry Volume 271, Issue 14, pages 2905–2922, 2004
46 - Feist AM, Palsson B Ø, The biomass objective function, Curr Opin Microbiol; 13(3):344-9, 2010 47 – A Varma and B Ø Palsson, Stoichiometric flux balance models quantitatively predict growth and metabolic by-product secretion in wild-type Escherichia coli W3110, Appl. Environ.
Microbiol. October 1994 vol. 60 no. 10 3724-3731, 1994
48 – Radhakrishnan Mahadevan, Jeremy S Edwards, and Francis J Doyle, 3rd
, Dynamic flux balance analysis of diauxic growth in Escherichia coli, Biophys J.; 83(3): 1331–1340, 2002
49 - Xueyang Feng, You Xu, Yixin Chen,and Yinjie J. Tang, Integrating Flux Balance Analysis into Kinetic Models to Decipher the Dynamic Metabolism of Shewanella oneidensis MR-1, PLoS Comput Biol. 2012 February; 8(2): e1002376, 2012
50 - Valeria Mapelli, Lisbeth Olsson and Jens Nielsen, Metabolic footprinting in microbiology: methods and applications in functional genomics and biotechnology, Trends in Biotechnology, Volume 26, Issue 9, 490-497, doi:10.1016/j.tibtech.2008.05.008, 2008
51 - Douglas B. Kell, Marie Brown, Hazel M. Davey, Warwick B. Dunn, Irena Spasicand Stephen G. Oliver, Metabolic footprinting and systems biology: the medium is the message, Nature Reviews Microbiology 3, 557-565, doi:10.1038/nrmicro1177, 2005
52 - Volker Behrends, Tim M. D. Ebbels, Huw D. Williams and Jacob G. Bundy, Time-Resolved Metabolic Footprinting for Nonlinear Modeling of Bacterial Substrate Utilization, Appl. Environ. Microbiol. April 2009 vol. 75 no. 8 2453-2463, 2009
53 - Gaspard Lequeux, Joeri Beauprez, Jo Maertens, Ellen Van Horen, Wim Soetaert, Erick Vandamme, and Peter A. Vanrolleghem, Dynamic Metabolic Flux Analysis Demonstrated on Cultures Where the Limiting Substrate Is Changed from Carbon to Nitrogen and Vice Versa, Journal of Biomedicine and Biotechnology Volume 2010, Article ID 621645, doi:10.1155/2010/621645, 2010
54 - Kwang Ho Lee, Jin Hwan Park, Tae Yong Kim, Hyun Uk Kim and Sang Yup Lee, Systems metabolic engineering of Escherichia coli for L-threonine production, Molecular Systems Biology 3:149, doi:10.1038/msb4100196
55 - G. M. Ljung and G. E. P. Box, On a Measure of a Lack of Fit in Time Series Models, Biometrika 65 (2): 297–303. doi:10.1093/biomet/65.2.297, 1978
56 - Holm, S, A simple sequentially rejective multiple test procedure. Scandinavian Journal of Statistics 6 (2): 65–70. JSTOR 4615733. MR 538597, 1979
57 - R Development Core Team, R: A language and environment for statistical computing, R Foundation for Statistical Computing, Vienna, Austria. ISBN 3-900051-07-0, URL : http://www.R-project.org/, 2011
58 – Schellenberger J, Que R, Fleming RM, Thiele I, Orth JD, Feist AM, Zielinski DC, Bordbar A, Lewis NE, Rahmanian S, Kang J, Hyduke DR, Palsson BØ, Quantitative prediction of cellular metabolism with constraint-based models: the COBRA Toolbox v2.0, Nat Protoc.;6(9):1290-307. doi: 10.1038/nprot.2011.308, 2011
59 – Bornstein, B. J., Keating, S. M., Jouraku, A., and Hucka M. (2008) LibSBML: An API Library for SBML. Bioinformatics, 24(6):880–881, doi:10.1093/bioinformatics/btn051.
60 - Hucka, M, Finney, A, Sauro, H. M, Bolouri, H, Doyle, J. C, Kitano, H., And The Rest Of The Sbml Forum, Arkin, A. P. et al, The systems biology markup language (SBML): A medium for