of Chemical
Engineering
ISSN 0104-6632 Printed in Brazil www.scielo.br/bjce
Vol. 35, No. 02, pp. 489 - 496, April - June, 2018 dx.doi.org/10.1590/0104-6632.20180352s20170188
BIOCHEMICAL RESPONSES FROM BIOMASS
OF ISOLATED
CHLORELLA SP.
, UNDER
DIFFERENT CULTIVATION MODES: NON-LINEAR
MODELLING OF GROWTH KINETICS
Praveen K
1,2, Abinandan S
1,2, Natarajan R
1,2and Kavitha M. S
1,2*
1 CO
2 Research and Green Technologies Centre, VIT University, Vellore 632014, Tamilnadu, India
2 Energy & Environmental Engineering Division, School of Mechanical & Building Scinces VIT University, Vellore 632014, Tamilnadu, India
(Submitted: April 6, 2017; Revised: April 19, 2017; Accepted: April 28, 2017)
Abstract - In this study, the effect of different modes of cultivation viz., photoautotrophic (AT), heterotrophic (HT) and photomixotrophic (MT), on the growth and biochemical responses of Chlorella sp. isolated from local ponds. The performance of microalgal growth was quantified using nonlinear growth models such as Gompertz, logistic, Baranyi-Roberts, Morgan under different cultivation conditions. The results revealed that microalgae could grow better in MT than in other cultivation modes with a major increase in biochemical responses for carbohydrates, which showed higher accumulation under HT. The maximum biomass concentration was 1.24 g L-1 (MT), 1.16 g L-1 (HT), 0.76 g L-1 (AT) with maximum specific growth rates of 0.0083 h-1 (HT), 0.0078
h-1 (MT) and 0.0055 h-1 (AT) respectively. The biomass concentration was higher in the order of MT>HT>AT
for which MT yielded 8.8 fold higher biomass, compared with the initial biomass concentration, at the end of experiments (16 days). Concomitant increases in biochemical responses were observed in the three cultivation conditions. Protein and lipid accumulation in the MT mode was higher (1.2 fold) compared with the initial protein yield as well as the other cultivation modes. However, the carbohydrate yield was higher (1.12 fold) in the heterotrophic mode than in other cultivation conditions.
Keywords: Microalgal isolate, cultivation condition, biomass applications, bioenergy.
INTRODUCTION
Overexploitation of fossil fuels and lack of availability of alternate resources to meet the energy demand in the present scenario is increasing day by day (Vasudevan and Briggs, 2008). However, fluctuations in crude oil prices and the predicted lack of availability of resources are the best comfort zone to make the other alternate renewable energy sources viable. On the other hand, global warming due to fossil fuel utilization is another major problem
growth time (Brennan and Owende, 2010). Microalgae are among the important feedstocks for various applications such as biofuels, nutraceuticals, fertilizers etc., as they are produced in non-arable lands (Li et al., 2014). The growth of microalgae primarily depends upon light, media components (esp., carbon, nitrogen) and growth conditions (Ogbonna and Tanaka, 2000; Li et al., 2008; Liu et al., 2008) Usually, microalgae are cultivated in open ponds and photobioreactors under photoautotrophic condition. However, due to certain limitations like self-shading (light limitation) which hinders the growth of algae and biomass production, heterotrophic-based cultivation systems were introduced to avoid light and use a carbon source to support the growth of microalgae (Liang et al. 2009). However, certain limitations such as supply of oxygen and long-term commercialization are a few issues that limit the use of heterotrophy cultivation systems for microalgae cultivation (Spolaore et al., 2006). Hence, to address the issues and concern raised form autotrophic and heterotrophic systems, a mixotrophic mode of cultivation for microalgae systems was adopted to make algae cultivation simple, easier, and attractive (Li et al., 2008). Thus, several studies have been conducted for microalgae cultivation focused on biomass production and applications (Lee et al., 1996; Bhatnagar et al., 2011; Li et al., 2012). In mixotrophic mode, microalgae tend to use both organic and inorganic carbons sources for growth; thereby they tend increase more biomass and other biochemical features depending upon the substrate availability (Chojnacka and Noworyta, 2004; Liang et al., 2009). The main objective is to study the native isolate of microalgae subject to different modes of cultivation in a bubble column photobioreactor (PBR) focusing on biomass production and biochemical composition. In this paper, the microalgae were isolated from nearby ponds and subjected to cultivation under photoautotrophic (AT), photomixotrophic (MT) and heterotrophic (HT) conditions by the supply of atmospheric air as source of CO2 and glucose (organic carbon source) in the growth medium in an enclosed bubble column photobioreactor (PBR). Glucose helps algae reach higher growth rates and possesses more energy content compared to other organic substrates (Perez-Garcia et al., 2011). The biochemical responses such as carbohydrates, proteins and lipids were recorded in all the cultivation modes of microalgae cultivation.
Microalgal culture identification, isolation and
inoculum preparation
Water samples were collected in pre-sterilized polyethylene glass bottles from a freshwater source
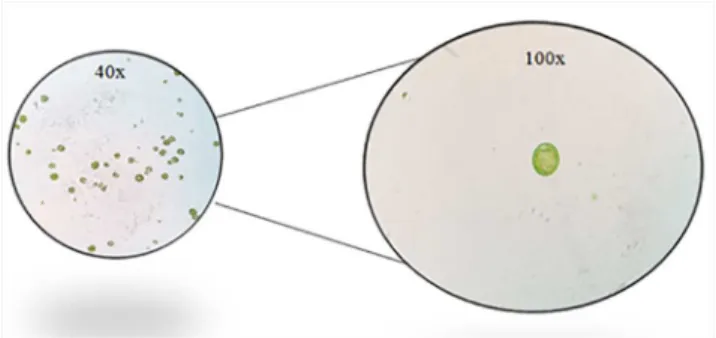
near VIT University, Vellore, India. These isolated samples, when observed under microscope with 40 X magnification, were identified as Chlorella sp. (Figure 1) and stored by plating on BG11 (Chlorella)
under axenic condition (UTEX 2009). The cultures were developed from a small volume (10 mL) to a greater volume (50 mL). 50 mL each algae was then separately inoculated into growth medium and maintained at 25ºC, with 3000 lux measured using a lux meter (TES corp.,) under constant illumination.
Figure 1. Microscopic image (40x, 100x) of the native isolates of
microalgae Chlorella sp.
Experimental design
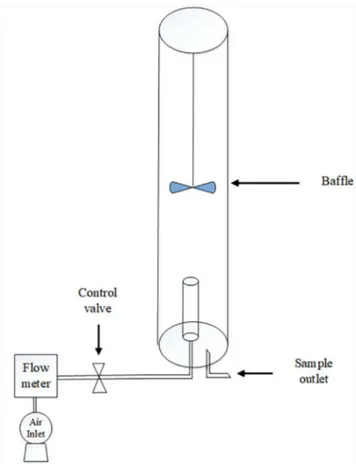
Batch scale experiments were carried out in bubble column photobioreactor (Schematic representation shown in Figure 2) with a working volume of 1.5 L and with organic substrate (glucose 1 g L-1 in growth
medium). The reactor (made of acrylic material) under atmospheric air from a compressor at the flow rate of 0.03 vvm (~380 ppm CO2) to mimic a mixotrophic condition supported with baffles at the top for mixing. Log phase cells of microalgal samples were used as the inoculum with a size of 10% (v v-1) with an initial cell
density of 20 × 105 cells mL-1 for experiments in the
photobioreactor. Suspended microalgal cultures were separated from the growth media by centrifugation at 8000 rpm for 20 minutes. All the analyses were carried out in triplicates and the average was used for data analysis.
Analytical experiments
The logistic model defines the microbial populations as a function of the initial population (biomass), growth rate and final population. The Gompertz model defines a large number of the growth functions and was later modified (Zwittering et al., 1990) to include biological relevant parameters .The Morgan model is another expression for the microbial biomass growth estimation. The Baranyi-Roberts model is geometrically different because it exhibits a quasi-segment during the log phase of cells. A nonlinear regression technique was used to fit the growth models using SPSS 21.0 and the correlation coefficient (R2),
root mean square value (RMSE) and standard error of prediction (%SEP) were calculated for determining the goodness of fit using the formula given in the literature (Mohamed et al., 2014).
RESULTS AND DISCUSSION
Growth behavior in cultivation modes
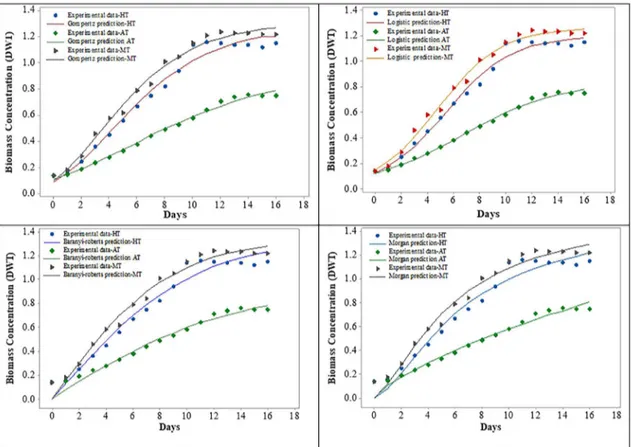
The microalgae Chlorella sp., showed good growth in all the cultivation modes depicted in Figure 3. The biomass concentration in MT cultivation exhibited an 8.8-fold increase (1.2 g L-1) at the 12th day compared
to the initial biomass content. Likewise, the AT mode exhibited good growth but less compared to the HT & MT modes. At the 14th day of cultivation, the biomass
was ~ 5-fold increased compared to the initial day. However, the growth attained ~ 8-fold increase in HT at the 11th day of cultivation. Nevertheless, the specific
growth rate was slightly higher in HT compared to MT, despite higher biomass accumulation in MT compared
Figure 2. Schematic representation of the photobioreactor (PBR) for the
study
(Lowry, 1951). Following the Bligh and Dyer method (Bligh and Dyer, 1959) total lipids were extracted.
Non-Linear model
Four microbial nonlinear models, namely logistic, Gompertz, Baryani-Roberts, and Morgan were used in the study (Table 1).
Table 1. Non-Linear model for the algal growth curve.
Model Equation Reference
Gompertz
Zwittering et al. (1990)
Logistic
Baranyi-Roberts
( )
( ) ( ) exp expX At
Y t X t In 1 n 1
n
-= - T + Q Q V VY
where,
exp exp exp
X t t 1In t t
n n nm n m
= + - + - - - +
Q V Q Q V Q V Q Q VVV
Baranyi and Roberts (1995)
Morgan
( ) *
Y t
K t
A t
= +
j j j
Morgan et al. (1975)
*exp(1)=2.718; Y(t) is the predicted biomass yield with respect to time (t); A is the maximum biomass produced at various cultivation conditions, µ is the specific growth rate (d -1); λ is the lag phase observed; X(t) is the adjustment function for cell growth as described in literature (Mohamed et al., 2014). K is
the half maximum growth with respect to time (t) and ϑ is the curvature parameter.
( ) exp exp exp( )
Y t A
A t
1
1
n
m
= T- T Q - V+ YY
( )
exp A
Y t
t A
4
1 n 2
m
=
Figure 3. Non-Linear model for the growth of Chlorella sp., under various cultivation modes. to the other condition, indicating the affirmative role
of organic and inorganic carbon sources, which help enhance the biomass rate (Nigam et al., 2011). The four nonlinear models fit the experimental data (Figure 3) using adjusted parameters is shown in Table 3. All the models were in good agreement with cultivation modes expect for MT, which exhibited an R2 value
of 0.85 for the logistic model. In addition, Table 2 portrays the performance indices for the nonlinear microbial models. The correlation was in the order of Gompertz > logistic > Morgan = Baranyi for HT and AT whereas Gompertz> Baranyi> Morgan> logistic for MT, supporting the above statement. RMSE is a good fit to extent the correctness and the lower value specifies the finest model agreement (Nigam et al., 2011). In this study, the RMSE value was lower to all the models, which is perfectly aligned with the %SEP values, respectively. Overall, the logistic and the Gompertz models described the growth kinetics effectively in this study. Similar results with lower SEP values shown during cultivation of Tetraselmis sp. under in media (Mohamed et al., 2014).
Variation of biochemical composition in different
cultivation modes of microalgae
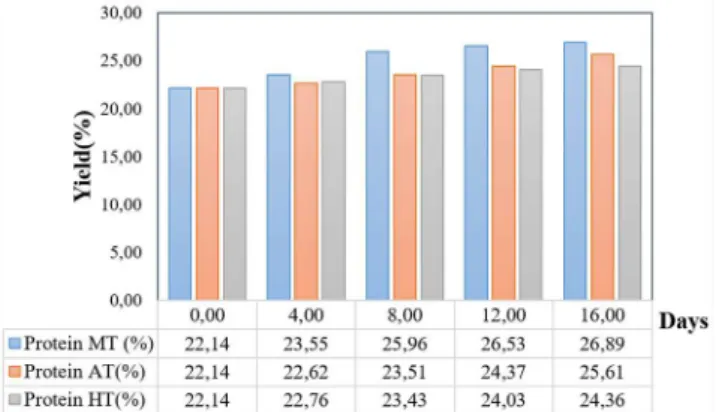
The protein profiles for microalgae under different modes of cultivation are shown in Figure 4. Initially,
Chlorella sp., possessed 22.14 % of protein, and during the 16th day of cultivation in the HT condition, it can be noted that accumulation of protein content was 24.36% with relative increase of 1.1-fold, with respect to the initial day concentration. Likewise, the AT cultivation system exhibited a 25.61% yield of protein, which is a 1.15-fold relative increase. However, protein contents were higher in the MT condition than in the other modes, which indicated the role of both organic and inorganic substrate favorable for the accumulation of protein content. This may be due to the fact that the presence of organic carbon (glucose) promoted the cell metabolic pathway of algae thereby increasing protein content (Endo et al., 1974). Carbohydrate is an important energy source in microalgae as compared to lipids, which play a crucial role for bioethanol production. The carbohydrate profiles of microalgae are shown in Figure 5, respectively. At the 16th day of
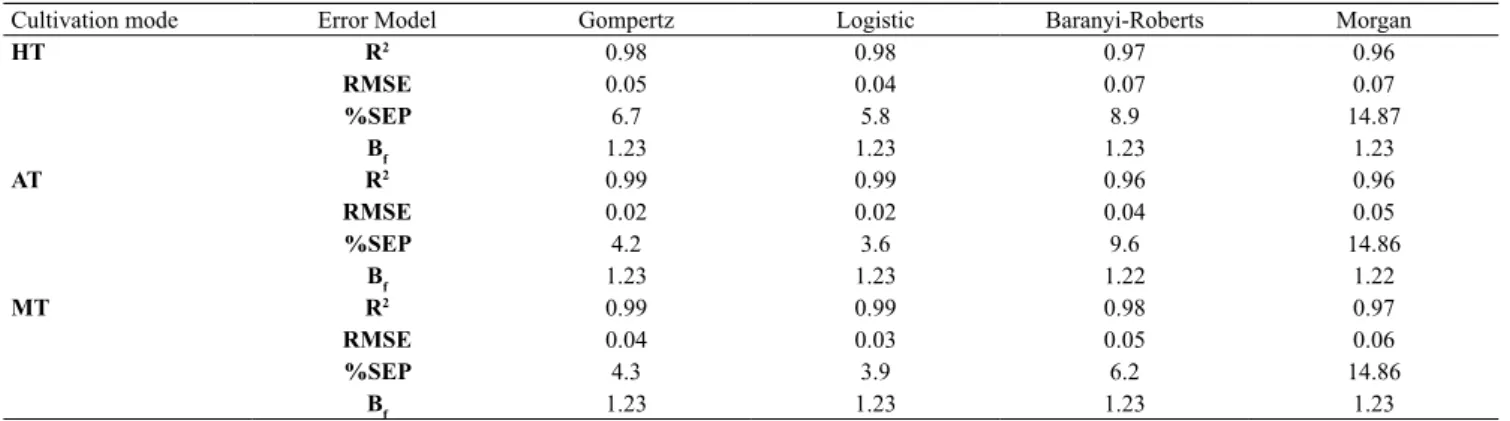
Table 2. Performance indices of the nonlinear model for Chlorella sp. under various cultivation modes.
Cultivation mode Error Model Gompertz Logistic Baranyi-Roberts Morgan
HT R2 0.98 0.98 0.97 0.96
RMSE 0.05 0.04 0.07 0.07
%SEP 6.7 5.8 8.9 14.87
Bf 1.23 1.23 1.23 1.23
AT R2 0.99 0.99 0.96 0.96
RMSE 0.02 0.02 0.04 0.05
%SEP 4.2 3.6 9.6 14.86
Bf 1.23 1.23 1.22 1.22
MT R2 0.99 0.99 0.98 0.97
RMSE 0.04 0.03 0.05 0.06
%SEP 4.3 3.9 6.2 14.86
Bf 1.23 1.23 1.23 1.23
Table 3. Parameter values in nonlinear model.
Model Equation
Gompertz
Logistic
Baranyi-Roberts
Morgan
( ) . exp exp . *. exp
HT t 1 16 t
1 16
0 198 1
1 1
= T- T
Q QV V
- + YY( ) . exp exp . *.exp
AT t 0 76 t
0 76
0 12 1
1 1
= T- T
Q QV V
- + YY( ) . exp exp . *.exp
MT t 1 24 t
1 24
1 187 1
1 1
= T- T
Q QV V
- + YY( ) . . . exp HT t t
1 4 0 1981 16 1 2
1 16 =
+ T
Q
V
YQ
-V
+( ) . .. exp AT t t
1 4 0 120 76 1 2
0 76 =
+ T
Q
V
YQ
-V
+( ) . .. exp MT t t
1 4 0 1871 24 2
1 24
m
=
+ T
Q
V
YQ
-V
+( ) . ( )
( . )
. ( )
exp exp
HT t 0 198X t In 1 X t
1 16
0 198 1
= - T +
Q
-V
Y( ) . exp . exp . * exp .
X t t In t t
0 1981 0 198 0 198 1 0 198 1
= +
Q Q
V
+Q
-V
-Q
-Q
+VVV
( ) . ( )
( . )
. ( )
exp exp
AT t 0 12X t In 1 X t
0 76
0 12 1
= - T +
Q
-V
Y( ) . exp . exp . * exp .
X t t In t t
0 121 0 12 0 12 1 0 12 1
= +
Q Q
V
+Q
-V
-Q
-Q
+VVV
( ) . ( ) exp exp. ( . )( )
MT t 0 187X t In 1 X t
1 24
0 187 1
= - T +
Q
-V
Y( ) . exp . exp . * exp .
X t t In t t
0 1871 0 187 0 187 1 0 187 1
= +
Q Q
V
+Q
-V
-Q
-Q
+VVV
Figure 4. Protein profile of Chlorella sp. under various cultivation modes.
Figure 5. Carbohydrates profile of Chlorella sp. under various cultivation modes.
Figure 6. Lipid profile of Chlorella sp. under various cultivation modes. factors for microalgal biodiesel production (Chen et al., 2011). The lipid profiles of three microalgae isolates are presented in Figure 6. Initially, the lipid content was 13.10%. Upon subjecting to the MT mode there was a higher lipid content of 15.04% than for the other modes HT or AT modes that exhibited 14.63% and 14.42%, respectively. This might be due to the lower availability of substrate (nitrogen source), which may subject microalgae to a stress condition and thereby increase the lipid content (Mairet et al., 2011; Jian et al., 2012). Thus, the higher lipid in the mixotrophic condition (MT) might be an influence of nitrogen limitation as the C: N ratio of the microalgae cell was 106:16.
CONCLUSIONS
In this study, the mixotrophic cultivation mode of microalgae Chlorella sp. showed a better yield in growth parameters and biochemical responses than the autotrophic mode. Growth parameters were significant with nonlinear model kinetics, revealing the MT is the ideal mode of cultivation. Likewise, biochemical responses such as protein and lipids showed >1 fold increase in MT than HT and AT at the 16th day of cultivation. However, carbohydrate was higher in heterotrophic cultivation, which is due to the participation of glucose in the metabolic reaction of algae than other modes. Based on the results, the isolated microalgae species is an ideal candidate for various value added product applications under mixotrophic condition.
ACKNOWLEDGEMENTS
The authors acknowledge VIT University for providing the necessary facilities to carry out the research work.
NOMENCLATURE
μ Specific growth rate
A Maximum biomass concentration
t time
λ lag phase
ϑ shape parameter
REFERENCES
Baranyi, J., and Roberts, T.A., Mathematics of predictive food microbiology. International Journal of Food Microbiology, 26 277-294 (1995).
Bhatnagar, A., Chinnasamy, S., Singh, M., and Das, K.C., Renewable biomass production by mixotrophic algae in the presence of various carbon sources and wastewaters. Applied Energy 88 3425-3431 (2011)
Bligh, E.G., and Dyer, W.J., A rapid method for total lipid extraction and purification. Canadian Journal of Biochemistry and Physiology 37 911-917 (1959). Brennan, L., and Owende, P., Biofuels from microalgae — a review of technologies for production, processing, and extractions of biofuels and co-products. Renewable and Sustainable Energy Reviews , 14 557-577 (2010).
glycerol. Biotechnology Letters, 33 1973-1983 (2011).
Chisti, Y., Biodiesel from microalgae. Biotechnology Advances, 25 294-306 (2007).
Chojnacka, K., and Noworyta, A., Evaluation of Spirulinas p. growth in photoautotrophic, heterotrophic and mixotrophic cultures. Enzyme Microbial Technology, 34 461-465 (2004).
Endo, H., Nakajima, K., Chino, R., and Shirota, M., Growth characteristics and cellular components of Chlorella vulgaris, heterotrophic fast growing strain. Agriculture Biology and Chemistry, 38 9-18 (1974).
Perez-Garcia, O., Froylan, M.E.E., de-Bashan, L.E., and Bashan, Y., Heterotrophic cultures of microalgae: metabolism and potential products. Water research, 45 11-36 (2011).
Jiang, Y., Yoshida, T., and Antonietta, Q., Photosynthetic performance, lipid production and biomass composition in response to nitrogen limitation in marine microalgae. Plant Physiology and Biochemistry, 54 70-77 (2012).
Kirrolia, A., Bishnoi, N.R., and Singh, R., Microalgae as a boon for sustainable energy production and its future research & development aspects. Renewable and Sustainable Energy Reviews , 20 642-656 (2013).
Lee YK, Ding SY, Hoe CH, and Low CS (1996) Mixotrophic growth of Chlorella sorokiniana in outdoor enclosed photobioreactor. J. Appl. Phycol., 8, 163-169.
Li, T., Zheng, Y., Yu, L., and Chen, S., Mixotrophic cultivation of a Chlorella sorokiniana strain for enhanced biomass and lipid production. Biomass and Bioenergy, 66, 204-213(2014).
Li, Y., Horsman, M., Wu, N., and Lan, C.Q., Dubois-Calero, N., Biofuels from microalgae. Biotechnology Progress, 24 815-820 (2008).
Li, Y., Zhou, W., Hu, B., Min, M., Chen, P., and Ruan, R.R., Effect of light intensity on algal biomass accumulation and biodiesel production for mixotrophic strains Chlorella kessleri and
Chlorella protothecoides cultivated in highly concentrated municipal wastewater. Biotechnology and Bioengineering, 109 222-229 (2012).
Li, Y.Q., Horsman, M., Wang, B., Wu, N., and Lan, C.Q., Effects of nitrogen sources on cell growth and lipid accumulation of green alga
Neochloris oleoabundans. Applied Microbiology Biotechnology, 81 629-636 (2008).
Liang, Y., Sarkany, N., and Cui, Y., Biomass and lipid productivities of Chlorella vulgaris under autotrophic, heterotrophic and mixotrophic growth conditions. Biotechnology Letters , 31 1043-1049 (2009).
Liang, Y.N., Sarkany, N., and Cui, Y., Biomass and lipid productivities of Chlorella vulgaris under autotrophic, heterotrophic and mixotrophic growth conditions. Biotechnology Letters 31 1043-1049 (2009).
Liu, Z.Y., Wang, G.C., and Zhou, B.C., Effect of iron on growth and lipid accumulation in Chlorella vulgaris. Bioresource Technology , 99 4717-4722 (2008).
Lowry, O.H., Rosenbrough, N.J., Farr, A.L., and Randall, R.J., Protein measurement with the Folin phenol reagent. Journal of Biological Chemistry, 193 265-275 (1951).
Mairet, F., Bernard, O., Lacour, M.P.T., and Sciandra, A., Modelling neutral lipid production by the microalga Isochrysis aff. galbana under nitrogen limitation. Bioresource Technology , 102,142-149 (2011).
Mohamed, M.S., Tan, J.S., Kadkhodaei, S., Mohamad, R., Mokhtar, M.N., and Ariff, A.B., Kinetics and modeling of microalga Tetraselmis sp. FTC 209 growth with respect to its adaptation toward different trophic conditions. Biochemical Engineering Journal , 88, 30-41(2014).
Morgan, P.H., Mercer, L.P., and Flodin, N.W., General model for nutritional responses of higher organisms. Proceedings of the National Academy of Sciences, 72 4327-4331 (1975).
Nigam, S., Prakash Rai, M., and Sharma, R., Effect of nitrogen on growth and lipid content of Chlorella pyrenoidosa. American Journal of Biochemistry Biotechnology, 7 124-129 (2011).
Ogbonna, J.C., and Tanaka, H., Light requirement and photosynthetic cell cultivation -development of processes for efficient light utilization in photobioreactors. Journal of Applied Phycology, 12 207-218 (2000).
Pons, A., Roca, P., Aguilo, C., Garcia, F.J., Alemany, M., and Palou, A., A method for the simultaneous determination of total carbohydrate and glycerol in biological samples with the anthrone reagent. Journal of Biochemistry Biophysical Methods, 4, 227-231(1980).
waste limed fleshings and biodiesel production. Waste management, 48 638-643 (2016).
Scragg, A.H., Growth of microalgae with increased calorific values in a tubular bioreactor. Biomass and Bioenergy 23 67-73 (2002).
Shekharam, K.M., Venkataraman, L.V., and Salimath, P.V., Carbohydrate composition and characterization of two unusual sugars from the blue green alga Spirulina platensis. Phytochemistry, 26 2267-2269 (1987).
Spolaore, P., Joannis-Cassan, C., Duran, E., and Isambert, A., Commercial applications of microalgae. Journal of Bioscience Bioengineering, 101 87-96 (2006).
UTEX, BG11 Medium Composition. University of Texas Austin, USA (2009). http://web.biosci. utexas.edu/utex/mediaDetail.aspx?mediaID=26 [accessed on 22/11/2012]
Vasudevan, P.T., and Briggs, M., Biodiesel production-current state of the art and challenges. Journal of Industrial Microbiology Biotechnology, 35 421-430 (2008).