Sequential sampling of soybean and beans seeds for
Sclerotinia sclerotiorum
detection (Lib.) DeBary
1Alessandra de Lourdes Ballaris
2*, José da Cruz Machado
3,
Maria Laene Moreira de Carvalho
4, Cláudio Cavariani
2ABSTRACT- This study aimed to verify the efficiency of a sequential sampling plan for bean and soybean seeds, in the
Sclerotinia sclerotiorum detection. Firstly the heterogeneity of Pérola and Bolinha Bean cultivars lots samples and
IAC-Foscarin soybean was assessed, through H and R testing values, verifying their physiological and sanitary quality. To test the pathogen presence or absence a positive binomial distribution was used, in naturally infected seeds, and recovered by Neon-S and Roll Paper tests. The Neon-S test efficiency was obtained at different levels of infection. Statistical analysis for each test was made in DIC with four replications and the data subjected to variance analysis, and averages compared using the Tukey test (P ≤ 0.05) probability. The soybean and bean seeds sampling sequence for mycelial Sclerotinia sclerotiorum detection was
efficient, once at least 800 and 1.000 seeds are evaluated considering 0.01 and 0.005%, incidences respectively. The Neon-S and Towel Paper methods were sensitive to the Sclerotinia sclerotiorum mycelial detection in soybean and bean seeds.
Index terms: white mold, mycelial transmission, Neon-S.
Amostragem sequencial de sementes de soja e feijão na detecção de
Sclerotinia sclerotiorum
(Lib.) DeBary
RESUMO - O presente trabalho teve por objetivo verificar a eficiência de um plano de amostragem sequencial para sementes de feijão e da soja, na detecção de S. sclerotiorum. Deste modo, primeiramente foi avaliada a heterogeneidade das amostras dos lotes
para as cultivares Pérola e Bolinha de feijão e IAC-Foscarin de soja, pelos testes dos valores H e R e, verificadas a sua qualidade fisiológica e sanitária. Para testar a presença ou ausência do patógeno foi utilizada a distribuição binomial positiva, em sementes infectadas naturalmente e recuperadas pelos testes Neon-S e Rolo de Papel. A eficiência do teste Neon-S foi obtida para diferentes níveis de infecção. A análise estatística para cada teste foi feita em DIC, com quatro repetições e, os dados submetidos à análise de variância, sendo as médias comparadas pelo teste de Tukey (P ≤ 0,05) de probabilidade. O plano de amostragem sequencial de sementes de soja e de feijão para detecção de Sclerotinia sclerotiorum na forma micelial foi eficiente, desde que 800 e 1.000
sementes sejam avaliadas, considerando incidências de 0,01 e 0,005%, respectivamente. Os métodos Neon-S e Rolo de Papel foram sensíveis na detecção micelial de Sclerotinia sclerotiorum em sementes de soja e de feijão.
Termos para indexação: mofo-branco, transmissão micelial, neon-S.
Submitted on 03/18/2014. Accepted for publication on 06/17/2014. 2Departamento de Produção e Melhoramento Vegetal, UNESP, Caixa Postal 237, 18610-307 - Botucatu, SP, Brasil.
3Departamento de Fitopatologia, UFLA, Caixa Postal 3037, 37200-000 - Lavras, MG, Brasil.
4Departamento de Agricultura, UFLA, Caixa Postal 3037, 37200-000- Lavras, MG, Brasil.
*Corresponding author <[email protected]>
Introduction
The epidemics’ occurrence by the Sclerotinia sclerotiorum (Lib.) DeBary in soybean and bean cultures, in regions where favorable climatic conditions to pathogen exist, has lead to a major concern from the producers. Until the 90s the occurrence of white mold, common name of the disease caused by the respective pathogen, was restricted to
southern Brazil and sporadically in areas of central Minas Gerais and Goiás states. However, the lack of a proper care in the purchase of seeds, the use of “homemade seeds or from the black market”, arising from white mold affected areas, the lack of necessary care with processing areas, as well as the succession of susceptible crops (soy, beans, cotton) made this disease one of the major pest problems nowadays.
Every year massive economic losses are endured by
both the farmers and the seed trade, because of the white mold. According to Steadman et al. (1994), an infected seed is capable of forming more than one sclerotium, and this one, forms up to 20 apothecia and it may release 2,000,000 ascospores in the environment for each formed apothecium. The damage from the pathogen/seed association result in reductions in seedling emergence and productivity, as well as damage to the entire agricultural system, through the disease’s spread, transforming the regions unsuitable for the vegetative species growing. Therefore, the health issue, demanding the communicable diseases control by seeds is important in the agricultural production, once it refers not only to the damage caused to the seeds, but also to the economic expression of each disease (Menten, 1995).
The seed is a commercial product and to support its negotiation, seeds producers, sellers and buyers demand reliable results from analysis of their evaluation. That explains analyzes relevant procedures uniformity performed in different laboratories, by standardizing the tests to be performed in the seed quality evaluation. Once incorporated into the analysis rules, these, are periodically evaluated regarding performance, fitness, improvement or even development of new methods.
Currently, in the Seed Analysis Rules, three different methods are recommended for the Sclerotinia sclerotiorum detection in beans and soy seed lots, which are the paper towel, blotter and Neon tests. Recommended methods used in seeds’ analyzes, have precision and accuracy difficulties in getting artificially infected seeds lots, mainly because of the variability of the pathogen distribution. Therefore, studies determining the sample’s size submitted to the laboratory analysis, enabling the fungus recovery in the seeds natural infection conditions, become necessary.
In this sense, the objective of this study was to verify sequential sampling plan efficiency for bean and soybean
seeds, in the S. sclerotiorum detection.
Materials and Methods
This study was conducted at the Plant Pathology Laboratory of Camilo Castelo Branco University - Fernandópolis Campus and by UNESP-Botucatu, together with the plant pathology department of Lavras University. Commercial bean seeds of Certified Category 1 (C1), Pérola cultivar and soybean Certified Category 1 (C1), IAC Foscarin, (2012/2013 harvest), used in this experiment, were provided by the Coordination of Integral Technical Assistance (CITA) - Production Core of Fernandópolis Seeds (PC/FS) and collected by an accredited company sampler. The Pérola and Bolinha “saved seeds” bean varieties were obtained directly from producers and
came from areas with S. sclerotiorum historical incidence in
the Fernandópolis region-São Paulo state.
The seeds lots sampling were performed as per Brasil (2009), checking out the Sclerotinia sclerotiorum homogeneity, using the seeds in containers heterogeneity test (H and R-value tests). The samples from the seed lots had their physiological and sanitary profiles characterized by the Germination Speed Index (GSI), the Germination Percentage and the Filter Paper Test, as per Brasil (2009).
For physiological and sanitary quality assessment of seeds the experimental design was completely randomized with thirty treatments (single samples) and 4 replications. Statistical analyzes of the tests were performed using SISVAR computer program (Ferreira, 2000), and the averages between treatments compared by the Tukey’s test at 0.05 level of probability.
Determination of sample size required to detect Sclerotinia sclerotiorum for the seed health test
Sclerotia of S. sclerotiorum were submitted to surface disinfection with a 1% sodium hypochlorite solution for 5 minutes, then washed three times in distilled water and transferred to Petri plates containing medium PDA (Potato 200 g, dextrose 20 g and agar / liter 20 g).
The plates were kept in an incubation chamber at 20 ± 2 °C temperature, in the dark for seven days. 9 mm diameter disks cut from growing colonies borders, were transferred to Petri plates containing PDA and incubated at the same conditions previously reported, for a period of five to seven days, obtaining pure cultures (Botelho et al., 2013).
Pure cultures of S. sclerotiorum were transferred to Petri plates containing half PDA and incubated in environmental chamber temperature at 20 ± 2 ºC for seven days and 12 hours photoperiod. Afterwards, the seeds were placed in monolayer over the fungus culture and kept in the dark for 48 hours, as described by Botelho et al. (2013).
Evaluation of the Neon test sensitivity in the S. sclerotiorum recovery in artificially inoculated seeds
To check the test sensitivity, samples of Pérola cultivars bean and soybean seeds (“saved”), Pérola (commercial) and Bolinha (“saved”) were inoculated with infected seeds in the ratio of 1/100, 1/200 1/300...1/1000 respectively, the number of infected seeds varying from 1 to 10 and submitted to the Neon testing as previously described.
The experimental design was completely randomized, with four replications. Data were subjected to variance analysis and the treatment averages were compared using the Tukey test (P ≥ 0,05) probability level.
Determination of the S. sclerotiorum sample size
Sequential sampling was used to determine the number of seeds required to accurately verify the lot infestation by S. sclerotiorum. For the pathogen detection the NEON test was used as previously described, on natural and artifi cially infected seeds, the last one in the proportion of 1/100 to 1/1000 seeds, thereby obtaining the lot infection levels ranging from 0,01 to 0,001%, respectively.
The type I (α) and type II (β) errors, were pre-set at 5%, and percentages of maximum (p1) and minimum (po) infections by S. sclerotiorum in bean and soybean seeds, at 1 and 0,5%, respectively, for they were compatible with tolerance standards recommended for this phytopathogenic agent, the Sclerotinia sclerotiorum.
Formulas of the Sequential Probability Ratio Test (SPRT) by Wald (1947), adapted by Santana (1994), were used in the experiment for the upper and lower limit, li = b + an e ls = c + an, respectively, where:
The sample average size may be obtained from the formula where:
and .
Results and Discussion
Determination of the lot heterogeneity
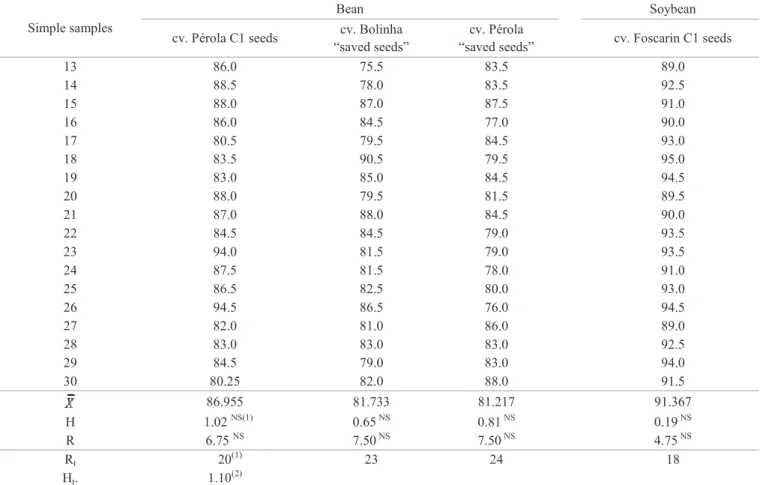
The results determining the beans and soy lots’ heterogeneity concerning the germination percentage are shown in Table 1.
The H lots test values, for simple samples were 1.02, 0.81, 0.65 and 0.19 for bean cultivars, Pérola (C1 seeds), Pérola (“saved seeds”) and Bolinha (“saved seeds”), and soybean cultivar IAC-Foscarin (C1 seeds), respectively, while the H tabulated value to check the lots heterogeneity at 1% level of probability is 1.10 (Brasil, 2009). The R test value showed regarding the germination test category at 1% probability and maximum amplitudes tolerated, values of 20, 24, 23 and 18 which were also the respective results for bean seeds, Pérola (C1 seeds), Pérola (“saved seeds”) and Bolinha (“saved seeds”), and soybean Foscarin cultivar (C1 seeds).
The analytical results of the heterogeneity verifi cation of species and cultivars lots showed that they should be considered non heterogeneous, based on the normal seedlings percentage in the germination test, due to the lack of signifi cance of H and
R tests values. Therefore, as lots have similar characteristic
attributes, they can be used for standardized analyzes in laboratory, according to Brasil (2009).
In Table 2 are showed physiological qualitative data of C1 certifi ed soybean and bean seeds and “saved seeds” used in the research. Cv. Pérola C1 bean seeds, had superior germination and vigor (IVG) compared to Pérola and Bolinha “saved seeds”, where no statistical difference between them was verifi ed.
( )
( )
( )
Table 1. Normal seedlings percentage in the germination test to check the bean and soybean seed lots heterogeneity.
Simple samples
Bean Soybean
cv. Pérola C1 seeds “saved seeds”cv. Bolinha “saved seeds”cv. Pérola cv. Foscarin C1 seeds
1 87.0 81.5 74.0 92.0
2 87.5 82.0 73.0 90.5
3 90.0 77.0 86.5 90.0
4 95.5 76.5 79.0 91.5
5 89.5 85.0 80.0 89.5
6 89.5 80.5 78.0 95.0
7 88.5 80.5 78.0 91.0
8 87.5 82.0 76.5 86.5
9 86.5 77.0 77.0 88.5
10 85.5 78.0 74.0 91.5
11 86.5 76.5 80.0 85.5
12 87.5 86.5 80.0 92.5
13 86.0 75.5 83.5 89.0
14 88 5 78 0 83 5 5
15 88 0 87 0 87 5 91 0
16 86 0 84 5 77 0 90 0
17 80 5 79 5 84 5 0
18 83 5 90 5 79 5 95 0
19 83 0 85 0 84 5 5
20 88 0 79 5 81 5 89 5
21 87 0 88 0 84 5 90 0
84 5 84 5 79 0 5
0 81 5 79 0 5
87 5 81 5 78 0 91 0
25 86 5 82 5 80 0 0
26 5 86 5 76 0 5
27 82 0 81 0 86 0 89 0
28 83 0 83 0 83 0 5
84 5 79 0 83 0 0
30 80 25 82 0 88 0 91 5
86 955 81 733 81 217 91 367
H 1 02NS(1) 0 65NS 0 81NS 0 19NS
6 75 NS 7 50NS 7 50NS 75NS
continuation....
continuation....
Simple samples
Bean Soybean
cv. Pérola C1 seeds “saved seeds”cv. Bolinha “saved seeds”cv. Pérola cv. Foscarin C1 seeds
13 86.0 75.5 83.5 89.0
14 88.5 78.0 83.5 92.5
15 88.0 87.0 87.5 91.0
16 86.0 84.5 77.0 90.0
17 80.5 79.5 84.5 93.0
18 83.5 90.5 79.5 95.0
19 83.0 85.0 84.5 94.5
20 88.0 79.5 81.5 89.5
21 87.0 88.0 84.5 90.0
22 84.5 84.5 79.0 93.5
23 94.0 81.5 79.0 93.5
24 87.5 81.5 78.0 91.0
25 86.5 82.5 80.0 93.0
26 94.5 86.5 76.0 94.5
27 82.0 81.0 86.0 89.0
28 83.0 83.0 83.0 92.5
29 84.5 79.0 83.0 94.0
30 80.25 82.0 88.0 91.5
86.955 81.733 81.217 91.367
H 1.02 NS(1) 0.65 NS 0.81 NS 0.19 NS
R 6.75 NS 7.50NS 7.50NS 4.75NS
Rt 20(1) 23 24 18
Ht. 1.10(2)
NSNot signifi cant, (1)R tabulated values (Brasil, 2009), (2)H tabulated values (Brasil, 2009).
Table 2. Average values obtained in preliminary determinations evaluating bean and soybean seeds physiological quality.
Cultivars Germination %* IVG
Bean-cv. Pérola-seeds C1 86.95 a** 8.39 a Bean-cv. Bolinha-“saved seeds” 81.73b 7.85 b Bean-cv. Pérola-“saved seeds” 81.22 b 7.59 b
F 0.15 0.58
CV (%) 2.05 4.03
Soya-cv. IAC Foscarin-seeds C1 91.37 8.77
F 0.20 0.71
CV (%) 1.37 3.48
*Transformed data; **Averages with the same letter in the column do not differ by the Tukey test with 5% probability.
Signifi cant differences between bean seeds lots reveal the importance of using commercial seed for crops development instead of using “saved seeds”. Successive plantings of seeds from the same origin (“saved seeds”) cause productivity losses by the gradual quality reduction, both genetic and physiological, as well as increased impurities occurrence
of microorganisms and varietal mixtures, with damages to producers, consumers as well as to the environment.
The results from the seed quality analysis of IAC-Foscarin soybean cultivar (Chart 2) show high quality, clearly pointing out the fundamental importance of using seeds of known origin, culminating with the plants population establishment required to grow, greater emergence and plant development speed, culminating rapidly in closed canopy, which also results in the weeds effi cient control and contributes to high levels of productivity.
The bean crop, according to Menten (1995) and Machado (2000), is subject to a wide pathogens variety, most of which have negative effects on the seeds physiological quality produced, and the inoculums present in them, may result in the increase of fi eld diseases and its introduction in pathogens free areas. The results of the lots’ health analysis revealed by the fi lter-paper incubation method are shown in Table 3. Clearly, the C1 category pathogens incidence was smaller in commercial seeds, compared to those observed in “saved seeds” not affecting the seeds quality.
Fungi recovered from IAC-Foscarin cultivar C1 soybean seeds are coincident to those reported by Braccini et al. (2000),
Machado (2000), Goulart (2005), Henning (2009), Henneberg et al. (2012), Sousa et al. (2011), Barros and Juliatti (2012) as the most common gender in soybean seeds. These species infect the seeds internally or externally, being responsible in
most cases for poor seed germination and, as a consequence, the soybean production reduced physiological quality, emphasizing however that the pathogens’ incidence transmitted by these seeds are within tolerable levels.
Table 3. Fungi incidence percentage in bean and soybean seeds.
Fungi/Bean cv. Pérola seeds C1 cv. Pérola “saved seeds ” cv. Bolinha “saved seeds ”
Phoma spp. 0 1 0.5
Fusarium spp. 0.25 2 1
Aspergillusspp. 2 13.5 9.75
Penicilliumspp. 3 5 8.5
Rhizopusspp. 6 11 7.75
Fungi/Soybean cv. Foscarin – seeds
Colletotrichum truncatum 0
Phomopsis sojae 5
Fusariumspp. 1.75
Aspergillus spp. 0.75
Penicilliumspp. 6
Testing the presence - absence hypothesis of pathogen in the lot The results obtained in this study concerning natural seed infection by Neon-S test (Table 4) for bean cultivars (0,25% samples -12 cv. Pérola, “saved seeds”) and by the Towel paper method (0,25%, samples 19 and 26 cv. Pérola, “saved seeds”) is according to those found by Hoffman et al. (1998), Nasser et al. (1999), Parisi et al. (2006), Henning (2009), Botelho et al. (2013) and Henneberg et al. (2012), which means, low levels of the pathogen recovery (0,25 to 2%) by the detection
traditional methods.
Differences in pathogen incidence and seeds recovery observed in literature may be due to various intrinsic and extrinsic factors to the seed, as per Yorinori (1982) and Machado (2000), and by the sample’s lack of precision, according to Carvalho et al. (2011).
The mycelial form of S. sclerotiorum detection verified in this work is of utmost importance, for it features the contamination in seeds that should be discarded, however, these are reused by the producer in the next crop, leveraging the infected area increase within the property, or other producing areas due to the illegal sale of the “saved seeds”.
As a reminder, Steadman et al. (1994), correlating the link action of this pathogen to seeds with potential future damages in production fields, noted that this could yield 2,000,000 ascospores approximately (initial inoculums) through the sclerotium germination attached or mixed to them.
Nasser et al. (1999) also pointed out that one infected seed only is able to give 625 primary outbreaks of the disease in a 250,000 plants/ha field, thus highlighting the problem of the illegal seeds trade and the use of “saved seeds” by the producers.
According to Table 5, the Neon-S test found sensitivity to the presence of the S. sclerotiorum pathogen, detected on 100% of artificially infected seeds, regardless the proportion used, fact that confirms the effectiveness of this semi-selective medium regarding its goal. Similar results were observed by other authors, however without differentiation of the infection level (Napoleão et al., 2006; Henneberg et al., 2012; Botelho et al., 2013). The method ability to acknowledge the pathogen’s presence in seeds low percentages of infection, is on its own, relevant. However, the verified data of naturally infected seeds are very small compared to those seen in artificially inoculated seeds; in these ones, the Neon test is always sensitive.
According to ISTA (2013), the lack of due care when sampling and during sample handling in the laboratory is the main factor to determine errors and discrepancies
in seed health analyzes results. Therefore, the traditional
sampling of seed lots infected by fungi, such as S. sclerotiorum, may not be representative and may indicate a lot as uninfected, when in reality it is infected by the pathogen (Henning et al., 2009).
Table 4. Percentage of seeds infected by Sclerotinia sclerotiorum in bean and soybean seeds using two detection tests.
NEON-S PAPER ROLL
Simple
Sample cv. Pérola C1 seeds
cv. Bolinha
“saved seeds”
cv. Pérola
“saved seeds”
cv. Foscarin
C1 seeds cv. Pérola C1 seeds
cv. Bolinha
“saved seeds”
cv. Pérola
“saved seeds”
cv. Foscarin C1 seeds
1 0NS 0NS 0NS* 0NS 0NS 0NS 0NS 0NS
2 0 NS 0 NS 0 NS 0 NS 0 NS 0 NS 0 NS 0 NS
3 0 NS 0 NS 0 NS 0 NS 0 NS 0 NS 0 NS 0 NS
4 0NS 0NS 0 NS 0NS 0NS 0NS 0NS 0NS
5 0 NS 0 NS 0NS 0 NS 0 NS 0 NS 0 NS 0 NS
6 0 NS 0 NS 0 NS 0 NS 0 NS 0 NS 0 NS 0 NS
7 0NS 0NS 0 NS 0NS 0NS 0NS 0NS 0NS
8 0 NS 0 NS 0 NS 0 NS 0 NS 0 NS 0 NS 0 NS
9 0NS 0NS 0NS 0NS 0NS 0NS 0NS 0NS
10 0 NS 0 NS 0 NS 0 NS 0 NS 0 NS 0 NS 0 NS
11 0NS 0NS 0NS 0NS 0NS 0NS 0NS 0NS
12 0 NS 0 NS 0.25NS 0 NS 0 NS 0 NS 0 NS 0 NS
13 0NS 0NS 0NS 0NS 0NS 0NS 0NS 0NS
14 0 NS 0 NS 0 NS 0 NS 0 NS 0 NS 0 NS 0 NS
15 0NS 0NS 0NS 0NS 0NS 0NS 0NS 0NS
16 0NS 0NS 0NS 0NS 0NS 0NS 0NS 0NS
17 0 NS 0 NS 0 NS 0 NS 0 NS 0 NS 0 NS 0 NS
18 0 NS 0 NS 0 NS 0 NS 0 NS 0 NS 0 NS 0 NS
19 0NS 0NS 0NS 0NS 0NS 0NS 0.25 NS 0NS
20 0 NS 0 NS 0 NS 0 NS 0 NS 0 NS 0NS 0 NS
21 0 NS 0 NS 0 NS 0 NS 0 NS 0 NS 0 NS 0 NS
22 0NS 0NS 0NS 0NS 0NS 0NS 0 NS 0NS
23 0 NS 0 NS 0 NS 0 NS 0 NS 0 NS 0 NS 0 NS
24 0NS 0NS 0NS 0NS 0NS 0NS 0NS 0NS
25 0 NS 0 NS 0 NS 0 NS 0 NS 0 NS 0 NS 0 NS
26 0 NS 0 NS 0 NS 0 NS 0 NS 0 NS 0.25 NS 0 NS
27 0 NS 0 NS 0 NS 0 NS 0 NS 0 NS 0 NS 0 NS
28 0NS 0NS 0NS 0NS 0NS 0NS 0NS 0NS
29 0 NS 0 NS 0 NS 0 NS 0 NS 0 NS 0 NS 0 NS
30 0NS 0NS 0NS 0NS 0NS 0NS 0NS 0NS
*NS not significant by the Tukey test with 5% probability.
Table 5. Sensitivity evaluation of the Neon test for Sclerotinia sclerotiorum detection at different incidence rates.
Cultivars Nr. of seeds
Recovery percentage of infected seeds Number of inoculated seeds
0 1 2 3 4 5 6 7 8 9 10
cv. Pérola C1 seeds
100 0 NS 100 NS 100 NS 100 NS 100 NS 100 NS 100 NS 100 NS 100 NS 100 NS 100 NS 200 0 NS 100 NS 100 NS 100 NS 100 NS 100 NS 100 NS 100 NS 100 NS 100 NS 100 NS 300 0 NS 100 NS 100 NS 100 NS 100 NS 100 NS 100 NS 100 NS 100 NS 100 NS 100 NS 400 0 NS 100 NS 100 NS 100 NS 100 NS 100 NS 100 NS 100 NS 100 NS 100 NS 100 NS 500 0NS 100NS 100NS 100NS 100NS 100NS 100NS 100NS 100NS 100NS 100NS 600 0 NS 100 NS 100 NS 100 NS 100 NS 100 NS 100 NS 100 NS 100 NS 100 NS 100 NS 700 0NS 100NS 100NS 100NS 100NS 100NS 100NS 100NS 100NS 100NS 100NS 800 0 NS 100 NS 100 NS 100 NS 100 NS 100 NS 100 NS 100 NS 100 NS 100 NS 100 NS 900 0 NS 100 NS 100 NS 100 NS 100 NS 100 NS 100 NS 100 NS 100 NS 100 NS 100 NS 1000 0 NS 100 NS 100 NS 100 NS 100 NS 100 NS 100 NS 100 NS 100 NS 100 NS 100 NS
“ ”
100 0 NS 100 NS 100 NS 100 NS 100 NS 100 NS 100 NS 100 NS 100 NS 100 NS 100 NS 200 0NS 100NS 100NS 100NS 100NS 100NS 100NS 100NS 100NS 100NS 100 NS 300 0NS 100NS 100NS 100NS 100NS 100NS 100NS 100NS 100NS 100NS 100 NS 400 0NS 100NS 100NS 100NS 100NS 100NS 100NS 100NS 100NS 100NS 100NS 500 0NS 100NS 100NS 100NS 100NS 100NS 100NS 100NS 100NS 100NS 100 NS 600 0NS 100NS 100NS 100NS 100NS 100NS 100NS 100NS 100NS 100NS 100 NS 700 0NS 100NS 100NS 100NS 100NS 100NS 100NS 100NS 100NS 100NS 100 NS 800 0NS 100NS 100NS 100NS 100NS 100NS 100NS 100NS 100NS 100NS 100 NS 900 0NS 100NS 100NS 100NS 100NS 100NS 100NS 100NS 100NS 100NS 100 NS 1000 0NS 100NS 100NS 100NS 100NS 100NS 100NS 100NS 100NS 100NS 100 NS
cv. Pérola
“ ”
100 0NS* 100NS 100NS 100NS 100NS 100NS 100NS 100NS 100NS 100NS 100 NS 200 0NS 100NS 100NS 100NS 100NS 100NS 100NS 100NS 100NS 100NS 100 NS 300 0NS 100NS 100NS 100NS 100NS 100NS 100NS 100NS 100NS 100NS 100 NS 400 0NS 100NS 100NS 100NS 100NS 100NS 100NS 100NS 100NS 100NS 100 NS 500 0NS 100NS 100NS 100NS 100NS 100NS 100NS 100NS 100NS 100NS 100 NS 600 0NS 100NS 100NS 100NS 100NS 100NS 100NS 100NS 100NS 100NS 100 NS 700 0NS 100NS 100NS 100NS 100NS 100NS 100NS 100NS 100NS 100NS 100 NS 800 0NS 100NS 100NS 100NS 100NS 100NS 100NS 100NS 100NS 100NS 100 NS 900 1NS 100NS 100NS 100NS 100NS 100NS 100NS 100NS 100NS 100NS 100 NS 1000 0NS 100NS 100NS 100NS 100NS 100NS 100NS 100NS 100NS 100NS 100NS
C1 seeds
100 0N 100NS 100NS 100NS 100NS 100NS 100NS 100NS 100NS 100NS 100 NS 200 0NS 100NS 100NS 100NS 100NS 100NS 100NS 100NS 100NS 100NS 100 NS 300 0NS 100NS 100NS 100NS 100NS 100NS 100NS 100NS 100NS 100NS 100 NS 400 0NS 100NS 100NS 100NS 100NS 100NS 100NS 100NS 100NS 100NS 100 NS 500 0NS 100NS 100NS 100NS 100NS 100NS 100NS 100NS 100NS 100NS 100NS 600 0NS 100NS 100NS 100NS 100NS 100NS 100NS 100NS 100NS 100NS 100 NS 700 0NS 100NS 100NS 100NS 100NS 100NS 100NS 100NS 100NS 100NS 100 NS 800 0NS 100NS 100NS 100NS 100NS 100NS 100NS 100NS 100NS 100NS 100 NS 900 0NS 100NS 100NS 100NS 100NS 100NS 100NS 100NS 100NS 100NS 100NS 1000 0NS 100NS 100NS 100NS 100NS 100NS 100NS 100NS 100NS 100NS 100 NS
continuation....
Cultivars Nr. of seeds
Recovery percentage of infected seeds Number of inoculated seeds
0 1 2 3 4 5 6 7 8 9 10
cv. Bolinha “saved seeds”
100 0 NS 100 NS 100 NS 100 NS 100 NS 100 NS 100 NS 100 NS 100 NS 100 NS 100 NS 200 0 NS 100 NS 100 NS 100 NS 100 NS 100 NS 100 NS 100 NS 100 NS 100 NS 100 NS 300 0 NS 100 NS 100 NS 100 NS 100 NS 100 NS 100 NS 100 NS 100 NS 100 NS 100 NS 400 0 NS 100 NS 100 NS 100 NS 100 NS 100 NS 100 NS 100 NS 100 NS 100 NS 100 NS 500 0 NS 100 NS 100 NS 100 NS 100 NS 100 NS 100 NS 100 NS 100 NS 100 NS 100 NS 600 0 NS 100 NS 100 NS 100 NS 100 NS 100 NS 100 NS 100 NS 100 NS 100 NS 100 NS 700 0 NS 100 NS 100 NS 100 NS 100 NS 100 NS 100 NS 100 NS 100 NS 100 NS 100 NS 800 0 NS 100 NS 100 NS 100 NS 100 NS 100 NS 100 NS 100 NS 100 NS 100 NS 100 NS 900 0 NS 100 NS 100 NS 100 NS 100 NS 100 NS 100 NS 100 NS 100 NS 100 NS 100 NS 1000 0NS 100NS 100NS 100NS 100NS 100NS 100NS 100NS 100NS 100NS 100NS
cv. Pérola “saved seeds”
100 0 NS* 100 NS 100 NS 100 NS 100 NS 100 NS 100 NS 100 NS 100 NS 100 NS 100 NS 200 0 NS 100 NS 100 NS 100 NS 100 NS 100 NS 100 NS 100 NS 100 NS 100 NS 100 NS 300 0 NS 100 NS 100 NS 100 NS 100 NS 100 NS 100 NS 100 NS 100 NS 100 NS 100 NS 400 0 NS 100 NS 100 NS 100 NS 100 NS 100 NS 100 NS 100 NS 100 NS 100 NS 100 NS 500 0 NS 100 NS 100 NS 100 NS 100 NS 100 NS 100 NS 100 NS 100 NS 100 NS 100 NS 600 0 NS 100 NS 100 NS 100 NS 100 NS 100 NS 100 NS 100 NS 100 NS 100 NS 100 NS 700 0NS 100NS 100NS 100NS 100NS 100NS 100NS 100NS 100NS 100NS 100NS 800 0 NS 100 NS 100 NS 100 NS 100 NS 100 NS 100 NS 100 NS 100 NS 100 NS 100 NS 900 1NS 100NS 100NS 100NS 100NS 100NS 100NS 100NS 100NS 100NS 100NS 1000 0 NS 100 NS 100 NS 100 NS 100 NS 100 NS 100 NS 100 NS 100 NS 100 NS 100 NS
cv. Foscarin C1 seeds
100 0 NS 100 NS 100 NS 100 NS 100 NS 100 NS 100 NS 100 NS 100 NS 100 NS 100 NS 200 0NS 100NS 100NS 100NS 100NS 100NS 100NS 100NS 100NS 100NS 100NS 300 0 NS 100 NS 100 NS 100 NS 100 NS 100 NS 100 NS 100 NS 100 NS 100 NS 100 NS 400 0 NS 100 NS 100 NS 100 NS 100 NS 100 NS 100 NS 100 NS 100 NS 100 NS 100 NS 500 0 NS 100 NS 100 NS 100 NS 100 NS 100 NS 100 NS 100 NS 100 NS 100 NS 100 NS 600 0NS 100NS 100NS 100NS 100NS 100NS 100NS 100NS 100NS 100NS 100NS 700 0 NS 100 NS 100 NS 100 NS 100 NS 100 NS 100 NS 100 NS 100 NS 100 NS 100 NS 800 0 NS 100 NS 100 NS 100 NS 100 NS 100 NS 100 NS 100 NS 100 NS 100 NS 100 NS 900 0 NS 100 NS 100 NS 100 NS 100 NS 100 NS 100 NS 100 NS 100 NS 100 NS 100 NS 1000 0 NS 100 NS 100 NS 100 NS 100 NS 100 NS 100 NS 100 NS 100 NS 100 NS 100 NS
continuation....
* NS= Not significant by the Tukey test with 5% probability.
Determination of the sample size required to detect Sclerotinia sclerotiorum on a seed health test
The lower (li ) and upper limits (ls) for each group of 100 sampled seeds (n), are presented in Table 6 and Figure 1, obtained through the formulas li= - 4,21728 + 0,007216n = ls 4.21728 + 0.007216n. In it, one can observe that the minimum analyzed number of seeds must be 700, regarding the pathogen presence-absence in seed lots, observing the value ranges, in order to determine the lot’s destination.
On Table 7 and Figures 1 and 2, it can be seen that the traditional pathological analysis of 400 seeds is insufficient to
determine the lots free of S. sclerotiorum, being necessary to analyze 848 seeds for an average of 0,005 infections. By the sequential sampling results (Table 8), was demonstrated that
this number is insufficient for the S. sclerotiorum recovery,
as in the Neon test it took 8 consecutive shots of 100 seeds before the decision of the lot’s destination.
The actual sample size for health tests, according to Carvalho et al. (2011), depends on the pathogen occurrence frequency in the seeds. Works that determine the sample actual size for fungi detection in routine analysis are rare and, regarding specificallythe S. sclerotiorum, they are nonexistent.
Having in mind that this pathogen is monocyclic, and therefore has a low rate of infection and sporulation compared to other seed fungal contaminants, it is relevant to prove that it requires a higher number of seeds than the 400 standardized seeds only, for their detection in routine tests, avoiding consequently false negative results.
Table 6. Calculated values of the sequential sampling plan decision boundaries for p0=0,01, p1=0,005 and α = β=5% for seeds groups size m=100.
Number of groups of tested seeds Total number of seeds Lower Limit Upper limit
1 100 ND* 5
2 200 ND 6
3 300 ND 6
4 400 ND 7
5 500 ND 8
6 600 ND 9
7 700 ND 9
8 800 1 10
9 900 2 11
10 1000 3 12
*= Not determined.
Figure 1. Decision lines of the sequential sampling plan with parameters p0 = 0,005; p1= 0.01 and α=β = 0.05. 0
2 4 6 8 10 12 14
100 200 300 400 500 600 700 800 900 1000
N
umbe
r of
se
eds
inf
ec
te
d
Sample size (n)
Lot acception
Table 7. Average sample size (ASS) according to values assigned to W in the range of -6 to 6.
W p P(p) ASS (p)
-6 0.0879 0.0000 47.9 -5 0.0750 0.0000 56.3 -4 0.0623 0.0000 67.7 -3 0.0503 0.0001 83.8
-2 0.0393 0.0028 107.3
-1 0.0296 0.0500 142.7
1 0.0148 0.9500 285.4
2 0.0098 0.9972 429.1
3 0.0063 0.9999 670.2
3.5 0.0050 1.0000 848.4
4 0.0039 1.0000 1082.5
5 0.0023 1.0000 1800.4
6 0.0014 1.0000 3069.0
0,0 100,0 200,0 300,0 400,0 500,0 600,0 700,0 800,0 900,0
0,0049 0,0149 0,0249 0,0349 0,0449 0,0549 0,0649 0,0749 0,0849 0,0949
Sa
mpl
e`
s a
ve
ra
ge
siz
e
E(
n)
Seeds infection percentage in the lot (p)
Figure 2. Curve of the average sample size of the sequential sampling plan for parameters p0= 0.005; p1 =0.01
and α = β = 5%.
In accordance with Henning et al. (2009), who found eight seeds infected by Sclerotinia sclerotiorum only in a lot
of 10.400 seeds, in other words, 0,076% pathogen infection, the result obtained for this study’s sample size indicates that a minimum of 1.000 seeds, and not more than 10,000, are to be analyzed when one wants to find 1 infected seed in the lot.
The TSRP reliability, concerning routine testing used in seed pathology laboratory, is given by the Operating Characteristic
Curve OCC (p) (Figure 3) (Bányai and Barabás, 2002), cited by Santana (1994).
One can see that lots averaging 1% of S. sclerotiorum infection have a 95% chance of being rejected; on the other hand, the probability of a seed infected in the lot with fungus at its surface or its inner integument tissues and not detected by the test, is on average 0,5%.
One should have in mind that the infection determination
of a lot is done through standardized tests recommended by the Seeds Review Rules (Brasil, 2009), the sequential sampling being responsible for establishing if this infection level for this agent lies within the levels of tolerance suggested. As
Lot rejection
Sampling curve
per Santana’s (1994) recommendation, one should use its maximum value for the expected sample average size in order to obtain a reliable decision on the pathogen presence-absence, ensuring the lots health quality to the producer and consumer.
The average sample size determination is the first step in
the search for detection adequate methods, targeting efficiency for decision making on the lots’ destination, ensuring health quality to the seeds producer and consumer, restricting as well the pathogen spread on free environmental areas and reducing the inoculums potential, where the disease already exists.
Table 8. Number of seeds needed in the sequential sampling plan for the lot acceptation or rejection decision, due to Sclerotinia sclerotiorum presence in bean and soybean seed.
Lots Total of seeds tested Total of seeds with S. sclerotiorum Results
Na
tu
ra
lly
In
fe
cted
cv. Pérola C1 seeds 1000 0 Accepted
cv. Bolinha “saved seeds” 1000 0 Accepted
cv. Pérola “saved seeds” 800 1 Rejected
cv. Foscarin C1seeds 1000 0 Accepted
Artifi
cially
In
fe
cted
:100 100 1
1:200 200 1
1:300 200 1
1:400 300 1
1:500 300 1
1:600 500 1
1:700 700 1
1:800 800 1
1:900 900 1
1:1000 1000 1
0,0 0,2 0,4 0,6 0,8 1,0 1,2
0,00 0,02 0,04 0,06 0,08 0,10
C
C
O (
p)
P average
Figure 3. Operation characteristic curve CCO (p) of the likelihood test of Sclerotinia sclerotiorum total population.
Conclusions
The sampling sequence of soybean and bean seeds for
mycelial Sclerotinia sclerotiorum detection was efficient, once 800 and 1,000 seeds were evaluated, with incidences of 0,01 and 0,005%, respectively;
The Neon and paper towel methods were sensitive in the
mycelial Sclerotinia sclerotiorum detection in soybean and bean seeds.
References
BÁNYAI, J.; BARABÁS, J. Handbook on statistics in seed testing. Association International of Seed Testing, 2002. 84p. Available at <http:// www.world-seed-project.org/upload/prj/product/stahandbk2002.pdf> Accessed on: Nov. 17th, 2013.
BARROS, F. C.; JULIATTI, F. C. Levantamento de fungos em amostras recebidas no laboratório de micologia e proteção de plantas da Universidade Federal de Uberlândia no período 2001-2008. Bioscience Journal, v.28, n.1, p.77-86, 2012.
http://www.seer.ufu.br/index.php/biosciencejournal/issue/view/707
BRACCINI, A. L.; REIS, M. S.; BRACCINI, M. C. L.; SCAPIM, C.A.; MOTTA, I. SÁ. Germinação e sanidade de sementes de soja (Glycine max (L.) Merrill) colhidas em diferentes épocas. Acta Scientiarum, v.22, n.4, p.1017-1022, 2000. http://periodicos.uem.br/ojs/index.php/ActaSciAgron/ article/view/2868/2047
BRASIL. Ministério da Agricultura, Pecuária e Abastecimento. Regras para análise de sementes. Ministério da Agricultura, Pecuária e Abastecimento. Secretaria de Defesa Agropecuária. Brasília: MAPA/ACS, 2009. 395p. http:// www.agricultura.gov.br/arq_editor/file/2946_regras_analise__sementes.pdf
BOTELHO, L. S.; ZANCAN, W. L. A.; MACHADO, J. C.; BARROCAS, E. N. Performance of common bean seeds infected by the fungus Sclerotinia sclerotiorum. Journal of Seed Science, v.35, n.2, p.153-160, 2013. http:// www.scielo.br/pdf/jss/v35n2/03.pdf
CARVALHO, M.L.M.; VON PINHO, E.V.R.; OLIVEIRA, J.A.; GUIMARÃES, R.M.; MUNIZ, J.A. Manual do amostrador de sementes. Lavras-MG, 2011. 143 p.
FERREIRA, D. F. Análises estatísticas por meio do SISVAR for Windows version 4.0. http://www.dex.ufla.br/~danielff/softwares.htm Lavras: UFLA, 2000. 72p.
GOULART, A.C.P. Fungos em sementes de soja: detecção, importância e controle. Dourados: EMBRAPA AGROPECUARIA OESTE, 2005. 72p.
HENNEBERG, L.; GRABICOSKI, E. M. G.; JACCOUD-FILHO, D. S.; PANOBIANCO. M. Incidência de Sclerotinia sclerotiorum em sementes de soja e sensibilidade dos testes de detecção. Pesquisa Agropecuária Brasileira, v.47, n.6, p.763-768, 2012. http://www.scielo.br/pdf/pab/v47n6/47n06a05.pdf
HENNING, A.A. Manejo de doenças da cultura da soja (Glycine max L. Merrill). Informativo ABRATES, v.19, n.1, p.9-12, 2009.
HENNING, A.A.; PAULA, F.Y.H.; MOMTEMEZZO, C.A.O.; BOSSE, E.J.; BERGONSI, J.S.S. Avaliação de princípios ativos para o controle químico de mofo branco (Sclerotinia sclerotiorum) em soja – safra 2008/2009. Informativo ABRATES, v.19, n.1, p.29-31, 2009.
HOFFMAN, D. D.; HARTMAN, G. L.; MUELLER, D.M.; LEITZ, R. A.; NICKELL, C. D.; PEDERSEN, W. L. Yield and seed quality of soybean cultivars infected with Sclerotinia sclerotiorum. Plant Disease, v.82, p.826-829, 1998. http://apsjournals.apsnet.org/doi/pdf/10.1094/PDIS.1998.82.7.826.
ISTA- INTERNATIONAL SEED TESTING ASSOCIATION. Method Validation for seed testing. Switzerland, 2007. 70p. Available at: <http://www. seed test. org /upload/ cms/ user/ ISTAMethodValidationforSeedTesting - v1.01.pdf > Accessed on May. 30th 2013.
MACHADO, J.C. Patologia de sementes: significado e atribuições. In: CARVALHO, N.M. E NAKAGAWA, J. (Eds.). Sementes: ciência, tecnologia e produção. Jaboticabal: FUNEP, 2000. p.522-588.
MENTEN, J. O. M. Prejuízo causado por patógenos associados às sementes. In: MENTEN, J.O.M. Patógenos em sementes:detecção, danos e controle químico.
São Paulo: Ciba Agro, 1995. p.115-136.
NAPOLEÃO, R.; NASSER, L.C.B.; LOPES, C.A.; C.A.F‚ FILHO, A.C. Neon-S, a new medium for detection of Sclerotinia sclerotiorum on seeds. Summa Phytopathologica, v. 32, n.2, p. 180-182, 2006. http://www.scielo.br/ pdf/sp/v32n2/v32n2a14.pdf
NASSER, L. C. B.; CAFE FILHO, A. C.; AZEVEDO, J. A.; GOMES, A. C.; VIVALDI, L. J.; ALBRETCH, J. C.; FREITAS, M. A.; KARL, A. C.; FERRAZ, L. L. C.; MEDEIROS, R. G.; CARVAJAL, R. A.; NAPOLEAO, R. L.; JUNQUEIRA, N. T. V. Metodo alternativo para o manejo do cancro-da-haste da soja (Diaphorte phaseolorum f. sp. meridionalis) e mofo-branco do feijoeiro (Sclerotinia sclerotiorum) em sistemas de produção de grãos do Cerrado. Embrapa Cerrados- Comunicado Tecnico, n.11, p.4, 1999.
PARISI, J.J.D.; PATRÖCIO, F.R.A., OLIVEIRA, S.H.F. Modification of the paper towel seed health test for the detection of Sclerotinia sclerotiorum in bean seeds (Phaseolus vulgaris L.). Summa Phytopathologica, v.32, n.3, p.288-290, 2006. ttp://www.scielo.br/pdf/sp/v32n3/a15v32n3.pdf
SANTANA, D. G. Adaptação do teste do pH do exsudato e viabilidade do uso da amostragem sequencial na rápida definição sobre o destino de lotes de sementes de milho (Zea mays L.). Lavras:UFLA. 1994. 79p.
SOUSA, T. P.; NASCIMENTO, I. O.; MAIA. C. B.; MORAIS, J.; BEZERRA, G. A.; BEZERRA, J. W. T. Incidência de fungos associados a sementes de soja transgênica variedade BRS Valiosa RR. Agroecossistemas, v.3, n.1, p. 52-56, 2011.
STEADMAN, J.R.; MARCINKOWSKA, J.; RUTLEDGE, S. A semi-selective medium for isolation of Sclerotinia sclerotiorum. Canadian Journal of Plant Pathology, v.16, n.2, p.68-70, 1994.
YORINORI, J.T. Doenças da soja no Brasil. In: MIYSAKA, S.; MEDINA. J.C. A soja no Brasil Central. Campinas: Fundação Cargill, 1982.350p.
WALD, A. Sequential analysis. New York: John Wiley and Sons, 1947. 212 p.