Thromboelastometric evaluation of horses submitted to
experimental thrombosis and jugular thrombectomy
1Dietrich Pizzigatti2, Daniele S. Gonçalves3, Thays C. Trentin3, Regina K. Takahira3, Ana L.G. Alves4, Celso A. Rodrigues4, Marcos J. Watanabe4 and Carlos A. Hussni4*
ABSTRACT.- Pizzigatti D., Gonçalves D.S., Trentin T.C., Takahira R.K., Alves A.L.G., Rodrigues C.A., Watanabe M.J. & Hussni C.A. 2016. Thromboelastometric evaluation of horses sub-mitted to experimental thrombosis and jugular thrombectomy.Pesquisa Veterinária Brasileira 36(8):677-686. Departamento de Cirurgia e Anestesiologia Veterinária,
Faculda-de Faculda-de Medicina Veterinária e Zootecnia, UniversidaFaculda-de Estadual Paulista, Distrito Faculda-de Rubião Jr s/n, Botucatu, SP 18618-918, Brazil. E-mail: [email protected]
Jugular thrombosis in horses occurs commonly in iatrogenic situations, secondary to en-dotoxemic clinical condition and disseminated vascular coagulation, potentially leading to death. Thus, hemostatic evaluation becomes necessary and extremely important for monito-ring the risks of systemic hypercoagulability and for the efficiency of allopathic and surgical treatment. This paper describes the hemostatic behavior in experimental jugular thrombosis of ten healthy equines, subsequently submitted to two thrombectomy techniques and recei-ving heparin sodium as anti-rethrombosis therapy. These animals were evaluated for 20 days by thromboelastometry (TEM), platelet count, hematocrit and fibrinogen, at four moments: pre-induction to phlebitis (D0-MPF); three days after thrombophlebitis induction (D3-MFM); 6 days after, - moment of thrombophlebitis - (D9-MT); and 54 (D16) and 126 (D19) hours after thrombectomies (PTM). Thrombectomy was performed via a Vollmar Ring (group 1, n=5) and Fogarty catheter (group 2, n=5). All the animals received heparin (150 UI/kg, SC) every 12 hours, for ten days after the respective thrombectomies. Through the blood samples were evaluated TEM, activated partial thromboplastin time (aPTT) and prothrombin time (PT), dosing of fibrinogen, hematocrit and platelet count at the abovementioned moments. For comparison between groups and moments the t test was applied at 5% significance le
-vel. No significant difference was verified between treatment groups at any of the moments. There were reductions in clotting time (CT) and clot formation time (CFT), with increase in maximum lysis (ML) until the moment D9-MT. Evaluation through INTEM® reagent
presen-ted prolongations of CT and CFT with reduction of α angle and ML starting from D16 and D19. Similarly, aPTT presented significant differences between moments pre- (D0, 3 and 9) and post- (D16 and 19) anticoagulant and surgical treatment. The platelet numbers were diminished at moments D16 and D19. In evaluation with EXTEM® reagent, prolongation of
CT and CFT occurred only between the moments D0 vs. D3 and vs. D9. O PT did not present significant differences. The results obtained demonstrate that experimental jugular throm -bophlebitis leads to local clinical alterations, with impairment of tissue and of the extrinsic coagulation pathway (EXTEM®), but without evidence of systemic hypercoagulability status,
since there was no increase of the alpha angle or maximum clot firmness (MCF). Furthermo -re, TEM was shown useful and more sensitive than conventional coagulation tests (PT, aPTT and fibrinogen) for the monitoring of anticoagulant therapy, as demonstrated in other works. INDEX TERMS:Thromboelastometry, jugular thrombophlebitis, horses, Vollmar Ring, Fogarty Catheter.
1 Received on September 1, 2015.
Accepted for publication on March 24, 2016.
2 Universidade do Oeste de Santa Catarina (Unoesc), Rua Getúlio Vargas 2125, Flor da Serra, Joaçaba, SC 89600-000; Doutor pelo Programa de Pós--Graduação em Biotecnologia Animal, Faculdade de Medicina Veterinária e Zootecnia (FMVZ), Universidade Estadual Paulista Júlio de Mesquita
Fi-lho (Unesp), Rua Prof. Dr. Walter Mauricio Correra, s/n, Distrito de Rubião Jr, Botucatu, SP 18618-918, Brazil.
3 Departamento de Clínica Veterinária, FMVZ, Unesp, Botucatu, SP 18618-918, Brazil.
RESUMO.- [Avaliação tromboelastométrica de equi-nos submetidos a trombose e trombectomia jugular experimental.] A trombose jugular nos equinos ocorre
comumente em situações iatrogênicas, secundárias a qua-dros endotoxêmicos e a coagulação vascular disseminada, podendo levar ao óbito. Por isso, avaliação hemostática se faz necessária e de extrema importância para monitorar os riscos de hipercoagulabilidade sistêmica e também a eficiência do tratamento alopático e cirúrgico. Este traba -lho descreve o comportamento hemostático na trombose jugular experimental de dez equinos hígidos, submetidos posteriormente a duas técnicas de trombectomia e rece-bendo heparina sódica como terapia anti retrombosante. Estes animais foram avaliados durante 20 dias por trom-boelastometria (TEM), contagem de plaquetas, hemató-crito e fibrinogênio, em quatro momentos: pré-indução à flebite (D0-MPF); três dias após a indução da tromboflebite (D3-MFM); 6 dias após, - momento de tromboflebite - (D9 --MT); e 54 (D16) e 126 (D19) horas após as trombectomias (MPT). A trombectomia foi realizada com Anel de Vollmar (grupo 1, n=5) e cateter de Fogarty (grupo 2, n=5). Todos os animais receberam heparina (150 UI/Kg, SC) a cada 12 horas, durante dez dias após as respectivas trombectomias. Através de amostras de sangue, foram avaliadas a TEM, o tempo de tromboplastia parcial ativada (TTPa) e tempo de protrombina (TP), a dosagem de fibrinogênio, hematócrito e contagem de plaquetas nos momentos descritos acima. Para a comparação entre os grupos e momentos foi aplica-do teste t, com nível de significância de 5%. Não foi verifi -cada diferença significativa entre os grupos de tratamento em nenhum dos momentos. Houve redução do tempo de coagulação (CT) e do tempo de formação do coágulo (CFT), com aumento da lise máxima (LM) até o momento D9-MT. A avaliação com o reagente intem apresentou
prolonga-mento do CT e do CFT e redução do ângulo α e da LM a partir do D16 e D19. Da mesma forma, o TTPa apresentou diferenças significativas entre os momentos pré (D0, 3 e 9) e pós (D16 e 19) tratamento cirúrgico e anticoagulante. Houve diminuição do número de plaquetas nos momentos D16 e D19. Na avaliação com reagente extem ocorreu
ape-nas o prolongamento do CT e CFT entre os momentos D0 e o D3 e D9. O TP não apresentou diferenças significativas. Os resultados obtidos demonstram que a tromboflebite jugu -lar experimental leva a alterações clínicas locais, com com-prometimento tecidual e da via extrínseca da coagulação (extem), porém sem evidências de um estado sistêmico de
hipercoagulabilidade, pois não houve aumento do ângulo alfa e da firmeza máxima do coágulo (MCF). Além disso, a TEM se mostrou útil e mais sensível que os testes con-vencionais de coagulação (TP, TTPa e fibrinogênio) para o acompanhamento da terapia anticoagulante, conforme de-monstrado em outros trabalhos.
TERMOS DE INDEXAÇÃO: Tromboelastometria, tromboflebite ju -gular, equinos, Anel de Vollmar, Cateter de Fogarty.
INTRODUCTION
Patency of the vascular mesh ensures blood supply (gases, defenses and nutrients) to all regions of the organism and, for this reason, depends on the integrity and rigorous
con-trol of the hemostatic system. In normal situations, activa-tion of hemostatic system always becomes necessary whe-never there are blood losses, to maintain blood flow, free of clots in normal vessels, while it forms a hemostatic buffer at sites where any breach of vascular integrity occurs (Bo-nagura et al. 2010, Mitchell 2013).
In the occurrence of failures in controlling the hemos-tatic activity of blood, there is inadequate formation of the aggregation of figured elements of blood (thrombi) within the vascular bed, enabling total or partial obstruction of the lumen and, in sequence, a limitation in the regional blood drainage or perfusion (Bonagura et al. 2010, Borghesan 2010, Rafael 2012).
The mechanism of thrombus formation was well eluci-dated in the book Thrombose und Embolie (Thrombosis and Embolism), edited in 1856 by Rudolf Ludwig Karl Virchow.
From this compendium arose the recognition of lesion or endothelial loss; alterations of blood flow (stasis or turbu -lence); and, the state of hypercoagulability (increase in the number of platelets, morphofunctional platelet modifica -tions and altera-tions, either congenital or acquired from pro- or anticoagulant factors) – as the three principal fac-tors involved in thrombus formation, known thereafter as the Virchow’s Triad (Irniger 1963, Dornbusch 2005, Maffei et al. 2008, Barbosa et al. 2009, Mitchell 2013).
The monitoring of these hemostatic alterations can pre-dict critical situations such as hemorrhagic diathesis and disseminated intravascular coagulation. These disturban-ces are frequently monitored by means of a coagulogram – exams that analyze specific factors in the plasma (platelet count, fibrinogen, bleeding time, platelet function, activa -ted clot time, thrombin time [TT], prothrombin time [PT] and activated partial thromboplastin time [aPTT]), respon-sible for the clotting system (Reikvam et al. 2009, Mendez--Angulo et al. 2010). These routine tests provide fragmen-ted pieces of information on the clotting process while, for the diagnosis of coagulopathies, many of them need to be performed jointly (Kol & Borjesson 2010).
The thromboelastogram/thromboelastography is a la-boratory method that supplies a global analysis of hemos-tasis - processes of initiation, formation, stabilization and lysis of the coagulum, documenting the interaction of pla-telets and other blood cells with the coagulation proteins (Dias & De Lacerda Neto 2013). TEG® and ROTEM®, both
apparatuses of thromboelastography, furnish a graphic re-presentation of the formation and subsequent lysis of the coagulum, but differ in their system of detection and col-lection of data, utilizing a torsion wire and optical detector, respectively (Reikvam et al. 2009, Kol & Borjesson 2010, Mendez-Angulo et al. 2010, Wiinberg & Kristensen 2010). The interest in their use in equine medicine is focused pri-marily on distinguishing states of hypo- and hypercoagula-bility, in addition to evaluating coagulation and fibrinolysis (Dias & De Lacerda Neto 2013).
interventionism, situations that involve these risk factors, favoring their formation (Byars et al. 2003, Barbosa et al. 2009, Borghesan 2010).
In this context, the present work aimed to describe the hemostatic behavior, through coagulogram and thrombo-elastometry tests, in ten healthy equines submitted to an experimental thrombotic event, subsequent to two models of thrombectomies and anti-rethrombosis therapy.
MATERIALS AND METHODS
Ten healthy adult equines were utilized, of both sexes (2 males and 8 females), evaluated at the moments pre-induction to expe-rimental right jugular phlebitis (MPF) - D0 and accompanied for 13 days, being: maintained phlebitis moment (MFM) - 3 days after induction (D1-3) and the period of thrombophlebitis (PT), which comprises 10 days of established thrombophlebitis (D4-13). After thirteen days, the animals were submitted to thrombectomy with a Vollmar Ring or by application of a Fogarty catheter, constituting
two treatment groups of five animals each: Vollmar Group (VFG)
and Fogarty Group (FG). After application of the thrombectomy techniques, the post-thrombectomy moment (PTM), in which the animals of each group were observed for an additional six days. This work was approved by the Committee for the Ethical Use of Animals at FMVZ - UNESP, campus of Botucatu/SP under the num-ber 97/2012-CEUA.
Induction of jugular thrombophlebitis
The experimental induction to right jugular thrombophlebitis followed the protocol described by Dornbusch (2005). Maintai-ned in a mechanical restraint, the right cervical region was sub-mitted to trichotomy and local antisepsis. Under the effect of a tranquilizer, based on 10% xylazine hydrochloride5 (0.5mg/kg, IV), and a local anesthetic block, based on 2% lidocaine6; in the medial third region of the jugular, an incision of ten centimeters was made in the skin followed by dissection of the vein. Next, two atraumatic vascular clamps were applied7, one at each extremity
(cranial and caudal) of the exposed vein, five centimeters apart.
In this isolated segment of the jugular, with a 25G scalp, 20 mL of blood was drawn and at the same location the same volume of 50% glucose solution was administered8. Soon afterwards, loops were applied with number 2 silk thread woven9 through the skin involving the right jugular vein with the aim of promoting stenosis of the vessel, with this point being exposed on the skin. Fifteen minutes after application of the vascular clamps and glucose solu-tion, the clamps were released and the subcutaneous portion su-tured in a simple continuous pattern using 2-0 polyglactin 91010. The skin was sutured with 2-0 nylon11, following the same pattern employed in the subcutaneous tissue.
Immediately after the induction surgery, and for two subse-quent times every 72 hours, the animals received antibiotic in the form of benzathine penicillin12 (20,000 UI/kg) by the intramuscu-lar route. A daily curative was administered by topical aspersion of 0.5% chlorhexidine solution until the 12th day when, in the oc-currence, the stitches were removed from the skin. The animals
were confined in a stall until the 12th day, then released into pas-ture, while maintaining the initial dietary management.
Composition of experimental groups
Ten days (D13) after experimental induction of thrombosis of the right jugular – mature phase of the thrombus, the animals
were separated randomly into two experimental groups of five
animals each, comprising treatments of thrombectomy with a Fogarty catheter (Group Fogarty –FG) and with a Vollmar Ring
(Group Vollmar - VFG), associated with the passage of a Fogarty catheter.
The animals were equally prepared in the periods pre-, initia-tion of trans- (diverging only in the technique of thrombectomy) and post-operative in relation to the respective thrombectomies. After preoperative preparation constituted by 24 hours of fasting and 12 hours without water, each animal was submitted to inha-lational general anesthesia following the standard protocol em-ployed by the Anesthesiology sector at FMVZ/UNESP, Campus de Botucatu/SP, Brazil. For this, they were administered intravenou-sly pre-anesthetic medication with xylazine13 and, for anesthetic induction, by the same route, diazepan14 associated with ketami-ne hydrochloride15 and guaiacol glyceryl ether16. After achieving decubitus, endotracheal intubation was performed; the animals were positioned on the surgical table in left lateral decubitus and maintained throughout the surgery under inhalational general
anesthesia with isoflurane17.
Under general anesthesia, antisepsis was performed with al-cohol-based povidone-iodine (5%) and mounting of the surgical
field. Venous surgical access was accomplished via one incision
(5cm) in the skin with a number 24 scalpel blade, on the right
ju-gular, in the caudal cervical region to the segment of induction (segment C) and next, the divulsion of the planes and isolation of the vessel. Caudal and cranial umbilical tape18 were applied on the
vessel, aiming to control the blood flow. Soon afterwards, longitu -dinal jugular phlebotomy (2cm) was performed with a number 12
scalpel blade, between the vascular tape. Starting at this moment, the animals were submitted to thrombectomy respective to the pertinent treatment group, among the following:
Thrombectomy with a Fogarty catheter: according to the pro-tocol of Dornbusch (2005), after phlebotomy a Fogarty catheter was inserted into the jugular lumen19. After surpassing the enti-re cervical enti-region of the jugular arriving at the bifurcation point (RA), the madril wire of the catheter was removed and the cuff
filled with 3.5mL of physiological solution. With the cuff inflated,
catheter traction was performed. The movements of insertion and
traction of the catheter, with the cuff empty and filled (respective -ly), were repeated three times.
Thrombectomy with a Vollmar Ring: the thrombectomy follo-wed the protocol for endarterectomy with a Vollmar Ring descri-bed in the literature (Maffei et al. 2008). After phlebotomy the Vollmar Ring was introduced into the jugular lumen in counter-clockwise movements in the cranial direction up to the segment of jugular bifurcation (RA). The traction of the Ring was carried out by performing the same movement, but in a caudal direction.
5 Sedomin®, Fort Dodge, Campinas, Brazil;
6 Lidocaine chlorhydrate 2%® Brasmed, Minas Gerais, Brazil; 7 DeBakey®, Geister, Germany;
8 Glucose 50%, Isofarma, Eusébio-CE; 9 JP Pharmaceutical Company S.A.;
10 Vicril®, Ethicon, Johnsons & Johnsons, São José dos Campos/SP, Bra-zil;
11 JP®, Ribeirão Preto/SP, Brazil.
12 Pentabiótico Reforçado® 8,4gr - Fort Dodge Ltda, Belo Horizonte/MG, Brazil;
13 Sedazine - Fort Dodge Fort Dodge Ltda, São José do Rio Preto/SP, Bra-zil;
14 Diazepam União® - União Química, Embu-Guaçu/SP, Brazil; 15 Dopalen®, Vetbrands, Jacareí/SP, Brazil;
16 Éter Gliceril Guaiacol® - E.H.G Agrofarma, Mogi Mirim/SP, Brazil; 17 Isoforine®, Cristália Produtos Químicos Farmacêuticos Ltda, Itapira/ SP, Brazil.
18 Umbilical tape, Johnson & Johnson Ltda;
Next was completed the same protocol for passage of the Fogarty catheter; the thrombus fragments were removed by the initial ju-gular phlebotomy.
After application of the thrombectomy techniques, the sutu-re of the jugular with 6-020 polypropylene followed in a simple isolated pattern, covering all planes of the vascular wall. The sub-cutaneous was approximated together to the intradermic suture stitches in a continuous simple pattern with 2-0 polyglactin 910. In the occurrence of dehiscence of the intradermic stitches, as a reinforcement, the skin was sutured in a continuous simple pat-tern with 2-0 nylon.
Immediately after the surgery and every 72 hours, the animals
received benzathine penicillin (20,000 UI/Kg, IM) and flunixin meglumine (1mg/kg, IM) two times per day, for five days, intra -muscularly and, heparin21 (150 UI/kg, SC) two times per day, for ten days, for preventing vascular rethrombosis. The daily curative was done with aspersion of 0.5% chlorexidine solution22 topically until the 12th day when, in the occurrence, the stitches were
remo-ved from the skin. The animals were confined in individual stall
until the 12th day and, next, released into pasture, maintaining the initial feed management.
Laboratory exams
Throughout the evolution of this research study, the collec-tions for the exams were performed at the moments of experi-mental surgical pre-induction to phlebitis (D0), three days after induction (D3), nine days from installation of thrombophlebitis (D9) and 54 (D16) and 126 (D19) hours, after the realization of
thrombectomies.
The blood samples were collected from the left jugular vein with the equipment situated in a vacuum system23 and added into a tube with 3.2% sodium citrate, then immediately sent for analysis to the Clinical Pathology laboratory at the Veteri-nary Hospital of FMVZ-UNESP, Campus at Botucatu, Sao Paulo state, Brazil. The samples with sodium citrate were submitted to thromboelastometry24, from which the following variables were considered: [CT] clotting time; [CFT] clot formation time;
angle-α [alpha]; [MCF] maximum clot firmness; and maximum
lysis [ML], with tests being performed with reagents of intrin-sic (INTEM®) and extrinsic (EXTEM®) pathways. Another
citra-ted blood sample was submitcitra-ted to an ice bath and subsequent centrifugation to obtain the plasma, which was utilized for ac-complishment of the tests activated partial thromboplastin time (aPTT) and prothrombin time (PT) by means of commercial kits25. The samples collected with EDTA were sent immediately
to the laboratory for determination of the fibrinogen concentra -tion by the precipita-tion technique at 56°C; the platelet count was carried out in an automatic cell counter26 and its confirma -tion in a blood smear; when necessary the count was performed manually and the hematocrit was measured by the technique of microhematocrit.
All the values for fibrinogen, platelet count, activated partial
thromboplastin time and prothrombin time were compared with the minimum and maximum reference values from the literature (Lassen & Swardson 1995, Sellon & Wise 2009, Grondin & Dewitt 2010, Harvey 2012, Magdesian & Southwood 2014); and for
com-parison between groups and moments the t test was applied at a significance level of 5%.
RESULTS
The tests of analysis of variance did not identify any diffe-rence in treatments for any of the variables, at any of the moments of evaluation. In this context, the evaluation con-sidered variables for a single group, considering its means and standard deviations.
Platelet count
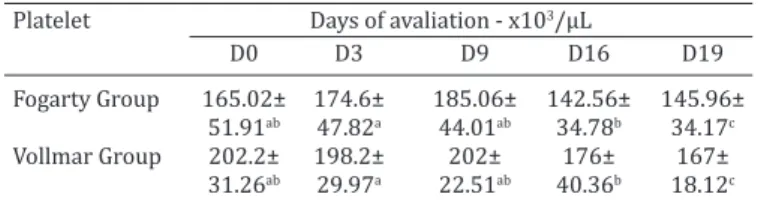
The difference in the mean values (in /µL) of the plate-let count at the different moments, from both groups are presented in Table 1 and in figures 1 and 2, in which a sig -nificant difference was observed (0.0129) (p<0.050) in the comparative statistical analysis between the moments D0 vs. D19.
Globular volume
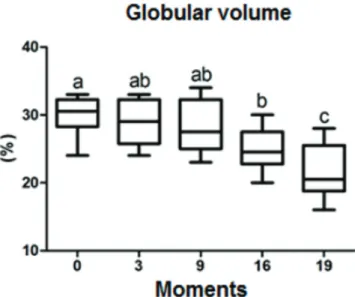
The difference in mean values (%) for globular volume (GV) at the different moments, of both groups are presen-ted in Table 2 and in figures 3 and 4, in which a significant difference was observed (0.0089) in the comparative
sta-Table 1. Mean and standard deviation of the platelet count (x103/µL) between the moments and treatment groups
Platelet Days of avaliation - x103/µL
D0 D3 D9 D16 D19
Fogarty Group 165.02± 174.6± 185.06± 142.56± 145.96± 51.91ab 47.82a 44.01ab 34.78b 34.17c
Vollmar Group 202.2± 198.2± 202± 176± 167± 31.26ab 29.97a 22.51ab 40.36b 18.12c
Different lowercase letters indicate significant differences between mo
-ments (p<0,05).
Fig.1. Boxplot graph presenting the comparison of platelet counts (x103/µL), at specific moments (days) of evaluation. The lines inside the boxes denote the second quartile (50% of the data - median), the upper lines, the third quartile (75% of the data)
and the lower lines the first quartile (25% of the data). The ex -ternal lines indicate the standard deviation between the sam-ples. The statistical analysis of the treatments is considered wi-thout differences; for this reason they were considered jointly.
20 Prolene®, Johnson & Johnson Ltda;
21 Sodium Heparin®, Billi Farmacêutica Ltda, Santo Amaro, SP, Brazil;
22 Riohex clorexidina 0.5%® - E.H.G. Agrofarma, Mogi Mirim/SP, Brazil. 23 Vacutainer® BD, Brazil;
24 Rotem®, Delta, Pentapham, Munich, Germany;
25 Clot®, Sorocaba, Brazil;
tistical analysis of moments D0 vs. D16, D0 vs. D19, D3 vs. D19 e D9 vs. D19.
Fibrinogen
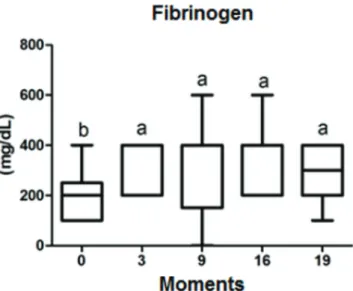
The difference in mean values (mg/dL) of fibrinogen at different moments, for both groups are presented in Table 3 and in figures 5 and 6, in which a significant difference was not observed (p<0.050) in the comparative statistical analysis of the moments (0.2182), of the treatment groups and of the interaction of the two.
Activated partial thromboplastin time (aPTT) and pro-thrombin time (PT)
The difference in the mean values (seconds) for the acti-vated partial thromboplastin time at the different moments, in both groups are presented in Table 4 and in figures 7 and 8, in which significant differences were observed, in the analysis of variance, (p<0.050) between moments (0.0018). The comparative statistical analysis indicated a significant difference between days D9 vs. D16 and D9 vs. D19.
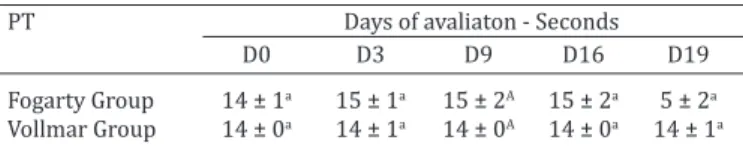
The difference in the mean values (seconds) for pro-thrombin time (PT) at different moments, in both groups are presented in Table 5 and in figures 9 and 10, in whi -ch significant differences were not observed (p<0,050) in the comparative statistical analysis of moments, treatment groups and interaction of the two.
Thromboelastometry
The difference in mean values (seconds) of thromboe-lastometric variables (CT, CFT, angle α, MCF and ML), rea
-lized with reagents from the intrinsic pathway (INTEM®)
and extrinsic pathway (EXTEM®), at different moments,
from both groups are presented in figures 11 and 12, res -pectively.
Table 2. Values for mean and standard deviation of globular volume -GV (%) between the moments and treatment groups
GV Days of avaliation - Seconds
D0 D3 D9 D16 D19
Fogarty Group 29 ± 4a 28 ± 4ab 28 ± 3Ab 23 ± 2b 19 ± 3c Vollmar Group 31 ± 1a 31 ± 2ab 28 ± 2Ab 25 ± 3b 22 ± 3c
Different lowercase letters indicate significant differences between mo
-ments (p<0,05).
Table 3. Values of mean and standard deviation of fibrinogen dosage (mg/dL) between moments and treatment groups
Fibrinogen Days of avaliation
D0 D3 D9 D16 D19
Fogarty Group 220±110b 320±110a 320±179A 400±141a 340±134a Vollmar Group 200±122b 360±89a 360±167A 300±115a 280±110a
Different lowercase letters indicate significant differences between mo
-ments (p< 0,05).
Fig.2. Mean and standard deviation of the platelet count, in /µL, at moments pre- and post treatment, in both groups – Fogarty and Vollmar. (gray) reference index of the literature consul-ted (Lassen & Swardson 1995, Sellon & Wise 2009, Grondin & Dewitt 2010, Harvey 2012, Magdesian & Southwood 2014).
Fig.3. Boxplot graph presenting a comparison of globular volume
(%), at specific moments (days) of evaluation. The lines inside
the boxes denote the second quartile (50% of the data - me-dian), the upper lines, the third quartile (75% of the data) and
the lower lines the first quartile (25% of the data). The exter -nal lines indicate the standard deviation between the samples. Since the statistical analysis of the treatments is considered to be without differences, they were considered jointly.
In variables with reagent from the intrinsic pa-thway (INTEM®) significant differences were found in CT
(<0.001) between moments D0 vs. D16, D0 vs. D19, D3 vs. D16, D3 vs. D19, D9 vs. D16 and D9 vs. D19; in CFT betwe-en mombetwe-ents D0 vs. D16, D3 vs. D16, D9 vs. D16 and D9 vs. D19; in angle α between moments D3 vs. D16, D9 vs. D16 and D9 vs. D19; and in ML, between moments D0 vs. D19, D3 vs. D16, D3 vs. D19 and D9 vs. D19. In the variable MCF significant differences (p<0.050) were observed only in the comparative statistical analysis of moments D3 vs. D19.
In variables with extrinsic pathway reagent (EXTEM®),
significant differences were found in CT (0,0518), between
the moments D0 vs. D16; in CFT between the moments D0 vs. D3; and in ML (<0.0117) between the moments D9 vs. D19. In the variables angle α and MCF significant differen -ces were not observed (p<0.050) in the comparative statis -tical analysis of the moments, of the treatment groups and of the interaction of the two.
Fig.6. Mean and standard deviation of fibrinogen dosage, in mg/
dL, at pre- and post-treatment moments, in both groups – Fo-garty and Vollmar. (gray) reference index of the literature con-sulted (Lassen & Swardson 1995, Sellon & Wise 2009, Grondin & Dewitt 2010, Harvey 2012, Magdesian & Southwood 2014).
Table 4. Values for mean and standard deviation of count from the activated partial thromboplastin time (seconds)
between the moments and treatment groups
aPTT Days of avaliaton - Seconds
D0 D3 D9 D16 D19
Fogarty Group 38 ± 2a 38 ± 5ab 38 ± 6A 53 ± 15bc 43 ± 14c Vollmar Group 38 ± 5a 39 ± 3ab 36 ± 3A 55 ± 19bc 44 ± 7C
Different lowercase letters indicate significant differences between mo
-ments (p<0,05).
Fig.7. Boxplot graph presenting a comparison do Activated partial
thromboplastin time (seconds), at specific moments (days)
of evaluation. The lines inside the boxes denote the second quartile (50% of the data - median), the upper lines, the third
quartile (75% of the data) and the lower lines the first quarti -le (25% of the data). The external lines indicate the standard deviation between the samples. Since the statistical analysis of the treatments is considered to be without differences, they were considered jointly.
Fig.8. Mean and standard deviation of the count for activated par-tial thromboplastin time (aPTT), in seconds, at pre- and post--treatment moments, from both groups.
Fig.5. Boxplot graph presenting a comparison of fibrinogen dosage (mg/dL), at specific moments (days) of evaluation. The lines in -side the boxes denote the second quartile (50% of the data - me-dian), the upper lines, the third quartile (75% of the data) and
the lower lines the first quartile (25% of the data). The external
well as new plans to correct situations in which thrombus gives rise to total obstruction of blood flow. This is the fo -cus of the present research, which evaluated the hemos-tatic aspects involved in the entire process of induction, maturation and response after allopathic and/or surgical treatment. Throughout the evolution of this research study, the platelet count in both groups remained within the refe-rence indices present in the literature (Lassen & Swardson 1995, Sellon & Wise 2009, Grondin & Dewitt 2010, Harvey 2012, Magdesian & Southwood 2014).
Studies of hypercoagulability can be evidenced through an increase in the alpha angle and in the maximum ampli-tude. Some recent works have reported that the value of the maximum amplitude in the postoperative period may be predictive of thrombotic complications (Mccrath et al. 2005). Identified from the variables evaluated were reduc -tions in clotting time (CT) and clot formation time (CFT), along with increases in maximum lysis (ML) until the mo-ment D9-MT, which demonstrates the consumption of coa-gulation and active fibrinolysis factors before the animals received the respective treatments. The consumption of co-agulation factors and the partial reduction of cells involved in thrombus / clot formation are the physiological sequen-ce of thrombus formation.
The evaluation via the reagent INTEM® presented
pro-longation of CT and of CFT as well as reduction of the angle α and of ML starting from D16 and D19, indicating an effect from heparin treatment (Donahue & Otto 2005, Epstein et al. 2009). The thrombocytopenia and reduction in the glo-bular volume found on D16 and D19 in both groups may be related to reactivity of the thrombus after the employment of thrombectomy techniques.
The toxic effect of heparin on erythrocytes of horses submitted to heparin treatment has also been documen-ted. In this case, its effect is related to agglutination of erythrocytes (Mahaffey & Moore 1986, Moore & Hinchcliff 1994), resulting in phagocytosis by macrophages and re-duction in globular volume. In our study, hematocrit pre-sented a considerable reduction between D9 and D16 and D19. This finding was already described in works by Bor -ghesan (2010) and Hussni et al. (2009) and, in agreement with them, we do not believe that the reductions in the to-tal platelet count and globular volume would be significant and is related to an augmentation of platelet aggregation caused by treatment with heparin. The “thrombocytope-nia induced by the use of heparin” is a clinicopathological syndrome that occurs when IgG antibodies dependent on heparin bind to factor 4 of the platelet activation complex to produce a state of hypercoagulability (Maffei et al. 2008, Hussni et al. 2009, Borghesan 2010, Pavanelli & Spitzner 2011). The clinical signs commonly appear 5 days after the initiation of therapy with non-fractionated heparin, hepa-rin presenting a low molecular weight (Linkins 2015). Its more severe form is associated with a high risk of throm-botic events that are potentially life threatening in human patients, especially those that present a diminution of 30 to 50% in the platelet count during heparin treatment, even when not presenting thrombocytopenia (Maffei et al. 2008, Hussni et al. 2009, Borghesan 2010, Linkins 2015).
Table 5. Values for mean and standard deviation of count of prothrombin time (seconds) between moments and
treatment groups
PT Days of avaliaton - Seconds
D0 D3 D9 D16 D19
Fogarty Group 14 ± 1a 15 ± 1a 15 ± 2A 15 ± 2a 5 ± 2a Vollmar Group 14 ± 0a 14 ± 1a 14 ± 0A 14 ± 0a 14 ± 1a
Different lowercase letters indicate significant differences between mo
-ments (p<0,05).
Fig.9. Boxplot graph presenting a comparison of prothrombin
time (seconds), at specific moments (days) of evaluation. The
lines inside the boxes denote the second quartile (50% of the data - median), the upper lines, the third quartile (75% of the
data) and the lower lines the first quartile (25% of the data).
The external lines indicate the standard deviation between the samples. Since the statistical analysis of the treatments is con-sidered to be without differences, they were concon-sidered jointly.
Fig.10. Mean and standard deviation of counts for prothrombin time (PT), in seconds, at pre- and post-treatment moments, in both groups.
DISCUSSION
In relation to the use of heparin as an anticoagulant in allopathic therapy or as a postoperative co-adjuvant after vascular surgeries, there is consensus on the importance of its laboratory monitoring with reagents of aPTT (more sensitive to the inhibitory effects of heparin on thrombin, the factors Xa and IXa) and the platelet count, being that the absence of thrombocytopenia at D16 and an increase not greater than 1.5 to 2.5 times (in seconds) of aPTT, in both groups, demonstrated that the lowest heparin dose utilized (150 UI/Kg, SC) is safe (Moore & Hinchcliff 1994, Dornbusch, 2005, Borghesan 2010).
The mean values of aPTT (38 seconds) and of PT (15 seconds) were maintained on D3 and D9, within the mean baseline values obtained on D0. The determination of the activated partial thromboplastin time (aPTT) and the pro-thrombin time (PT) in the animals evaluated produced levels near those of the reference values reported in the literature, namely 38 and 14 seconds, respectively on D0 (Sellon & Wise 2009).
Due to the specificity of PT by the extrinsic pathway of the coagulation cascade, its indication in hemostatic mo-nitoring has little value. A comparative analysis of the PT means between the groups and among the moments did not find a statistically significant difference. The aPTT presented significant differences between the moments pre- (D0, 3 and 9) and post (D16 and 19) surgical and an-ticoagulant treatments, but without differences between
treatments. As described by Borghesan (2010), the PT was not altered by the use of postoperative anticoagulant the-rapy, maintaining a mean of 14 seconds in both groups, at all the moments of evaluation. According to Cesarini et al. (2014), the PT values are prolonged significantly when the equines receive treatment with an anticoagulant based on low-molecular-weight heparin.
Usually the aPTT and PT are utilized jointly for evalu-ating secondary hemostasis. In this context, the best indi-cator of a negative prognosis for the admission of horses with colic are a prolonged time of aPTT (>63 seconds) to-gether with low antithrombin activity (< 74%) (Stokol et al. 2005).
Through thromboelastometry, we can evaluate the effect of heparin and control its therapy by graphic indi-cators of the interval of clotting time and clot formation, which is more judicious managed with the availability of specific reagents, such as Heptem® – a heparinase that is
inactive, thus facilitating the identification of anomalous effects from the therapy and the immediate correction of the dose or suspension of medication (Donahue & Otto 2005, Epstein et al. 2009, Kol & Borjesson 2010, Mendez--Angulo et al. 2010).
Both INTEM® and aPTT evaluate the intrinsic pathway
of the coagulation cascade, demonstrating that such altera-tions are mainly consequences of anticoagulant treatment. In the evaluation with the reagent EXTEM, a prolongation Fig.11. Boxplot graph presenting a comparison of thromboelastometry variables: [CT] clotting time – seconds; [CFT] clot formation time
– seconds; [angle-α] angle formed between CT and the beginning of the graph curvature – degrees; [MCF] maximum clot firmness -
millimeters; and maximum lysis [ML] - %, with reagent tests of the intrinsic pathway (INTEM®) being performed on specific days of
evaluation. The lines inside the boxes denote the second quartile (50% of the data - median), the upper lines, the third quartile (75%
of the data) and the lower lines the first quartile (25% of the data). The external lines indicate the standard deviation between the
of CT and CFT occurred only between the moments D0 vs. D3 and D9, which suggests consumption of clotting factors due to the induction of thrombosis. PT did not present sig-nificant differences, demonstrating greater sensitivity of TEM in the evaluation of the extrinsic coagulation cascade. The results obtained herein demonstrate that experimen-tal jugular thrombophlebitis leads to local clinical altera-tions with compromise of tissue as well as of the extrinsic coagulation cascade (EXTEM®), but without evidence of a
systemic state of hypercoagulability, since there was no in-crease in the alpha angle or in the maximum clot firmness (MCF).
CONCLUSION
Taking into consideration that the procedure of thrombosis induction has appreciation and applicability already appro-ved by other authors (Hussni et al. 2006, Hussni et al. 2009, Borghesan 2010, Hussni et al. 2012), we conclude by means of thromboelastometry and of coagulogram that the expe-rimental induction of thrombosis is incapable of provoking systemic hemostatic alterations. Furthermore, thrombec-tomy does not cause significant hemostatic effects; only significate alterationsof aPTT and in thromboelastometry with INTEM® (CT, CFT and ML) were verified due to antire
-thrombosis therapy with heparin, without causing a sharp reduction of hematocrit or platelet count.
Acknowledgements.- São Paulo Research Foundation
(FAPESP-Funda-ção de Amparo à Pesquisa do Estado de São Paulo) process 23467-7/2011
and PROpe - Unesp.
REFERENCES
Barbosa R.G., Borghesan A.C., Cerqueira N.F., Hussni C.A., Alves A.L.G., Ni-coletti J.L.M. & Fonseca B.P.A. 2009. Fisiopatologia da trombose da veia jugular em eqüinos: revisão. Vet. Zootec. 16(1):26-37.
Bonagura J.D., Reef V.B. & Schwarzwald C.C. 2010. Cardiovascular disease: vascular disease, p.450-453. In: Reed S.M., Bayly W.M. & Sellon D.C. (Eds), Equine Internal Medicine. Vol.10. 3rd ed. Elsevier Saunders, St Louis.
Borghesan A. C. 2010. Avaliação da tromboflebite jugular experimental em
equinos tratados com heparina. Dissertação de Mestrado em Cirurgia e Anestesiologia Veterinária, Universidade Estadual Paulista “Júlio de Mesquita Filho”, Botucatu. 87p.
Byars T.D., Davis D. & Divers T.J. 2003. Coagulation in the equine inten-sive-care patient. Clin. Techn. Eq. Pract. 2(2):178-187.
Cesarini C., Monreal L., Armengou L., Delgado M.A., Ríos J. & Jose-Cunille-ras E. 2014. Progression of plasma D-dimer concentration and coagu-lopathies during hospitalization in horses with colic. J. Vet. Emerg. Crit. Care 24(6):672-680.
Dias D.P. & De Lacereda Neto J.C. 2013. Jugular thrombophlebitis in
hors-es: a review of fibrinolysis, thrombus formation, and clinical manage -ment. Can. Vet. J. 54(1):65-71.
Donahue S.M. & Otto C.M. 2005. Thromboelastography: a tool for
measur-ing hypercoagulability, hypocoagulability, and fibrinolysis. J. Vet. Emerg.
Crit. Care. 15(1):9-16.
Dornbusch P.T. 2005. Trombectomia com cateter de Fogarty no
tratamen-Fig.12. Boxplot graph presenting a comparison of thromboelastometry variables : [CT] clotting time – seconds; [CFT] clot formation time
– seconds; [angle-α] angle formed between the CT and the beginning of the graph curvature – degrees; [MCF] maximum clot firmness
– millimeters; and maximum lysis [ML] - %, with the reagent tests being performed from the extrinsic pathway (EXTEM®) on specific
days of evaluation. The lines inside the boxes denote the second quartile (50% of the data - median), the upper lines, the third
to da trombose jugular experimental em equinos. Tese de Doutorado, Departamento de Cirurgia e Anestesiologia Veterinária, Faculdade de Medicina Veterinária e Zootecnia, Universidade Estadual Paulista, Bo-tucatu. 69p.
Epstein K.L., Brainard B.M., Lopes M.A., Barton M.H. & Moore J.N. 2009. Thrombelastography in 26 healthy horses with and without activation by recombinant human tissue factor. J. Vet. Emerg. Crit. Care 19(1):96-101. Grondin T.M. & Dewitt S.F. 2010. Normal hematology of the horse and
don-key, p.821-828. In: Weiss D.J. & Wardrop K.J. (Eds), Schalm’s Veterinary Hematology. 6thed. Wiley, Iowa.
Harvey J.W. 2012. Evaluation of hemostasis: coagulation and platelet dis-orders, p.191-233. In: Harvey J.W. (Ed.), Veterinary Hematology: a diag-nostic guide and color atlas. Elsevier Saunders, Missouri.
Hussni C.A., Barbosa R.G., Borghesan A.C., Rollo H.A., Alves A.L.G., Wata-nabe M.J., Machado V.M.V. & Cerqueira N.F. 2012. Aspectos clínicos,
ul-tra-sonográficos e venográficos da tromboflebite jugular experimental
em equinos. Pesq. Vet. Bras. 32:595-600.
Hussni C.A., Dornbusch P.T., Alves A.L.G., Thomassian A., Nicoletti J.L.M.,
Cillo G.P. & Vulcano L.C. 2006. Avaliação clínica e angiográfica da vascu
-larização consecutiva à ressecção experimental da jugular em equinos.
Vet. Zootec. 13(2):163-168.
Hussni C.A., Dornbusch P.T., Yoshida W.B., Alves A.L.G., Nicoletti J.L.M., Mamprim M.J. & Vulcano L.C. 2009. Trombectomia com cateter de
Fo-garty no tratamento da tromboflebite jugular experimental em eqüinos.
Pesq. Vet. Bras. 29:45-51.
Irniger W. 1963. Histologische Altersbestimmung von Thrombosen und Embolien. Virchows Archiv für Pathologische Anatomie und Physiologie und für klinische Medizin 336(3):220-237.
Kol A. & Borjesson D.L. 2010. Application of thrombelastography/throm-boelastometry to veterinary medicine. Vet. Clin. Pathol. 39(4):405-416. Lassen E.D. & Swardson C.J. 1995. Hematology and hemostasis in the
horse: normal functions and common abnormalities. Vet. Clin. North Am., Equine Pract. 11(3):351-389.
Linkins L.A. 2015. Heparin induced thrombocytopenia. Brit. Med. J. 350.
Disponível em <http://www.bmj.com/bmj/350/bmj.g7566.full.pdf > Maffei F.H.A., Lastória S., Yoshida W.B., Rollo H.A., Mariangela G. & Moura
R. 2008. Doenças Vasculares Periféricas. 4ª ed. Guanabara Koogan, Rio de Janeiro.
Magdesian K.G. & Southwood L. 2014. Monitoring. (Apud Southwood L. & Wilkins P.A. Equine Emergency and Critical Care Medicine 1(2):623-651).
Mahaffey E.A. & Moore J.N. 1986. Erythrocyte agglutination associat-ed with heparin treatment in three horses. J. Am. Vet. Massociat-ed. Assoc. 189:1478-1480.
McCrath D.J., Cerboni E., Frumento R.J., Hirsh A.L. & Bennett-Guerrero E. 2005. Thromboelastography maximum amplitude predicts postopera-tive thrombotic complications including myocardial infarction. Anesth. Analg. 100(6):1576-1583.
Mendez-Angulo J.L., Mudge M.C, Vilar-Saavedra P., Stingle N. & Couto C.G.
2010. Thromboelastography in healthy horses and horses with inflam -matory gastrointestinal disorders and suspected coagulopathies. J. Vet. Emerg. Crit. Care 20(5):488-493.
Mitchell R.N. 2013. Hemodynamic disorders, thromboembolism, and shock, p.79-92. In: Kumar V., Abbas A.K. & Aster J.C. (Eds), Robbins Basic Pathology. 9th ed. Elsevier Saunders, Philadelphia.
Moore B.R. & Hinchcliff K.W. 1994. Heparin: a review of its pharmacology and therapeutic use in horses. J. Vet. Intern. Med. 8(1):26-35.
Pavanelli M.F. & Spitzner F.L. 2011. Trombocitopenia induzida por
hepa-rina: revisão de literatura. UNOPAR Científica: Ciências Biológicas e da
Saúde 13:325-332.
Rafael L.A. 2012. Avaliação do efeito trombogênico da perfusão regional intravenosa com gentamicina em equinos. Dissertação de Mestrado, em Cirurgia e Anestesiologia Veterinária, Faculdade de Medicina Veteriná-ria e Zootecnia, Universidade Estadual “Julio de Mesquita Filho”, Botu-catu, SP. 98p.
Reikvam H., Steien E., Hauge B., Liseth K., Hagen K.G., Størkson R. & Hervig T. 2009. Thrombelastography. Transf. Apheresis Sci. 40(2):119-123. Sellon D.C. & Wise L.N. 2009. Disorders of the hematopoietic system,
p.730-776. In: Reed S.M., Bayly W.M. & Sellon D.C. (Eds), Equine Internal Medicine. 3rd ed. Elsevier Health Sciences, St Louis.
Stokol T., Erb H.N., De Wilde L., Tornquist S.J. & Brooks M. 2005.
Evalua-tion of latex agglutinaEvalua-tion kits for detecEvalua-tion of fibrin(ogen) degradaEvalua-tion
products and D-dimer in healthy horses and horses with severe colic. Vet. Clin. Pathol. 34(4):375-382.