Computer simulation of the morphological characteristics of thermally sprayed coatings
A. T. Bernardes and F. G. S. Arau´jo
Departamento de Fı´sica, Universidade Federal de Ouro Preto, 35400-000 Ouro Preto MG, Brazil
J. R. T. Branco
Fundac¸a˜o Centro Tecnolo´gico de Minas Gerais, Avenida Jose´ Caˆndido da Silveira 2000, 31.170-000 Belo Horizonte MG, Brazil ~Received 14 October 1997!
We present a computational model for the simulation of thermal spray deposition of powders on the surface of solid substrates kept at low temperatures. The method of simulation relates the deposition temperature, the particle size, and the mechanical properties of the powder and of the substrate in an attempt to predict the shape of the deposited particle after cooling. A porous structure is obtained and the dynamical evolution of its surface roughness is measured for different temperatures.@S1063-651X~98!03507-7#
PACS number~s!: 07.05.Tp, 81.15.Rs, 68.35.Ct
I. INTRODUCTION
In recent years, there has been a growing interest in the use of thermal spray techniques for depositing thick film coatings of various applications on a wide variety of sub-strates @1#. An example is titanium substrates coated with plasma sprayed hydroxyapatite~HA!films, which consist of an important class of composite for human implants, espe-cially in tooth, joint, and hip replacements @2#.
The morphology of the coatings is strongly dependent on the parameters of deposition, on the properties of the sub-strate, and on the properties of the material deposited. The thermal properties of the materials involved, as well as the surface and elastic characteristics of the substrate, the par-ticle size distribution of the depositing powder, and the tem-peratures of both will determine the porosity, the roughness, and, ultimately, the mechanical properties of the coating.
However, as the properties of the starting materials vary for each process, the prediction of the characteristics of the coatings becomes a difficult task, usually demanding a series of experiments before a good result is achieved. Therefore, it is desirable to establish a computational method capable of predicting, at least, the morphology of the coating, provided the parameters of processing and the properties of the mate-rials employed. Analytical calculation of the mechanical properties of the resulting coatings, based on their morpholo-gies, is already becoming possible@3#.
In addition to allowing the calculation of mechanical properties, the determination of the morphology of the coat-ings has other important applications. In the case of bioactive coatings, HA, with the composition Ca5(PO4)3OH, provides a better compatibility with bone tissues than titanium, be-cause it enhances bone formation on itself and bonds to bone directly@4#. However, HA coatings have a tendency to dis-solve in living tissue, and also have a relatively weak bond with metal substrates @4#. In conclusion, efforts to optimize the amount of surface area of the coating in contact with the body fluid, as well as to strengthen the interfacial bonds, are crucial to providing effective and stable implants.
Computer simulations have been used in order to study the morphological features of different deposition processes @5–7#. However, all the basic models apply to problems of
the deposition of hard particles all with the same size, usu-ally a pointlike particle. On the other hand, models for the packing of particles of different sizes do not take into ac-count the change in the shape of the grain @8#. In fact, we assume that a model for thermal spray deposition should consider that melted particles propelled against a rigid and cool substrate will acquire a permanent deformation which will influence the growth process.
In the present work, we introduce a computer model to simulate the morphological characteristics of coatings depos-ited by thermal spray. Our model is inspired by that initially proposed by Mannaet al.for the simulation of a drop sliding down a wall @9# and later used to discuss the falling of a liquid drop@10#. This model divides the depositing particles in pixels with preferred movement towards the substrate, at the same time allowing them to translate laterally. Two basic features determine the morphology of the coating: ~i! The difference in the temperature between a particle and the sub-strate and ~ii! the momentum of a particle due to the spray propulsion. These features are simulated through an interac-tion energy between pixels and therefore the particles’ defor-mation is simulated by the probability of pixel translation in the direction of the substrate which is given by a Monte Carlo algorithm. The thermal and elastic properties of the substrate and of the particles, which determine the quenching time, are simulated by the allowed time for pixel dislocation.
II. MODEL
Our model is defined on a lattice of Lx3Lh sites. h50 represents the substrate. At the h direction the system has fixed boundary conditions; i.e., a particle cannot crossh50. Two different boundary conditions are adopted in the x di-rection: periodic or fixed, depending on the problem. Each site is associated with a two-state Ising variable Si. Si5
21 means empty space ~as, for example, air or vacuum! while Si51 represents the substrate or part of a particle.
A particle is represented by an initially spheric@circular in two dimensions~2D!#region of the space formed byVp con-nected sites, Vp meaning the total volume occupied by the particle which is conserved along the simulation. In order to simulate the qualitative behavior of the deposition of a par-ticle, we have made three basic assumptions.
~a!Initially the particles are at high temperatures and they
PRE 58
cool down as they collide with a cool substrate and lose heat. At the same time, they become increasingly rigid.
~b! The particles tend to deform towards the substrate, since they are propelled against it.
~c! After collision and solidification, a particle will be-come part of the substrate and none of its parts can move any more.
In order to simulate the deposition process, the dynamics is given by an ‘‘interaction energy’’ between sites given by
Ei52Si
S
(
NN
Sj1
(
NNN
Sj1gh~Si!
D
. ~1!As discussed in previous works @9#, the first term ~nearest neighbor interaction!tends to reduce the surface of the par-ticle while the second term ~next nearest neighbor interac-tion! is the ‘‘first approach on a lattice to reduction of the curvature.’’ Both terms are necessary to mimic the effects of ‘‘molecular’’ attraction, surface rigidity, and surface tension @10#. Thus, if there were no propulsion, the particle would tend to keep the initial spheric~circular!shape. In the sliding down or falling of liquid drops the third term represented the gravitational effect. In the present work, it represents the momentum of a particle due to the spray propulsion. The propelling term in this approach is given by the fieldgh(Si) which is associated with the distance between a site and the substrate: gh5kh. Since what matters in our Monte Carlo simulations is the difference of energy DE between neigh-boring sites, if a part of a particle goes towards the substrate, this term will contribute with 2k; otherwise, this contribu-tion is1k. For changings at the same height there is no such contribution. In this work we assumedk51.
The deposition of a particle is simulated as follows: First of all we define the radius R of the particle. In our simula-tions the radius is obtained at random from a Gaussian dis-tribution with mean radius R¯ and standard deviation sR. After that, we choose at random the initial x position of the center of the particle. The initialh position is obtained as the lowest h position that allows at least a part—a site—of the particle to touch the substrate; it does not matter which part of the particle touchs the substrate: a site at the bottom or at the side portion of the particle. In our simulations a part of a particle and a part of the substrate cannot occupy the same site~excluded volume assumption!. After defining the initial position, we try to move each part that forms the particle to a neighboring empty site; i.e., only changes between empty sites and parts of the actual depositing particle are allowed. A particle can break apart. The substrate is rigid and all its parts are considered as fixed. The initial temperature of a particle isT and the probability of a part to change position with an empty site is given by a Boltzmann factor
Pchange5 1
~11eDE/T!, ~2!
T being defined in terms of the interaction energy coefficient and the Boltzmann constant. Each attempt to move all the parts which belong to a particle is defined as a Monte Carlo step ~MCS!. After a fixed amount of MCSs the temperature decreasesdT, simulating the cooling of a particle and there-fore reducing the probability to move a part of a particle.
This process ends when all of the attempts to move parts of a particle in a given MCSs are unsuccessful. At this time the particle is considered as cooled and fixed and this process is repeated until all theN particles are ‘‘propelled’’ against the substrate.
Many Monte Carlo simulations usually assume the mea-sure of time in terms of MCSs. It is not the case in our model, because the MCSs in this work are related to the cooling process. It depends on the thermal properties of the substrate and of the powder, as well as on the difference in temperature between the particles and the substrate. Then, we define the time in terms of deposited particles.
The morphological features of the deposition process will be defined by three variables: the surface profile mean height, the roughness, and the porosity. The mean height is defined as
h ¯~t!5 1
Lx
(
i51L
h~i,t!, ~3!
where h(i,t) is the height of column i at time t. Theh(i) measures the height of the highest point at a givenxposition; it does not take into account the existence of holes or over-hangs in the coating. This is known as the solid on solid ~SOS!condition@7#. The roughness of the coating is defined by the rms~root mean square!fluctuation in the height:
v~L,t!5
F
1L i
(
51L
@h~i,t!2¯h~t!#2
G
1/2. ~4!
The dynamical behavior of the roughness can be obtained and compared with other growth models. Usually, two basic regimes are observed: For times t!tc the roughness in-creases as a power of time v(L,t);tb. The exponent b is called the growth exponent. For times t@tc the roughness reaches a saturation valuevs which is given byvs(L);La,
a being the roughness exponent @11#. The value of tc de-pends on the system size tc;Lz, where z is the dynamic exponent. These three scaling exponents are not independent of each other, and they obey the relation
z5a
b. ~5!
Finally, the porosity is defined in terms of the fraction of pores Fpores which is the volume occupied by the pores,
Vpores, divided by the total volume of the coating, Vt. A pore was considered as an empty and closed region within the coating. Overhangs are considered part of the empty space, although we believe they can play a strong role in the mechanical properties of real coatings.
which means that theh→2h symmetry is broken. Thus, the resulting growth process must be nonlinear, given by the Kardar-Parisi-Zhang equation @13#, instead of that linear as in the EW case@7,14#.
III. RESULTS AND DISCUSSION
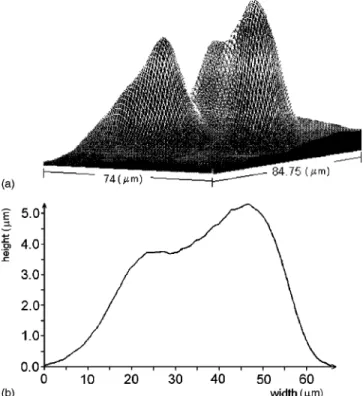
Figure 1 shows the result obtained for a deposition of five particles with different radii R514,13,18,15,18. For R513 the particle occupies 529 sites and for R518 it occupies 1009 sites. The initial temperature isT52.5 and the particle is cooled at a rate of dT50.25 per 2000 MCSs. The initial position of each particle—a circle—is shown in the sequence of snapshots. Figure 2 shows 2D profiles of the deposition of HA on Ti substrates. The profiles have been measured with a high-resolution perfilometer and we choose regions with a low density of deposited particles, in order to better compare the profile obtained with our model and those obtained ex-perimentally. Notice that the vertical and horizontal scales differ by a factor of one order of magnitude in the experi-mental case. In the snapshots shown in Fig. 1 the vertical and horizontal scales are the same.
The coating structure changes drastically as the tempera-ture changes. Figure 3~a! shows the coating obtained after deposition of 50 000 particles with R¯56 and sR53 for T
53.5 and cooling rate ofdT50.25 per 1000 MCSs. In order to avoid contact between the extremities of the coating, we used Lx56500 and choose the initial position for the center of the particles between 250 and 6250. The coating occupies a volume of Vt55.863106 sites with a fraction of pores,
Fpores50.1531022. Figures 3~b!and 3~c!show details with
2003200 sites for different temperatures T53.5 and 2.5, obtained with the same deposition conditions. ForT52.5 the interface is rougher than that obtained forT53.5. Moreover, for T52.5 the fraction of pores increases by three orders of magnitude, Fpores50.333. The porous structures of the final
coatings obtained in those simulations are shown in Fig. 4, where we plotted the size of the pores versus the number of pores with that size. While forT53.5 we observe only small pores, many pores with sizes varying up to;3.53104 sites
were obtained for T52.5. Investigations for many samples will allow us to better understand the behavior of the pore size distribution.
As a result of the basic features of the growth process, as discussed above, this model must exhibit a nonlinear growth. If the rate of change in the height—or the growth velocity
]h/]t—changes from a horizontal to a tilted substrate, one has a nonlinear growth@15#. In order to define this behavior, we calculated the growth velocity for two different tempera-turesT52.5 andT53.5 and the results are shown in Fig. 5. For each temperature ten simulations were done with a hori-zontal substrate and ten with a tilted one ~with a tilt of 2°). For temperature T52.5 we have performed ten simulations for a substrate with a tilt of 10°. The substrate has Lx
56500 and the center of the particles were chosen between 250 and 6250 as described above. The height was measured only for these 6000 sites. Since the parts of the particles can diffuse horizontally, these simulations were done without pe-riodic boundary conditions in order to avoid that for the tilted case parts of the particles turn around and change the height in the lowest region of the substrate. The common features of all simulations are 50 000 particles ofR¯56, sR
53, and rate of coolingdT50.25 per 1000 MCSs. However, our results were contrary to the expectation: It is clear in Fig. 5 that the slopes for each temperature are the same ~it was measured with five digits of precision!. Thus, the nonlinear-ity effects present in our model must be small.
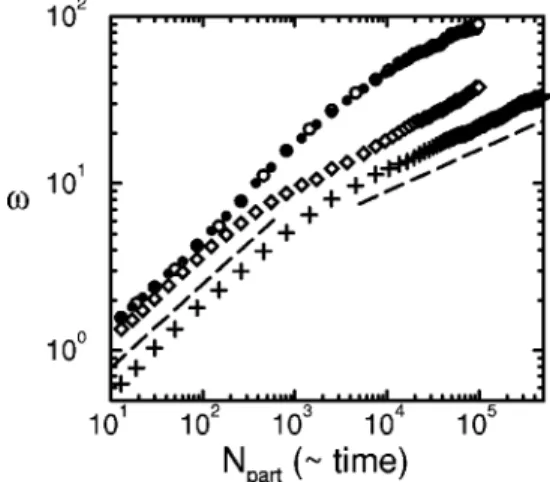
Figure 6 shows the evolution of the roughness for differ-ent temperatures and differdiffer-ent simulations. All the simula-tions assume sR53 and dT50.25 per 1000 MCSs. Each plot represents an average over different samples, described in the caption. Solid and open circles representT52.5 while FIG. 1. Deposition of five particles with different radii. In this
sampleLx5100, the initial temperature isT52.5, and the particle
is cooled at a rate of dT50.25 per 2 000 MCSs. Each snapshot captured the moment of the deposition of each particle. After cool-ing, the particle becomes rigid and belongs to the substrate. Only parts of the actual depositing particle can change places with empty sites. Time evolves from left to right and from top to bottom.
diamonds and plus signs representT53.5. ForT52.5 thev
value was calculated with 6000 sites. With periodic bound-ary conditionsLx56000 and without periodic boundary con-ditionsLx56500 but in this case only 6000 sites contribute to our calculations. As one can observe, the two cases have the same roughness and the same dynamical behavior. For
T53.5 we show results obtained with periodic boundary conditions. Diamonds represent substrates with Lx56000 with a deposition of 100 000 particles while the plus signs represent Lx525 000 with 500 000 particles. Our program spent 9 h of CPU time on an IBM 595 station to each of these biggest samples. For all the cases we have two basic behaviors: Initially we observe a noncorrelated growth with
exponent ;0.5 ~the exact value is 0.5!. At this regime the particles do not interact with each other and this short time growth process is present in all types of models. For the biggest samples we obtained 0.49. After that we have a change in the dynamical behavior. The crossover from the noncorrelated regime changes with temperature. For T52.5 andLx56000 it occurs after the deposition of;103. ForT
53.5 andLx56000 the crossover occurred after the deposi-tion of;43102 particles. The value of the growth exponent obtained for the biggest case—Lx525 000—isb50.26, near FIG. 3. ~a! Result obtained as a simulation of a 2D coating of
50 000 particles with R¯510 and sR53 on a substrate of Lx
56500 sites forT53.5.~b!2003200 detail of the coating shown in ~a!. ~c! 2003200 detail of a coating obtained forT52.5 for the same initial conditions as ~a!. In this case there are no periodic boundary conditions~see text!.
FIG. 4. Sizes of the pores distribution for the coatings shown in Fig. 3. The solid line representsT52.5 while the dashed line rep-resentsT53.5. This result was obtained as the structure at the end of deposition process.
FIG. 5. Evolution of the mean height. Time here is proportional to the number of deposited particles. Each line represents an aver-age over ten statistically independent samples. Circles represent data obtained forT52.5 and diamonds those obtained forT53.5. For each temperature the lines have the same slope~with five orders of magnitude!. Solid symbols represent data obtained for a 2° tilted substrate, while open symbols represent those obtained for a hori-zontal substrate. The solid line represents data forT52.5 and a 10° tilted substrate.
FIG. 6. Time evolution of the roughness for different deposi-tions. Circles represent results obtained for deposition with ~open! and without ~solid! periodic boundary conditions forT52.5. Ten samples of 50 000 particles were simulated for the case without periodic boundary conditions in thexdirection, while five samples of 100 000 particles for the case with periodic boundary conditions. Diamonds and the plus sign represent simulations forT53.5 both with periodic boundary conditions. For diamondsLx56000 andN
5100 000 for ten samples, and for the plus signLx525 000, N
the value expected for the linear growth, blinear50.25, and
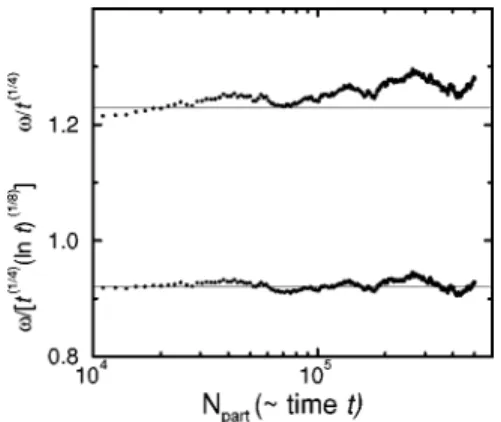
thus confirming the assumption that the nonlinearity is small. Following Subramanianet al.@16#and Binderet al.@17#we have checked for logarithmic corrections in the roughness which arise from the presence of third-order terms ~cubic terms!in the growth equation. Figure 7 shows, respectively, the values of v divided by t1/4 ~top! and v divided by
t1/4(lnt)1/8 ~bottom! as a function of timet. As cited above, time t is measured as the number of deposited particles,
Npart. We have used in this figure the value ofv correspond-ing to the biggest samples (Lx525 000 and 500 000 par-ticles!. Figure 7 shows only the portion corresponding to the correlated growth, where the growth exponent was calcu-lated. As one can observe by looking at the guidelines, a small increase in the function v/t1/4 can be observed while the curvev/t1/4(lnt)1/8follows the horizontal line and there-fore shows the need of logarithmic corrections to the power law EW behavior.
Because of computational limitations, we did not obtain a saturation in the roughness. An order of 106 particles should be used to observe the saturation of the roughness for the temperatures which we have done our simulations, since tc
;Lxz and z53/2 for nonlinear growth. Studies are in progress trying to obtain the saturation of the roughness for higher temperatures, taking into account that the crossover times ~or number of deposited particles!will be reduced.
In conclusion we introduced a model to simulate the deposition of heated particles in a rigid substrate. Initially spheric, the particles will deform after collision with the sub-strate. The particles cool and gain a permanent deformation, becoming part of the substrate. Three quantities are mea-sured in our model: the mean height, the roughness, and porous structure. The porosity changes drastically with tem-perature, yielding more compact coatings as the temperature rises. As a result of the breaking of the up-down symmetry, a nonlinear behavior was expected. The results we have tained showed that the nonlinearities are small: We have ob-tained the value of the growth exponent near that expected for linear growth, although logarithmic corrections are ap-parent for the roughness. We assumed that the effects of lattice anisotropy discussed by Manna et al.@9# are not im-portant in our simulations, basically because we worked at temperatures higher than they did. As they pointed out in their paper, by increasing the temperature this problem is reduced. Further investigation will be carried out to compare the morphological properties of plasma-deposited coatings with surfaces simulated by the computer model.
ACKNOWLEDGMENTS
We thank J. G. Moreira for fruitful discussions and sug-gestions. A.T.B. acknowledges the kind hospitality of the Departamento de Fı´sica UFMG. Simulations were done at the HP stations of the DF/UFMG, and the IBM 58H and IBM 595 stations of the LCC/UFMG. This work was par-tially supported by the Brazilian Agencies CNPq and FAPEMIG.
@1#H. Edris, D. G. McCartney, and A. J. Sturgeon, J. Mater. Sci. 32, 863~1997!.
@2#W. Tong, J. Chen, X. Li, J. Feng, Y. Cao, Z. Yang, and X. Zhang, J. Mater. Sci.31, 3739~1996!.
@3#C.-J. Li, A. Ohmori, and R. McPherson, J. Mater. Sci.32, 997 ~1997!.
@4#H. Ishizawa and M. Ogino, J. Mater. Sci.31, 6279~1996!. @5#Dynamics of Fractal Surfaces, edited by F. Family and T.
Vicsek~World Scientific, Singapore, 1991!.
@6#T. Vicsek,Fractal Growth Phenomena~World Scientific, Sin-gapore, 1992!.
@7#A.-L. Baraba´si and H. E. Stanley,Fractal Concepts in Surface Growth ~Cambridge University Press, Cambridge, England, 1995!.
@8#T. Aste, Phys. Rev. E53, 2571~1996!.
@9#S. S. Manna, H. J. Herrmann, and D. P. Landau, J. Stat. Phys. 66, 1155~1992!.
@10#P. M. C. Oliveira and T. J. P. Penna, J. Stat. Phys. 73, 789 ~1993!.
@11#J. G. Moreira, J. Kamphorst Leal da Silva, and S. Oliffson Kamphorst, J. Phys. A27, 8079~1994!.
@12#S. F. Edwards and D. R. Wilkinson, Proc. R. Soc. London, Ser. A381, 17~1982!.
@13#M. Kardar, G. Parisi, and Y.-C. Zhang, Phys. Rev. Lett. 56, 889~1986!.
@14#E. Medina, T. Hwa, M. Kardar, and Y.-C. Zhang, Phys. Rev. A 39, 3053~1989!.
@15#D. E. Wolf, inKinetics of Ordering and Growth at Surfaces, edited by M. Lagally~Plenum, New York, 1990!.
@16#B. Subramanian, G. T. Barkena, J. L. Lebowitz, and E. R. Speer, J. Phys. A29, 7475~1996!.
@17#P.-M. Binder, M. Paczuski, and M. Barma, Phys. Rev. E 49, 1174~1994!.
FIG. 7. Roughness v divided by t1/4 ~upper half! and by t1/4(lnt)1/8~lower half!versus time. The points have been averaged
over ten simulations of systems withLx525 000 andN5500 000