PHYSICAL QUALITY OF AN OXISOL AFTER DIFFERENT
PERIODS OF MANAGEMENT SYSTEMS
(1)Karina de Vares Rossetti(2), José Frederico Centurion(3) & Eurico Lucas de Sousa Neto(4)
SUMMARY
Management systems may lead to a loss of soil physical quality as a result of removal of the plant cover and excessive agricultural mechanization. The hypothesis of this study was that the soil aggregate stability, bulk density, macro- and microporosity, and the S index and saturated hydraulic conductivity may be used as indicators of the soil physical quality. The aim was to study the effects of different periods and managements on the physical attributes of a medium-textured Red Oxisol under soybean and corn for two growing seasons, and determine which layers are most susceptible to variations. A completely randomized experimental design was used with split plots (five treatments and four layers), with four replications. The treatments in 2008/09 consisted of: five years of no-tillage (NTS5), seven years of no-tillage (NTS7), nine years of no-tillage (NTS9), conventional tillage (CTS) and an adjacent area of native forest (NF). The treatments were extended for another year, identified in 2009/10 as: NTS6, NTS8, NTS10, CTS and NF. The soil layers 0-0.05, 0.05-0.10, 0.10-0.20 and 0.20-0.30 m were sampled. The highest S index values were observed in the treatment CTS in the 0-0.05 m layer (0.106) and the 0.05-0.10 m layer (0.099) in 2008/09, and in the 0-0.05 m layer (0.066) in 2009/10. This fact may be associated with soil turnover, resulting in high macroporosity in this treatment. In contrast, in the NTS, limiting macroporosity values were observed in some layers (below 0.10 m3 m-3). Highest aggregate stability as well as the highest
saturated hydraulic conductivity (Kθθθθθ) values were observed in NF in relation to
the other treatments. In 2009/10, the Kθθθθθ in NF differed only from NTS10. This
study showed that the use of the S index alone cannot be recommended as an absolute indicator of the soil physical quality, even at values greater than 0.035.
Index terms: aggregation, S index, saturated hydraulic conductivity.
(1) Part of the Master Dissertation of the first author, funded by FAPESP (nº 2008/52793-6), and presented to the Soil Science Program of the Faculdade de Ciências Agrárias e Veterinárias - FCAV/UNESP. Received for publication on October 3, 2012 and approved on August 22, 2013.
(2) Doctoral student in Agronomy, Vegetal Production, FCAV/UNESP. Prof. Donato Castellane, s/n. CEP 14884-900 Jaboticabal (SP), Brazil. CAPES fellowship. E-mail: [email protected]
(3) Adjunct Professor, Soil and Fertilization Department, FCAV/UNESP. CNPq fellowship. E-mail: [email protected] (4) Professor, Mato Grosso State University - UNEMAT. Department of Animal Production. P.O. Box 181. CEP 78250-000 Pontes
RESUMO: QUALIDADE FÍSICA DE UM LATOSSOLO SOB DIFERENTES TEMPOS E MANEJOS
Os sistemas de manejo podem ocasionar a perda da qualidade do solo, em decorrência da retirada da cobertura vegetal e do excessivo uso da mecanização. A hipótese desta pesquisa foi que a estabilidade de agregados, a densidade do solo, a macro e a microporosidade do solo, o índice S e a condutividade hidraúlica saturada pudessem ser utilizados como indicadores de qualidade física do solo. Diante disso, objetivaram-se estudar os efeitos dos diferentes tempos e manejos nos atributos físicos de um Latossolo Vermelho de textura média, cultivado por dois anos agrícolas, com soja e milho e determinar quais são as camadas mais susceptíveis a variações. O delineamento experimental foi inteiramente casualizado com parcelas subdivididas (cinco tratamentos e quatro camadas), com quatro repetições. Os tratamentos em 2008/09 foram: plantio direto por cinco anos (NTS5), plantio direto por sete anos (NTS7), plantio direto por nove anos (NTS9), preparo convencional (CTS) e área adjacente de mata nativa (NF). Os tratamentos estenderam-se para o ano de 2009/10, assim identificados: NTS6, NTS8, NTS10, CTS e NF; as camadas de solo estudadas foram: 0-0,05; 0,05-0,10; 0,10-0,20; e 0,20,30 m. Os maiores valores do índice S foram observados no CTS nas camadas de 0-0,05 (0,106) e 0-0,05-0,10 m (0,099), no ano de 2008/09; e na de 0-0-0,05 m (0,066), em 2009/10. Esse fato pode estar associado ao revolvimento, resultando em elevadas macroporosidades do solo neste tratamento. Em contraposição, no NTS, verificou-se ocorrência de valores restritivos de macroporosidade em algumas camadas (abaixo de 0,10 m3 m-3). Constatou-se que a maior
estabilidade de agregados assim como os maiores valores de condutividade hidraúlica saturada (Kθ) foram verificados na NF, em relação aos demais tratamentos; no ano de 2009/10, a Kθ na NF somente diferiu do NTS10. Pode-se afirmar com este estudo que apenas o uso do índice S não é recomendável como indicador absoluto de qualidade física do solo, mesmo tendo apresentado valores superiores a 0,035.
Termos de indexação: agregação, índice S, condutividade hidraúlica saturada.
INTRODUCTION
The time periods after the adoption of management practices promote diverse alterations in soil physical attributes, as in pore distribution, soil bulk density and aggregation, which affect the capacity for water retention and infiltration (Loss et al., 2009). The modifications in these physical attributes are more pronounced when a transition from natural environments to agricultural systems takes place, or appear during the implementation of conservation systems in substitution of conventional soil tillage systems.
It is known that the conventional tillage system, compared to the no-tillage system, reduces the aggregate stability and accelerates organic matter decomposition; however, it increases the pore volume, permeability and air flow, facilitating plant root growth in the tilled layer. Usually, these characteristics are lost when the bare soil is exposed to natural rainfall. This effect leads to disaggregation and to scattering of the soil particles through the direct impact of raindrops, which contributes to a decrease in water infiltration and surface runoff (Volk et al., 2004).
The adoption of conservation systems, e.g., no-tillage, includes the maintenance of crop residues on the soil surface, which is an influential factor for improvements in the soil structure. These improvements are reflected in water infiltration,
reduction in soil surface temperature and an increase in soil aggregate stability. However, even in the no-tillage system, the water infiltration capacity of the soil can decrease, due to particle densification and greater soil bulk density in the surface layers (Pinheiro et al., 2009).
In this respect, the impacts of management practices on soil physical quality have been quantified using physical properties related to structural shape and stability, such as aggregate stability, bulk density and soil porosity (Aratani et al., 2009). The S index, introduced in Brazil based on the work of Dexter (2004), is calculated from the water retention curve (WRC). It is a parameter that assesses the structural porosity, i.e., the microcracks, cracks, biopores and macrostructural pores resulting from land use and management; a greater S value represents a greater slope of the WRC, indicating better pore distribution and greater quantity of larger-diameter pores.
structural quality and soil tending to degradation, while S 0.025 indicates physically completely degraded soils. Nevertheless, according to Jong van Lier (2012), the analysis with the S index as an indicator of soil physical quality must be interpreted with caution since this index includes no threshold values that are independent of soil type and environment. According to this author, the use of the S index can be recommended for comparing a soil under different uses or agricultural managements within a single soil system. In addition, the development of a systematic analysis or of an index of the physical properties that may be possible indicators of the soil physical quality is also indispensable. The hypothesis of this study is that the soil aggregate stability, bulk density, macro- and microporosity, and the S index and saturated water conductivity may be used as indicators of the soil physical quality. The aim of this study was to evaluate the effects of different managements and time periods since their adoption on the physical attributes of a Red Oxisol cultivated for two years with soybean and corn, and determine which soil layers are most susceptible to variations.
MATERIALS AND METHODS
The experiment was conducted in Jaboticabal, São Paulo State, Brazil (21o 14’ 05" latitude South, 48o 17’ 09" longitude West; average altitude of 615.01 m asl). The climate in the region, according to the Köppen classification, is Cwa, with hot summers and dry winters, an average annual rainfall of 1,428 mm and average temperature of 21 oC. The soil used was a typic dystrophic Red Oxisol, medium texture, moderate A horizon, koalinitic, hypoferric, very deep and with flat to slightly undulating relief (Embrapa, 2006), with 330 g kg-1 clay, 40 g kg-1 silt and 630 g kg-1 sand in the 0-0.30 m layer (Embrapa, 2011).
Before setting up the experiment, the soil had been under a conventional tillage system for 30 years, with annual succession of corn and soybean in the summer and a second corn crop in the fall. No-tillage systems were implemented in the years 2000, 2002 and 2004, resulting in the treatments: a nine-year no-tillage system (NTS9), a seven-year no-tillage system (NTS7), and a five-year no-tillage system (NTS5) in the 2008/09 growing season. In the following year, treatments consisted of: a 10-year no-tillage system (NTS10), an eight-year no-tillage system (NTS8), and a six-year no-tillage system (NTS6) in the 2009/10 growing season. In the 2008/09 growing season, four 60 m2 plots were dedicated to conventional tillage (CTS); the other areas of the management systems were also 60 m2 plots. The CTS consisted of chisel plowing to a depth of 0.30 m, followed by heavy disking and light disking.
In November 2008, the soybean cultivar M-SOY 6101 was sown (depth 0.03 m, inter-row spacing
0.45 m). Chemical analysis of the soil was carried out according to Raij et al. (2001) and fertilization consisted of the application of 250 kg ha-1 of the N-P-K fertilizer 2-20-20 (N-P2O5-K2O) in the plots at sowing. Corn (hybrid Impacto; Syngenta©) was sown (depth 0.03 m, inter-row spacing 0.90 m), in December 2009. Fertilization consisted of the application of 300 kg ha-1 of the N-P-K fertilizer 8-20-20 (N-P2O5-K2O) in the plots at sowing. In the crop stage V6, top-dressing fertilization was carried out, consisting of 0.250 Mg ha-1 of the N-P-K fertilizer 20-0-10 (N-P2O5-K2O) applied at the soil surface along the planting line.
Samples were also removed from the different layers for chemical analysis for the determination of soil organic matter (OM), according to the method described by Raij et al. (2001).
The saturated hydraulic conductivity of the soil in the management systems was determined at four points per plot using the 2800 KI Guelph Permeameter (at a depth 0.15 m) and subjected to two hydraulic heads (0.03 and 0.06 m of water column). Readings were made by means of the water level of the column in the device and, from the moment of stabilization of the readings, the average of the last three readings was used and saturated hydraulic conductivity (Kθ) was calculated according to the equation:
Kθ = {[(0.0041) * (32.29) * (x1)]} - {[(0.0054) * (35.39) *
(x2)]} * fc (1)
in which x1 represented the average of the last three measurements (hydraulic head of the water column of 0.06 m) in cm s-1; x2, the average of the last three readings (hydraulic head of the water column of 0.03 m), in cm s-1; and fc, the conversion factor for mm h-1. The results were subjected to analysis of variance in a completely randomized design and in split-plots; and the treatments were evaluated separately in each growing season. The software ASSISTAT version 7.5 beta was used for this purpose; when significant, the mean values were compared by the Tukey test (p<0.05) (Banzatto & Kronka, 1992).
RESULTS AND DISCUSSION
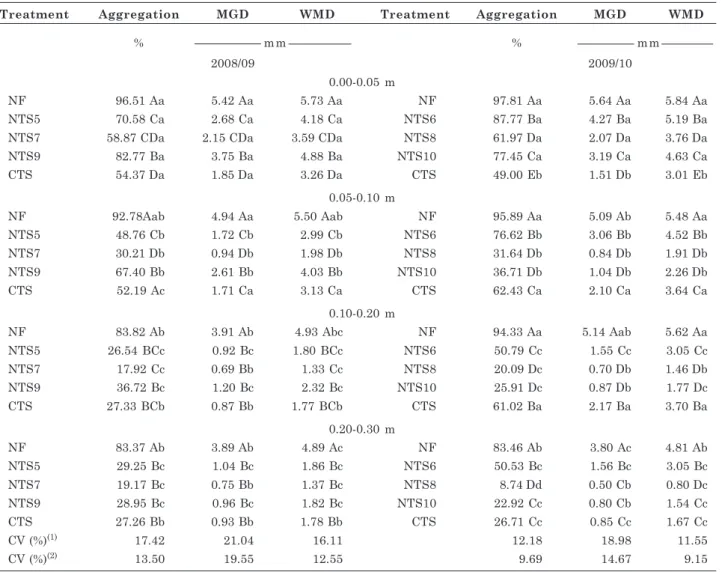
The aggregate stability determined by means of the weighted mean diameter (WMD) (Table 1) in the treatment with the longest use of no-tillage, NTS9, in 2008/09 (4.88 mm) and NTS10 in 2009/10 (4.63 mm) in the 0-0.05 m layer was not sufficient to promote the formation of larger aggregates, unlike in the soil under NF. It noteworthy that the greater the WMD index, the higher is the proportion of the major aggregate class, whereas the mean geometric diameter (MGD) represents only an estimate of the classes of greatest occurrence. In contrast, Assis & Lanças (2010) stated that the distribution of soil aggregates in a no-tillage system (12 years) was closest to that of soil under native forest. Soil aggregation under conventional tillage was in some cases similar to no-tillage in all layers evaluated in 2008/09, contradicting the studies of Aratani et al. (2009), who observed a more pronounced positive effect of no-tillage over conventional tillage. The WMD in the 0-0.05 m layer in the CTS was lower than in NTS only in the summer corn crop (2009/10). In this case, it can be affirmed that the greater disaggregation in CTS is due to the fact that, in tilled soils, aggregates are often exposed to physical disaggregation due to climate changes (wetting and drying processes), raindrop impact or to the activity of farm implements.
The soil managements led to decreases in the aggregation rates in all layers evaluated in both crop years, proving the loss of aggregate stability due to agricultural use in relation to native forest (NF) (Table 1). This was in agreement with the study of Silva et al. (2008), who observed that in all layers (0-0.10, 0.10-0.20 and 0.20-0.30 m) the WMD was greater under NF than in areas under no-tillage. These results are similar to those found by Coutinho et al. (2010), who observed that, regardless of the depth in an Oxisol, the stability indices of WMD and MGD of the water-stable aggregates were highest in a cerrado area that had been gradually restored for 15 years after its use as pasture and was assumed as native. According to these authors, this behavior results from the greater input of plant material in that area, resulting in an increase in soil OM contents and, consequently, increased soil aggregation. Our results disagree with that study since, in the surface layer (0-0.05 m), the MGD and WMD indices in the NTS7 and in the NTS8 were similar to conventional tillage. This trend was also observed in the other soil layers, regardless of the crop year.
This behavior is thus opposed to the study of Hickmann et al. (2011) who reported that the no-tillage system increases aggregate stability in water since the MGD and WMD were superior in relation to the conventional tillage system. Organic matter and root development are the main agents responsible for the formation of larger aggregates (Salton et al., 2008); nevertheless, the stability of the aggregates is related to the cohesion among the soil particles. Thus, larger-sized aggregates may be obtained in some cases by the action of compression forces through the biological activity of roots and microorganisms (Carpenedo & Mielniczuk, 1990).
The OM contents of the no-tillage system (2008/09) in the 0-0.10 m layer (Table 2) were lower than in the NF, with exception of NTS9 in the 0.05-0.10 m layer. It was observed that in the surface layer of the no-tillage systems in 2009/10, the OM contents were maintained in relation to 2008/09. However, in this sequence of comparison, a reduction in the soil OM contents can be observed in the 0.05-0.10 m layer. Thus, it becomes evident that the no-tillage systems were not efficient in increasing the OM content because, NTS5, NTS7 and NTS9 were similar to NTS6, NTS8 and NTS10 in the soil surface layer, respectively, in 2009/10. This is in contrast with the study of Costa Jr. et al. (2012), who observed a more significant contribution to carbon accumulation under NTS in the 0-5 cm soil layer. In the context of these authors, this is possibly due to the greater contact with the crop residues left on the surface, which are a source of organic matter in the soil.
over the years since soil turnover in conventional tillage favors the microbial decomposition of OM through increasing aeration and temperature, as well as the fractionation and mixture of plant residues with the soil. It may be observed that the percentage of aggregates with a diameter greater than 2.00 mm in the 0-0.10 m layer in 2008/09 was greater after nine years of no-tillage (NTS9), due to the higher contribution of OM contents than in the other periods of no-tillage. Nevertheless, in the 2009/10 growing season, the percentage of aggregates with a diameter greater than 2.00 mm decreased from NTS9 to NTS10 at this depth. This behavior in the 0-0.05 m layer may be explained by the rupture of the aggregates because of machine traffic at sowing and harvest, since
the OM contents in NTS9 and NTS10 were maintained. The explanation for the percentage of aggregate diameter greater than 2.00 mm in the 0.05-0.10 m layer is the decreased MO content.
In general, considering the variables aggregate percentage > 2.00 mm, MGD and WMD, the aggregate stability was generally greater under NF in relation to the other treatments. For their part, the NTS treatments, especially the NTS9 (2008/09), tended to greater MGD and WMD in relation to the CTS in the 0-0.10 m layer (Table 1). In other words, in this layer, soil turnover reduces aggregate stability. These variables thereby allowed the systems to be qualified from the point of view of aggregate stability, i.e., analyze the variables as indicators of the physical
Treatment Aggregation MGD WMD Treatment Aggregation MGD WMD
% m m % m m
2008/09 2009/10
0.00-0.05 m
NF 96.51 Aa 5.42 Aa 5.73 Aa NF 97.81 Aa 5.64 Aa 5.84 Aa
NTS5 70.58 Ca 2.68 Ca 4.18 Ca NTS6 87.77 Ba 4.27 Ba 5.19 Ba
NTS7 58.87 CDa 2.15 CDa 3.59 CDa NTS8 61.97 Da 2.07 Da 3.76 Da
NTS9 82.77 Ba 3.75 Ba 4.88 Ba NTS10 77.45 Ca 3.19 Ca 4.63 Ca
CTS 54.37 Da 1.85 Da 3.26 Da CTS 49.00 Eb 1.51 Db 3.01 Eb
0.05-0.10 m
NF 92.78Aab 4.94 Aa 5.50 Aab NF 95.89 Aa 5.09 Ab 5.48 Aa
NTS5 48.76 Cb 1.72 Cb 2.99 Cb NTS6 76.62 Bb 3.06 Bb 4.52 Bb
NTS7 30.21 Db 0.94 Db 1.98 Db NTS8 31.64 Db 0.84 Db 1.91 Db
NTS9 67.40 Bb 2.61 Bb 4.03 Bb NTS10 36.71 Db 1.04 Db 2.26 Db
CTS 52.19 Ac 1.71 Ca 3.13 Ca CTS 62.43 Ca 2.10 Ca 3.64 Ca
0.10-0.20 m
NF 83.82 Ab 3.91 Ab 4.93 Abc NF 94.33 Aa 5.14 Aab 5.62 Aa
NTS5 26.54 BCc 0.92 Bc 1.80 BCc NTS6 50.79 Cc 1.55 Cc 3.05 Cc
NTS7 17.92 Cc 0.69 Bb 1.33 Cc NTS8 20.09 Dc 0.70 Db 1.46 Db
NTS9 36.72 Bc 1.20 Bc 2.32 Bc NTS10 25.91 Dc 0.87 Db 1.77 Dc
CTS 27.33 BCb 0.87 Bb 1.77 BCb CTS 61.02 Ba 2.17 Ba 3.70 Ba
0.20-0.30 m
NF 83.37 Ab 3.89 Ab 4.89 Ac NF 83.46 Ab 3.80 Ac 4.81 Ab
NTS5 29.25 Bc 1.04 Bc 1.86 Bc NTS6 50.53 Bc 1.56 Bc 3.05 Bc
NTS7 19.17 Bc 0.75 Bb 1.37 Bc NTS8 8.74 Dd 0.50 Cb 0.80 Dc
NTS9 28.95 Bc 0.96 Bc 1.82 Bc NTS10 22.92 Cc 0.80 Cb 1.54 Cc
CTS 27.26 Bb 0.93 Bb 1.78 Bb CTS 26.71 Cc 0.85 Cc 1.67 Cc
CV (%)(1) 17.42 21.04 16.11 12.18 18.98 11.55
CV (%)(2) 13.50 19.55 12.55 9.69 14.67 9.15
Table 1. Percentage of water-stable aggregates > 2.00 mm (Aggregation), mean geometric diameter (MGD) and weighted mean diameter (WMD) in four layers of a Red Oxisol, after different management periods and under native forest
quality of the soil. In this aspect, according to all the results mentioned previously, it may be affirmed that the 0-0.10 m layer was the most susceptible to evaluate alterations in these variables in this soil.
In the 2008/09 growing season, the macroporosity of NTS7 and the NTS9, in the 0-0.05 and 0.05-0.10 m layers, respectively, were similar to the CTS and the NF. However, in the 2009/10 growing season in the same areas, when they were denominated NTS8 and NTS10, a decline was observed in the NTS8, and the NTS10 maintained the volume of macropores in comparison to the previous growing season in the same layers (Table 3). According to Cunha et al. (2007), soil porosity in the no-tillage system may be favored by rotations that include a greater number of soybean crops.
The macroporosity in the 0-0.10 m layer of NTS5 (0.095 and 0.090 m3 m-3), in the 0-0.05 m and 0.10-0.30 m layers of NTS9 (0.083, 0.097 and 0.067 m3 m-3), and in the 0.05-0.10 m layer of NTS7 (0.086 m3 m-3) in the 2008/09 growing season was near 0.10 m3 m-3, the minimum adequate for the liquid and gas exchanges between the external environment and the soil, and that considered critical for root growth of most crops (Baver et al., 1972). The NTS8 in the layer 0-0.05 m (0.082 m3 m-3) and NTS10 in the 0.05-0.10, 0.10-0.20 and 0.20-0.30 m layers (0.085, 0.084 and 0.091 m3 m-3, respectively) in the 2009/10 growing season are also near this critical volume of macroporosity. Thus, when the NTS9 treatment came to be NTS10 in the 2009/10 growing season, a reduction was observed in the interval from 0.05 to 0.20 m depth in terms of soil macroporosity, however, with no significant difference for the 0.10-0.20 m layer.
According to Silva et al. (2005), soil turnover normally promotes a temporary increase of macroporosity when compared to the no-tillage system. Nevertheless, the same authors claim that this effect is eliminated by the reconsolidation or densification
of the soil. Greater microporosity (Table 3) was recorded in the soil under NTS9 and NTS5 in the 0-0.30 m layer in comparison to the NTS7 (2008/09 growing season) because, according to Reichert et al. (2007), the macropores, responsible for soil aeration, shrink during soil densification and are replaced by micropores. The lower micropore volume in the 2008/09 growing season of the NTS7, in the 0-0.05 m and 0.10-0.30 m layers, led to an increase in soil microporosity when it came to be NTS8 in the 2009/10 growing season.
Soil bulk density in the 0-0.05 m layer of the CTS was significantly lower than in the no-tillage system; however, it did not differ from the NTS7 (2008/09 growing season). However, in the corn succession cycle in the following year, the CTS showed similar behavior and was inferior only to NTS8 in comparison to the other no-tillage treatments. According to Silva et al. (2005), greater BD in the surface layer of the no-tillage system in relation to the CTS are often observed and are due to densification as a result of the lack of turnover, as well as the compaction induced by machine traffic. A similar fact was reported in a study of Tavares Filho et al. (2012), where the BD of an Alfisol in an 11-year no-tillage management was 4.2 % greater in relation to no-tillage management with chisel plowing every four years. The treatment with chisel plowing provided a 40.8 % greater macroporosity than the treatment with only no-tillage. This behavior was also mentioned by Tavares Filho et al. (2006) in an analysis of the effects of chisel plowing on the physical properties of a dystroferric Red Oxisol under no-tillage for more than 20 years. However, according to Silva et al. (2012), the beneficial effect of chisel plowing in reducing BD is of a temporary nature because it was observed that after six months of CTS, soil BD increased by 20 % and this behavior remained stable in the following year, tending to a stabilized state.
Layer
Organic matter
2008/09 2009/10
NF NTS5 NTS7 NTS9 CTS NF NTS6 NTS8 NTS10 CTS
m
0.00-0.05 33.0 Aa 16.5 Ca 17.5 Ca 23.5 Ba 16.5 Ca 28.3 Aa 19.0 Ca 19.0 Ca 24.3 Ba 13.8 Dab 0.05-0.10 26.0 Ab 12.5 Bab 15.5 Bab 22.0 Aa 16.5 Ba 23.5 Ab 12.8 Cb 12.8 Cb 17.0 Bb 14.0 BCa 0.10-0.20 17.5 Ac 12.0 Bb 16.5 ABab 17.5 Ab 14.5 ABa 18.5 Ac 12.1 Bb 11.6 Bb 12.3 Bc 12.3 Bab 0.20-0.30 16.0 Ac 10.5 Bb 13.0 ABb 15.5 ABb 12.5 ABa 13.6 Ad 12.5 ABb 9.0 Bc 11.1 ABc 11.4 ABb
CV(1) = 13.72 % CV(2) = 8.06 % CV(1) = 19.20 % CV(2) = 8.80 %
Table 2. Organic matter content in four layers of a Red Oxisol after different management periods and under native forest
Thus, it can be seen that conventional tillage (CTS) raised macroporosity to values above 0.10 m3 m-3 (Table 3), which are similar results to those of native forest (NF). On the one hand, MGD and WMD were lower under conventional tillage, especially when compared to NTS9 (2008/09) and NTS6 (2009/10) in the 0-0.10 m layer, probably leading to clod breaking and cutting of remaining roots (Table 1). On the other hand, it induced decompaction, leading to macroporosity at adequate levels. Therefore, based on the results of the variables soil BD and macro- and microporosity, their use as indicators of soil physical quality can be confirmed. The entire depth range assessed in this study, i.e., the soil layer from 0-0.30 m, was relevant for identifying the susceptibility of these variables under the experimental
conditions, especially when considering that critical values of macroporosity near 0.10 m3 m-3 were diagnosed throughout this layer.
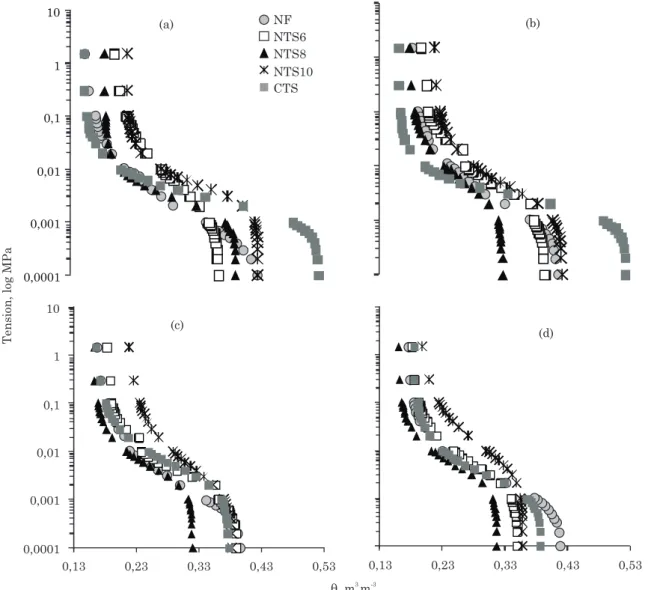
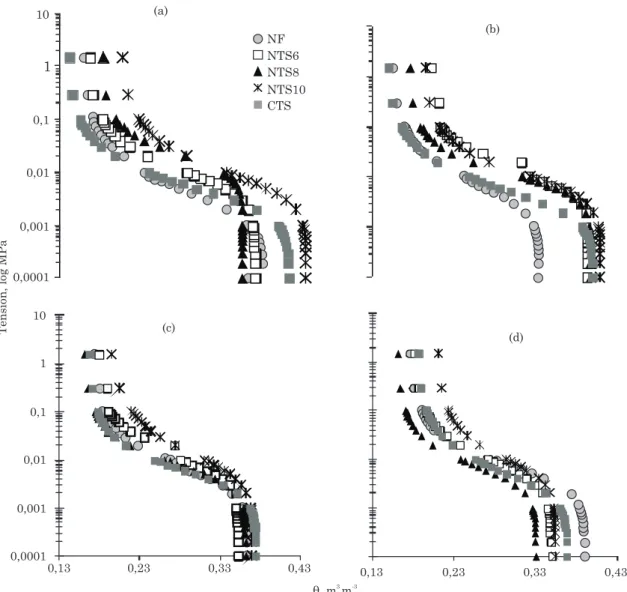
Water retention (WRC) was highest in all layers in NTS9 and NTS10, respectively, in the 2008/09 and 2009/10 growing seasons at tensions above 0.006 MPa (Figures 1 and 2). The reason for this was the high microporosity in this treatment (Table 3), in agreement with Araújo et al. (2004), who found an increase in BD and, consequently, an increase in water retention, i.e., a change in the distribution of pore sizes, favoring smaller-diameter pores. This result was also reported by Betioli Jr. et al. (2012), who observed that the WRC was significant and positively influenced by the BD of a Red Oxisol after 30 years under no-tillage.
Treatment Mac Mic BD Treatment Mac Mic BD
m3 m-3 Mg m-3 m3 m-3 Mg m-3
2008/09 2009/10
0.00-0.05 m
NF 0.212 Aa 0.238 BCb 1.30 Db NF 0.316 Aa 0.257 Cc 1.16 Cc
NTS5 0.095 Ba 0.277 Aa 1.69 Aa NTS6 0.179 Ba 0.301 Ba 1.54 Bb
NTS7 0.179 Aa 0.227 Cb 1.50 BCb NTS8 0.082 Ca 0.345 Aa 1.76 Aa
NTS9 0.083 Ba 0.304 Aa 1.60 ABa NTS10 0.117 BCa 0.351 Aa 1.61 ABb
CTS 0.234 Aa 0.251 Ba 1.39 CDa CTS 0.267 Aa 0.260 Cb 1.42 Bb
0.05-0.10 m
NF 0.178 Aab 0.247 Cab 1.46 Ca NF 0.234 Ab 0.270 Cbc 1.38 Bb
NTS5 0.090 Ba 0.275 Aa 1.66 ABa NTS6 0.103 Bb 0.325 ABa 1.77 Aa
NTS7 0.086 Bb 0.253 BCa 1.75 Aa NTS8 0.124 Ba 0.302 BCb 1.82 Aa
NTS9 0.126 ABa 0.288 Ab 1.55 BCa NTS10 0.085 Ba 0.346 Aa 1.76 Aa
CTS 0.190 Aab 0.264 Ba 1.45 Ca CTS 0.224 Aa 0.267 Cab 1.53 Ab
0.10-0.20 m
NF 0.150 Aab 0.252 Ba 1.53 Aa NF 0.145 Ac 0.306 ABa 1.62 Aa
NTS5 0.120 Aa 0.260 Ba 1.58 Aa NTS6 0.106 Ab 0.302 ABa 1.76 Aa
NTS7 0.111 Aab 0.235 Cb 1.66 Aa NTS8 0.141 Aa 0.279 Bb 1.75 Aa
NTS9 0.097 Aa 0.300 Aa 1.56 Aa NTS10 0.084 Aa 0.331 Aa 1.76 Aa
CTS 0.150 Ab 0.257 Ba 1.52 Aa CTS 0.148 Ab 0.291 Bab 1.69 Aa
0.20-0.30 m
NF 0.125 ABb 0.257 BCa 1.56 ABa NF 0.180 Abc 0.297 ABab 1.58 Ba
NTS5 0.107 ABa 0.268 Ba 1.60 ABa NTS6 0.131 ABab 0.299 ABa 1.72 ABa
NTS7 0.109 ABab 0.228 Cb 1.68 Aa NTS8 0.138 ABa 0.277 Bb 1.79 Aa
NTS9 0.067 Ba 0.317 Aa 1.60 ABa NTS10 0.091 Ba 0.329 Aa 1.74 ABab
CTS 0.173 Aab 0.249 Ba 1.48 Ba CTS 0.147 ABb 0.299 ABa 1.71 ABa
CV (%)(1) 22.39 14.05 16.04 19.84 17.08 18.28
CV (%)(2) 24.36 17.15 14.13 18.50 16.19 14.80
Table 3. Macroporosity (Mac), microporosity (Mic) and bulk density (BD) in four layers of a Red Oxisol after different management periods and under native forest
According to Reichert et al. (2007), an increase in microporosity makes the soil more efficient in water retention, while an increase in the proportion of macroporosity is responsible for aeration and water drainage. Beutler et al. (2002), studying water retention in Oxisols under different land use and management systems, observed greater retention at all soil water tensions of the cultivated soil in comparison to soil under NF. Likewise, Silva et al. (2008) confirmed that water retention in the PD6>NF>PD4>PD2 in the 0-0.30 m layer followed the same decreasing order in terms of soil microporosity. When soil dries, the mass of solids per unit of area increases, expressed by the increase in BD, which contributed to the increase in moisture due to greater water adsorption and greater volume of pores with reduced diameter (Blainski et al., 2009). In general, the S index (Table 4) increased from the 2008/09 growing season (NTS5, NTS7 and NTS9)
to the 2009/10 growing season (NTS6, NTS8 and NTS10) in all layers, with the exception of the 0.10-0.20 m layer when the NTS5 and the NTS6 are compared, and also in the 0-0.05 m layer when comparing NTS7 with NTS8 and NTS9 with NTS10. It may thus be affirmed that in these periods, the maintenance of macroporosity (0.05-0.30 m) and of organic matter (0-0.05 and 0.20-0.30 m), may have been responsible for an improved soil structure, which in turn contributed positively to the S index. It may be seen that the increase in the period of adoption of the no-tillage system, together with the repetitive effect of machine traffic, had no negative effect on the soil structure. In a similar situation, Cavalieri et al. (2009) affirmed that the soil structure was well-preserved after 14 years of no-tillage in a Rhodic Ferrasol.
The greatest values of the S index were observed in the CTS in the 0-0.05 m layer (0.106) and 0.05-0,0001
0,001 0,01 0,1 1 10
NF NTS6 NTS8 NTS10 CTS
0,0001 0,001 0,01 0,1 1 10
0,13 0,23 0,33 0,43 0,53 0,13 0,23 0,33 0,43 0,53
(a) (b)
(c)
(d)
θ, m m3 -3
Tension, log MPa
0.10 m layer (0.099) in the 2008/09 growing season, and in the 0-0.05 m layer (0,066) in 2009/10. This fact may be associated with soil turnover, resulting in high macroporosity in this treatment. Also, a reduction in the S index was observed at greater depth, with the exception of the 0.10-0.30 m layer in the 2009/10 growing season. This shows that the 0-0.05 m layer probably has better physical conditions for root growth. In some layers of certain treatments, most of the values of the S index were greater 0.035, a value considered a threshold between soil with degraded and with non-degraded physical structure (Dexter, 2004). This result agrees with the findings of Angelotti Netto et al. (2007), in a Red Oxisol under different land use and management systems. They noted that this behavior was observed in a clayey Red Oxisol, even when exposed to the loss of physical quality due to machine and equipment traffic. Most values were 0.045, a limit considered the most
adequate for tropical soils, according to Andrade & Stone (2009).
In contrast, Tormena et al. (2008), evaluating the S index under no-tillage and conventional tillage in a Typic Hapludox, in the row and between rows of corn, reported that the values of this index are greatest under no-tillage and in the plant row. The same authors concluded that the S index decreases as BD increases. In another situation, Streck et al. (2008) confirmed that the S index was greater in soil under forest cover than in a no-tillage system. According to these authors, the greater S value in the forest indicates a better pore distribution and, therefore, less physical restrictions to root growth, be it through aeration or mechanical restriction or through variables of water retention. This is in agreement with Silva et al. (2008) and Cunha et al. (2012), who also observed that the soil under native forest has a better structural quality than cultivated soil.
0,0001 0,001 0,01 0,1
1
10
NF NTS6 NTS8 NTS10 CTS (a)
(b)
0,0001 0,001 0,01 0,1 1 10
0,13 0,23 0,33 0,43 0,13 0,23 0,33 0,43
(c)
(d)
θ, m m3 -3
Tension, log MPa
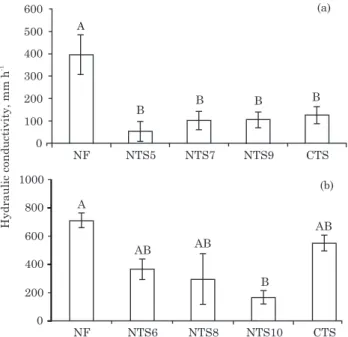
The analysis by the S index requires some caution because in our study, after observing the total mean values of each treatment (Table 4), the cropped area was indicated as having better quality, even better that the proper native forest area. In 2008/09, the following decreasing order of this index was found: CTS > NF > NTS9 > NTS7 > NTS5. In 2009/10 it was: CTS > NTS8 = NTS10 > NTS6. This behavior indicates that the mean value of the S index of CTS in 2008/09 resulted in a value 4.84 times greater than that of NF and, in 2009/10, this comparison value was 1.12 times greater. As this index has no physical significance and is always presented without a physical unit, these results would allow the conclusion that the conventional system is the one with the best quality, even better than native forest, contradicting the general understanding of this matter. This shows that the absolute quality indicator (S index) was insufficient to describe the system, so that another indicator was needed for interpretation -macroporosity. This reaffirms the warning of Jong van Lier (2012) that the S index must be applied with caution. According to this author, the value of this index as an indicator, in absolute terms, does not determine the physical quality of a soil. Since in order to obtain the S index it is necessary to determine the soil moisture curve, fit the van Genuchten equation, and obtain the second derivative, a simpler route is suggested, which is the determination of soil porosity. Greater values of Kθ were obtained in the soil under NF and, in the 2009/10 growing season, NF only differed from NTS10 (Figure 3), agreeing with the results of Stone et al. (2002), who attributed this to the greater number of pores in NF. The same authors observed that the reducing effect of compaction on the size of the pores that transport water explains the reduction of Kθ with the increase of BD. Similarly, Fontenele et al. (2009) reported that
the water infiltration rate in a Yellow Oxisol in native cerrado was around four times greater (356.0 mm h-1) than in a three-year no-tillage system under soybean in the summer (86.7 mm h-1), and six times in relation to conventional soil tillage (57.3 mm h-1). According to these authors, this behavior may be explained by the lower BD in the native cerrado and greater stability of aggregation due to the maintenance of the original structure, with a greater quantity of macroaggregates. The water infiltration rate in the soil is extremely important because greater infiltration contributes to reduce the surface runoff, avoiding the occurrence of soil erosion. According to Reichardt & Timm (2012), saturated hydraulic conductivity of the soil (Kθ) varies greatly from soil to soil and even within the same soil class, depending on the porous space. Thus, this variation may be caused by an external charge/load and may change the soil structure, or through the effect of the expansivenesss of clays or densification of the soil layers brought about by the finer particles conducted by water movement (Bear, 1979).
In another situation, Castro et al. (2009) concluded that eight years of NTS under corn induced a greater Kθ, to a depth of 0.20 m in a Rhodic Hapludox, due to greater pore continuity in this system when compared to conventionally tilled systems. This behavior was also reported by Silva et al. (2012), who observed that a treatment of 18 years of no-tillage alfalfa-corn rotation increased the hydraulic conductivity in a Oxisol in the 0.05-0.10 m layer (170 mm h-1) and 0.10-0.20 m layer (147 mm h-1). According to these authors, the results were consistent with the macroporosity data and with possible beneficial effects on soil water infiltration and reduction of surface runoff.
Nevertheless, no differences were observed in Kθ within the CTS and the different time periods of
Layer
S index
2008/09 2009/10
NF NTS5 NTS7 NTS9 CTS NF NTS6 NTS8 NTS10 CTS
m
0.00-0.05 0.049 Ba 0.020 Cb 0.047 Ba 0.047 Ba 0.106 Aa 0.054 Ba 0.049 Ba 0.041 Ba 0.050 Ba 0.066 Aa
0.05-0.10 0.086 Ba 0.030 Ca 0.021 Dc 0.037 Cb 0.099 Ab 0.036 Bb 0.038 ABb 0.046 Aab 0.047 Aa 0.049 Ab
0.10-0.20 0.036 Bd 0.031 BCa 0.031 BCb 0.027 Cc 0.043 Ac 0.039 ABb 0.034 ABb 0.041 Aab 0.034 Bb 0.048 ABa
0.20-0.30 0.070 Ab 0.027 CDa 0.030 Cb 0.023 Dc 0.044 Bc 0.051 Aa 0.032 Bb 0.037 Bb 0.033 Bb 0.039 Ba
Mean 0.060 0.027 0.032 0.033 0.292 0.045 0.038 0.041 0.041 0.050
CV(1) = 19.75 % CV(2) = 9.98 % CV(1) = 18.61 % CV(2) = 13.06 %
Table 4. S Index of the Red Oxisol according to periods of managements and native forest, in four layers
no-tillage adoption in the two growing seasons (Figure 3). However, the absolute hydraulic conductivity was higher in NTS6, NTS8 and CTS in 2009/10 than in the previous growing season, i.e., similar conditions as of NF. In a Red Yellow Oxisol, Silva & Kato (1997) found important differences in saturated hydraulic conductivity between no-tillage and conventional management, showing that small differences in macroporosity were accompanied by large differences in Kθ. In a Rhodic Ferralsol under conventional tillage, Cássaro et al. (2011) observed that principally this management promoted the greatest modifications in WRC in the soil surface. The same authors affirmed that this behavior shows that it is easier to remove water from the surface than from the subsurface layer.
CONCLUSIONS
1. Distinct time periods since the application of soil managements can be differentiated by the variables saturated hydraulic conductivity, aggregate stability, bulk density, and macro- and microporosity, which proved effective as indicators of the soil physical quality of the soil.
2. In this study, the use of the S index alone is not recommended as an exclusive indicator of soil physical quality as it is insufficient to discriminate the treatments because another indicator, such as macroporosity, was necessary for the interpretation, even though the S index was greater than 0.035.
ACKNOWLEDGEMENT
The authors wish to thank the Fundação de Amparo à Pesquisa do Estado de São Paulo (FAPESP) for a postgraduate scholarship to the first author.
LITERATURE CITED
ANDRADE, R.S. & STONE, L. Índice S como indicador da qualidade física de solos do cerrado brasileiro. R. Bras. Eng. Agríc. Amb., 13:382-388, 2009.
ANGELOTTI NETTO, A.; FERNANDES, E.J. & CENTURION, J.F. Propriedades físicas e indicador de qualidade de um Latossolo Vermelho submetido a diferentes sistemas de uso e manejo. Irriga, 12:27-37, 2007.
ARATANI, R.G.; FREDDI, O.S.; CENTURION, J.F. & ANDRIOLI, I. Qualidade física de um Latossolo Vermelho acriférrico sob diferentes sistemas de uso e manejo. R. Bras. Ci. Solo, 33:677-687, 2009.
ARAÚJO, M.A.; TORMENA, C.A. & SILVA, A.P. Propriedades físicas de um Latossolo Vermelho distrófico cultivado e sob mata nativa. R. Bras. Ci. Solo, 28:337-345, 2004. ASSIS, R.L. & LANÇAS, K.P. Agregação de um Nitossolo
Vermelho distroférrico sob sistemas de plantio direto, preparo convencional e mata nativa. Eng. Agríc., 30:58-66, 2010.
BANZATTO, D.A. & KRONKA, S.N. Experimentação agrícola. 2.ed. Jaboticabal, FUNEP, 1992. 247p.
BAVER, L.D.; GARDNER, W.H.; GARDNER, W.R. Soil physics. 4.ed. New York, John Wiley & Sons, 1972. 529p. BEAR, J. Hydraulics of groundwater. New York, Mc
Graw-Hill, 1979. 569 p.
BETIOLI JR, E.; MOREIRA, W.H.; TORMENA, C.A.; FERREIRA, C.B.; SILVA, A.P. & GIAROLA, N.F.B. Intervalo hídrico ótimo e grau de compactação de um Latossolo Vermelho após 30 anos sob plantio direto. R. Bras. Ci. Solo, 36:971-982, 2012.
BEUTLER, A.N.; CENTURION, J.F.; SOUZA, Z.M.; ANDRIOLI, I. & ROQUE, C.G. Retenção de água em dois tipos de Latossolos sob diferentes tipos de uso. R. Bras. Ci. Solo, 26:829-834,2002.
BLAINSKI, E.; GONÇALVES, A.C.A.; TORMENA, C.A.; FOLEGATTI, M.V. & GUIMARÃES, R.M.L. Intervalo hídrico ótimo num Nitossolo Vermelho distroférrico irrigado. R. Bras. Ci. Solo, 33:273-281, 2009.
A
B B B
B
0 100 200 300 400 500 600
NF NTS5 NTS7 NTS9 CTS
A
AB AB
B
AB
0 200 400 600 800 1000
NF NTS6 NTS8 NTS10 CTS
Hydraulic conductivity, mm h
-1
(a)
(b)
BLAKE, G.R. & HARTGE, K.H. Particle density. In: KLUTE, A, ed. Methods of soil analysis: Physical and mineralogical methods. 2.ed. Madison, American Society of Agronomy, 1986. p.377-382.
CARPENEDO, V. & MIELNICZUK, J. Estado de agregação e qualidade de agregados de Latossolos Roxos, submetidos a diferentes sistemas de manejo. R. Bras. Ci. Solo, 14:99-105, 1990.
CÁSSARO, F.A.M.; BORKOWSKI, A.K.; PIRES, F.L.; ROSA, A. & SAAB, S.C. Characterization of a Brazilian clayey soil submitted to conventional and no-management practices using pore size distribution analysis. Soil Till. Res., 111:175-179, 2011.
CASTRO, O.M.; VIEIRA, S.R.; SIQUEIRA, G.M. & ANDRADE, C.A. Atributos físicos e químicos de um Latossolo Vermelho eutroférrico sob diferentes sistemas de preparo. Bragantia, 68:1047-1057, 2009.
CAVALIERI, K.M.V.; SILVA, A.P.; TORMENA, C.A.; LEÃO, T.P.; DEXTER, A.R. & HAKANSSON, I. Long-term effects of no-tillage on dynamics soil physical properties in a Rhodic Ferrasol in Paraná, Brazil. Soil Till. Res., 103:158-164, 2009.
CIOTTA, M.N.; BAYER, C.; ERNANI, P.R.; FONTOURA, S.M.V.; ALBUQUERQUE, J.A. & WOBETO, C. Acidificação de um Latossolo sob plantio direto. R. Bras. Ci. Solo, 26:1055-1064, 2002.
COSTA JR, C.; PÍCCOLO, M.C.; SIQUEIRA NETO, M.; CAMARGO, P.B.; CERRI, C.C. & BERNOUX, M. Carbono em agregados do solo sob vegetação nativa, pastagem e sistemas agrícolas no bioma cerrado. R. Bras. Ci. Solo, 36:1311-1321, 2012.
COUTINHO, F.S.; LOSS, A.; PEREIRA, M.G.; RODRIGUES JÚNIOR, D.J. & TORRES, J.L.R. Estabilidade de agregados e distribuição do carbono em Latossolo sob sistema plantio direto em Uberaba, Minas Gerais. Comunicata Sci., 2:100-105, 2010.
CUNHA, E.Q.; BALBINO, L.C.; STONE, L.F.; LEANDRO, W.M. & OLIVEIRA, G.C. Influência de rotações de culturas nas propriedades físico-hídricas de um Latossolo Vermelho em plantio direto. Eng. Agríc., 27:665-674, 2007. CUNHA, E.Q.; STONE, L.F.; FERREIRA, E.P.B.; DIDONET, A.D. & MOREIRA, J.A.A. Atributos físicos, químicos e biológicos de solo sob produção orgânica impactados por sistemas de cultivo. R. Bras. Eng. Agríc. Amb., 16:56-63, 2012.
DANIELSON, R.E. & SUTHERLAND, P.L. Porosity. In: KLUTE, A., ed. Methods of soil analysis. 2.ed. Madison, American Society of Agronomy, 1986. Part 1. p.443-461. DEXTER, A.R. Soil physical quality: Part I. Theory. Effects of soil texture, density, and organic matter, effects on root growth. Geoderma, 120:201-214, 2004.
EMPRESA BRASILEIRA DE PESQUISA AGROPECUÁRIA -EMBRAPA. Centro Nacional de Pesquisas de Solos. Manual de métodos de análises de solo. 2.ed. Rio de Janeiro, Embrapa Solos, 2011. 230p. Available: <http:// www.cnps.embrapa.br/publicacoes/>. Accessed: Mar. 03, 2012.
EMPRESA BRESILEIRA DE PESQUISA AGROPECUÁRIA -EMBRAPA. Sistema brasileiro de classificação de solos. Rio de Janeiro, Embrapa Solos, 2006. 306p.
FONTENELE, W.; SALVIANO, A.A.C. & MOUSINHO, F.E.P. Atributos de um Latossolo Amarelo sob sistemas de manejo no cerrado piauiense. R. Ci. Agron., 40:194-202, 2009.
HICKMANN, C.; COSTA, L.M.; SCHAEFER, C.E.G.R. & FERNANDES, R.B.A. Morfologia e estabilidade de agregados superficiais de um Argissolo Vermelho-Amarelo sob diferentes manejos de longa duração e mata atlântica secundária. R. Bras. Ci. Solo, 35:2191-2198, 2011.
Jong van LIER, Q. Índice ¨S¨: Um indicador da qualidade física do solo? B. Inf. Soc. Bras. Ci. Solo, 1:24-27, 2012. KEMPER. W.D. & CHEPIL, W.S. Size distribution of
aggregates. In: BLACK, C.A., ed.Methods of soil analysis. Madison, American Society of Agronomy, 1965. Part 1. p.499-510.
KLUTE, A. Water retention: Laboratory methods. In: KLUTE, A., ed. Methods of soil analysis. 2.ed. Madison, American Society of Agronomy, 1986. Part. 1. p.635-662.
LOSS, A.; PEREIRA, M.G.; SCHULTZ, N.; ANJOS, L.H.C. & SILVA, E.M.R. Atributos químicos e físicos de um Argissolo Vermelho-Amarelo em sistema integrado de produção agroecológica. Pesq. Agropec. Bras., 44:68-75, 2009.
PINHEIRO, A.; TEIXEIRA, L.P. & KAUFMANN, V. Capacidade de infiltração de água em solos sob diferentes usos e práticas de manejo agrícola. R. Amb. Água, 4:188-199, 2009.
RAIJ, B.van; ANDRADE, J.C.; CANTARELLA, H. & QUAGGIO, J.A. Análise química para avaliação da fertilidade de solos tropicais. Campinas: Instituto Agronômico de Campinas, 2001. 285p.
REICHARDT, K. & TIMM, L.C. Solo, planta e atmosfera: Conceitos, processos e aplicações. 2.ed. Barueri, Manole, 2012. 524p.
REICHERT, J.M.; SUZUKI, L.E.A.S. & REINERT, D.J. Compactação do solo em sistemas agropecuários e florestais: Identificação, efeitos, limites críticos e mitigação. In: CERETTA, C.A.; SILVA, L.S. & REICHERT, J.M., eds. Tópicos em ciência do solo. 5.ed. Viçosa, MG, Sociedade Brasileira de Ciência do Solo, 2007. p.49-134
SALTON, J.C.; MIELNICZUK, J.; BAYER, C.; BOENI, M.; CONCEIÇÃO, P.C.; FABRÍCIO, A.C.; MACEDO, M.C.M. & BROCH, D.L. Agregação e estabilidade de agregados do solo em sistemas agropecuários em Mato Grosso do Sul. R. Bras. Ci. Solo, 32:11-21, 2008.
SILVA, V.L.; DIECKOW, J.; MELLEK, J.E.; MOLIN, R.; FAVARETTO, N.; PAULETTI, V. & VEZZANI, F.M. Melhoria da estrutura de um Latossolo por sistemas de culturas em plantio direto nos Campos Gerais do Paraná. R. Bras. Ci. Solo, 36:983-992, 2012.
SILVA, F.F.; FREDDI, O.S.; CENTURION, J.F.; ARATANI, R.G.; ANDRIOLI, F.F. & ANDRIOLI, I. Propriedades físicas de um Latossolo Vermelho cultivado no sistema plantio direto. Irriga, 13:191-204, 2008.
SILVA, S.G.C.; SILVA, A.P.; GIAROLA, N.F.B.; TORMENA, C.A. & SÁ, J.C.M. Temporary effect of chiseling on the compaction of a Rhodic Hapludox under no-tillage . R. Bras. Ci. Solo, 36: 547-555, 2012.
SILVA, C.L. & KATO, E. Efeitos do selamento superficial na condutividade hidráulica saturada da superfície de um solo sob cerrado. Pesq. Agropec. Bras., 32:213-220, 1997. STONE, L.F.; GUIMARÃES, C.M. & MOREIRA, J.A.A. Compactação do solo na cultura do feijoeiro I: Efeitos nas propriedades físico-hídricas do solo. R. Bras. Eng. Agríc. Amb., 6:207-212, 2002.
STRECK, C.A.; REINERT, D.J.; REICHERT, J.M. & HORN, R. Relações do parâmetro S para algumas propriedades físicas de solos do sul do Brasil. R. Bras. Ci. Solo, 32:2603-2612, 2008.
TAVARES FILHO, J.; GUIMARÃES, M.F.; CURMI, P. & TESSIER, D. Physical properties of an Alfisol and no-till soybean yield. R. Bras. Ci. Solo, 36:253-260, 2012. TAVARES FILHO, J.; FONSECA, I.C.B.; RIBON, A.A. &
BARBOSA, G.M.C. Efeito da escarificação na condutividade hidraúlica saturada de um Latossolo Vermelho sob plantio direto. Ci. Rural, 36:996-999, 2006. TORMENA, C.A.; SILVA, A.P.; IMHOFF, S.C. & DEXTER, A.R. Quantification of the soil physical quality of a tropical Oxisol using the S index. Sci. Agric., 65:56-60, 2008.
van GENUCHTEN, M.T.A. A closed-form equation for predicting the hydraulic conductivity of unsaturated soils. Soil Sci. Soc. Am. J., 44:892-897, 1980.
VOLK, L.B.; COGO, N.P. & STRECK, E.V. Erosão hídrica influenciadas por condições físicas de superfície e subsuperfície do solo resultantes do seu manejo, na ausência de cobertura vegetal. R. Bras. Ci. Solo, 28:763-774, 2004.