Universidade do Minho
Escola de Economia e Gestão
Cátia Catarina Eira Martins
Do US green funds perform well?
maio de 2020 UMinho | 2020 Cátia Cat ar ina Eir a Mar tins Do US g
reen funds per
for
m w
ii
DIREITOS DE AUTOR E CONDIÇÕES DE UTILIZAÇÃO DO TRABALHO POR TERCEIROS
Este é um trabalho académico que pode ser utilizado por terceiros desde que respeitadas as regras e boas práticas internacionalmente aceites, no que concerne aos direitos de autor e direitos conexos.
Assim, o presente trabalho pode ser utilizado nos termos previstos na licença abaixo indicada.
Caso o utilizador necessite de permissão para poder fazer um uso do trabalho em condições não previstas no licenciamento indicado, deverá contactar o autor, através do RepositóriUM da Universidade do Minho.
Licença concedida aos utilizadores deste trabalho
Atribuição-NãoComercial-SemDerivações CC BY-NC-ND
iii Acknowledgments
After a long journey, I have finally finished my dissertation and it is with a great pleasure that I would like to acknowledge all the people, who directly or indirectly, contributed to the achievement of this dissertation.
Firstly, my deepest thanks to Professor Maria do Céu Cortez, my supervisor, for all the help, knowledge, information and the availability to answer my doubts. I’m grateful for the guidance and persistent help, without her I wouldn´t be capable to finish this study with success. I would also like to thank all the professors from the Master in Finance, who gave me the tools to perform this study.
I also want to thank my colleagues for the extra help and for sharing their knowledge with me.
Finally, a special thanks to my family and boyfriend for all the support, for always believing in me and for giving me strength to finish my research. I am very much thankful for their understanding and continuing support to conclude this dissertation.
iv
STATEMENT OF INTEGRITY
I hereby declare having conducted this academic work with integrity. I confirm that I have not used plagiarism or any form of undue use of information or falsification of results along the process leading to its elaboration.
I further declare that I have fully acknowledged the Code of Ethical Conduct of the University of Minho.
v Resumo
Os fundos verdes dos EUA têm um bom desempenho?
Esta dissertação avalia o desempenho de 13 fundos verdes e 26 fundos convencionais correspondentes dos EUA, de fevereiro de 2004 a setembro de 2019. O desempenho dos fundos é avaliado usando modelos multifatoriais não condicionais, bem como modelos multifatoriais condicionais que permitem que os alfas e betas variem com o tempo. Adicionalmente, este estudo avalia as habilidades dos gestores dos fundos. Além disso, avaliamos também o desempenho dos fundos em diferentes estados do mercado, incluindo uma variável dummy nos modelos multifatoriais. O benchmark de mercado é representado por dois índices: um índice geral de mercado (S&P500) e um índice socialmente responsável (MSCI KLD 400).
Os resultados deste estudo estão de acordo com a maioria dos estudos sobre o desempenho dos fundos verdes e sugerem que os investidores verdes podem esperar não serem nem penalizados nem beneficiados por investir em fundos verdes. Os fundos convencionais também apresentam um desempenho neutro em relação ao mercado. Além disso, os resultados indicam que os fundos verdes não apresentam um desempenho diferente dos fundos convencionais. O desempenho semelhante entre estes dois tipos de fundos parece estar relacionado com as boas habilidades de seletividade dos gestores de fundos convencionais, combinadas com as boas habilidades de timing dos gestores de fundos verdes. Usando o modelo condicional de cinco fatores de Fama and French (2015) com a variável dummy, os fundos verdes apresentam um desempenho inferior aos fundos convencionais em períodos de expansão. No entanto, em períodos de recessão, o desempenho dos fundos verdes não varia, enquanto que o desempenho dos fundos convencionais diminui significativamente. Assim sendo, investir em fundos verdes é uma boa forma de reduzir a desvantagem associada a períodos de recessão. Em suma, os investidores convencionais podem investir em fundos verdes para diversificar e proteger as suas carteiras.
Palavras-chave: Desempenho de fundos, Finanças sustentáveis, Fundos convencionais, Fundos socialmente responsáveis, Fundos verdes.
vi Abstract
Do US green funds perform well?
This dissertation evaluates the performance of 13 US green funds and 26 US matched conventional funds from February 2004 to September 2019. Fund performance is evaluated using unconditional multi-factor models as well as conditional multi-factor models that allow for time-varying alphas and betas. Besides that, this study assesses fund managers’ abilities. Furthermore, we evaluate fund performance in different market states, by including a dummy variable in the multi-factor models. The market benchmark is proxied by two market indexes: a general market index (S&P500) and a socially responsible index (MSCI KLD 400).
The results of this study are in line with the majority of the studies on the performance of green funds and suggest that green investors may expect no superior or inferior returns by investing in green funds. Conventional funds also present a neutral performance compared to the market. Besides that, the results indicate that green funds do not perform different from conventional funds. The similar performance between these two types of funds seems to be linked with the good selectivity abilities of conventional fund managers combined with the good timing abilities of green fund managers. Using the conditional Fama and French (2015) five-factor model with a dummy variable, green funds underperform conventional funds in expansion periods. However, in recession periods the performance of green funds remains while the performance of conventional funds decreases. So, investing in green funds it is a good way to reduce the downside associated with recessions periods. Overall, conventional investors can invest in green funds in order to diversify and protect their portfolios.
Keywords: Conventional funds, Fund performance, Green funds, Socially responsible funds, Sustainable finance.
vii
Index
1. INTRODUCTION ... 1
2 LITERATURE REVIEW ... 3
2.1. The nature of the relationship between corporate social and financial performance ... 3
2.2. The effects of environmental performance on financial performance ... 4
2.3. The performance of green funds ... 7
2.4. Selectivity and timing abilities... 10
3. METHODOLOGY... 12
3.1. Unconditional Models ... 12
3.2. Conditional models ... 13
3.3. Managerial Abilities Models ... 15
3.4. Fund performance in different market states ... 16
4. DATA ... 18
5. EMPIRICAL RESULTS ... 24
5.1 Fund performance using unconditional models ... 24
5.1.1 Unconditional Carhart (1997) four-factor model ... 24
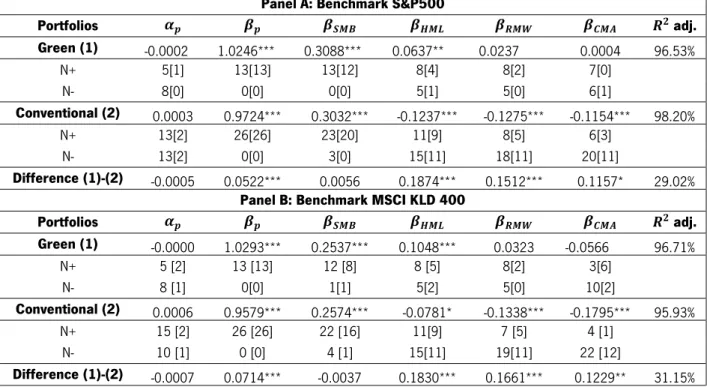
5.1.2 Unconditional Fama and French (2015) five-factor model ... 27
5.2 Fund performance using conditional models ... 30
5.2.1 Conditional Carhart (1997) four-factor model ... 30
5.2.2 Conditional Fama and French (2015) five-factor model ... 33
5.3. Selectivity and timing abilities... 36
5.3.1 The unconditional four-factor version of the Treynor and Mazuy (1966) model ... 36
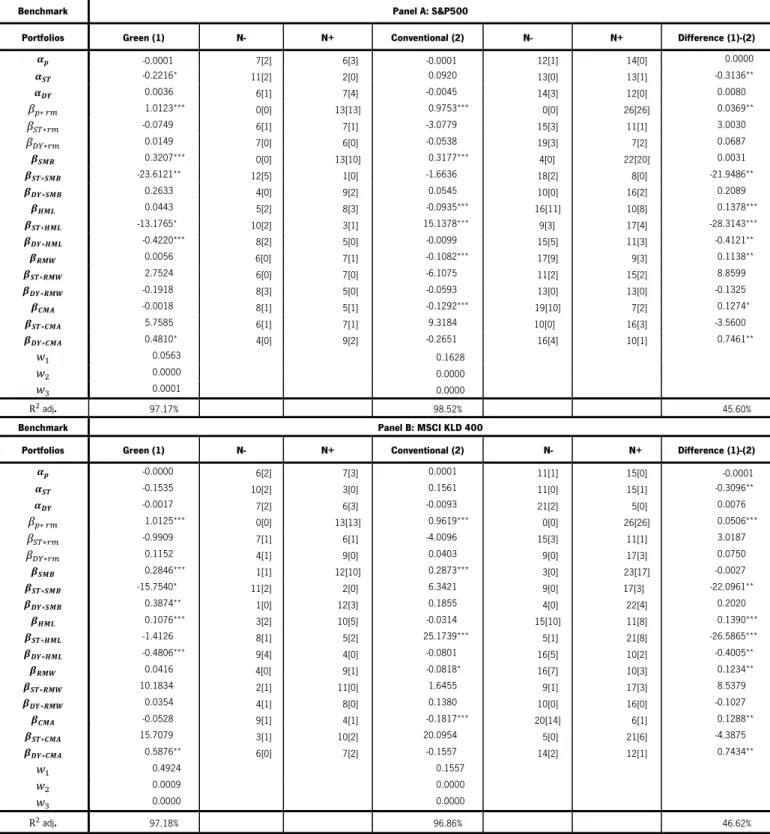
5.3.2 The unconditional five-factor version of the Treynor and Mazuy (1966) model ... 38
5.3.3 The conditional four-factor version of the Treynor and Mazuy (1966) model ... 40
viii
5.4. Fund performance in different market states ... 44
5.5 An overview of the empirical results of all models ... 49
6. Conclusion ... 53
ix List of tables
Table 1- List of US green and conventional funds ... 21
Table 2- Descriptive statistics of US green and conventional funds, market benchmarks and risk factors ... 22
Table 3- Mean excess returns by years for green fund and conventional funds ... 23
Table 4 - Unconditional Carhart four-factor model performance ... 25
Table 5- Unconditional Fama and French (2015) five-factor model performance... 27
Table 6 – The conditional Carhart (1997) four-factor model ... 31
Table 7- Conditional Fama and French (2015) five-factor model performance ... 34
Table 8 – The unconditional four-factor version of the Treynor and Mazuy (1966) model ... 37
Table 9 – The unconditional five-factor version of the Treynor and Mazuy (1966) model ... 39
Table 10 – The conditional four-factor version of the Treynor and Mazuy (1966) model ... 41
Table 11 – The conditional five-factor version of the Treynor and Mazuy (1966) model... 43
Table 12- Fund performance in different market states - Carhart (1997) four-factor model with a dummy variable ... 45
Table 13 - Fund performance in different market states- Fama and French (2015) five-factor model with a dummy variable ... 47
Table 14 – An overview of the empirical results ... 49
Table 15 – An overview of the empirical results – Selectivity and timing abilities ... 50
1 1. INTRODUCTION
The main objective of this study is to evaluate the performance of US domestic green funds. The motivation for research topic is associated to the fact that in the past years, the world has been experiencing environmental changes that have become a major concern in society. The number of investors willing to introduce their ethical and social values into their investment’s decision process has been growing all over the world, in this way promoting the growth of socially responsible funds. Financial market players are changing their style of investment, towards becoming more environmental and social friendly when making investment decisions. Keefe (2007) argues that the world is in transition to a sustainable investing, which involves the incorporation of environmental, social and governance (ESG) factors into financial analysis and decision-making. According to US SIF (2018), the amount of investments that incorporate ESG criteria has been growing quickly. In fact, in the US, the assets being professionally managed under social responsible investment (SRI) strategies increased 38% since 2016 representing, at the start of 2018, 26% of the $46.6 trillion of the total US assets under professional management. This study also reports that money managers integrated social factors a little bit more than environmental and governance ones. Furthermore, the category with higher growth in the period of 2016-2018 was ‘products’: Tobacco-related restrictions had the largest growth, increasing 432%, and ‘climate change/Carbon’ is the most significant specific environmental factor taken into consideration by money managers.
SRI is not new in the marketplace, and according to European Sustainable Investment Forum (Eurosif, 2018), it “is a long-term oriented investment approach which integrates ESG factors in the research, analysis and selection process of securities within an investment portfolio. It combines fundamental analysis and engagement with an evaluation of ESG factors in order to better capture long term returns for investors, and to benefit society by influencing the behavior of companies” (Eurosif, 2018, p. 12).
Environmental issues are one of the concerns and the forefront of socially responsible investors. Problems such as global warming, pollution, energy shortage and climate changes are making people apprehensive all over the world, and because of that individuals and organizations worldwide are devoting extra attention to green investments. Chang et al. (2012) point that green investing could be considered a subdivision of SRI and due to the growing concerns about environmental issues, a new subset of SRI funds has emerged: green funds. These funds attract
2
investors concerned with the negative impact that corporate activities have on the environment. Green funds provide investors a way to invest in mutual funds that are friendly to the environment, by investing in companies that have a smaller ecological impact than other alternatives. For example, investing in renewable energy companies, or companies that produce ecologically friendly products.
The development of green funds has motivated the debate on the impact of considering environmental screens in the investment process. Do investors benefit from an improved financial performance or do they suffer a cost when investing with environmental concerns? This dissertation investigates this topic by analyzing if green funds investors in the US can do well, without sacrificing financial performance. The aim is to compare the performance of US green funds to that of the market and conventional funds. This analysis is also performed for different market states. Since there are still few studies on the performance of green funds and there is no clear consensus on this topic, this is the main motivation to perform this study.
In order to evaluate the performance of green and conventional funds this study uses multifactor-models: the Carhart (1997) four-factor model and the Fama and French (2015) five-factor model. To have more robust results, the conditional approach of Christopherson et al. (1998) that allows for time-varying alphas and betas, will be used. Since the screening process can restrict or improve opportunities for different manager skills, this study also analyzes the timing and selectivity abilities of both types of funds. To do that this study uses the unconditional and conditional four-factor and five-factor version of the Treynor and Mazuy (1966) model.
This dissertation is divided into 6 chapters. After a brief introduction to the topic in chapter 1, chapter 2 discusses the main studies in the field. This chapter is divided into four parts: the nature of the relationship between corporate social and financial performance, the relation between environmental performance and financial performance, the performance of green funds, and selectivity and timing abilities. Chapter 3 presents the methodology that will be used in this study. Chapter 4 describes the data and presents some descriptive statistics of the dataset. The empirical results are discussed in chapter 5, and, finally, the last chapter summarizes the results and presents the main conclusions, as well some limitations and suggestions for future research.
3 2. LITERATURE REVIEW
2.1. The nature of the relationship between corporate social and financial performance
SRI is becoming a very relevant investment approach, having been widely discussed in the finance literature. Many investors seek to obtain a good financial performance and, at the same time, incorporate social criteria in their investment decisions. However, it is controversial that including social criteria in the financial performance of investments is beneficial.
There are two theoretical views on the financial impact of SRI: the first argues that investing in a socially responsible way can be harmful to investors as well as to companies; the second claims that socially responsible investing can bring advantages for both companies and investors. According to Friedman (1970), a corporation’s social responsibility is to make a profit. This comment prompted intellectual debate and motivated additional interest in the nature of the relationship between corporate social responsibility and financial performance. The more traditional view of corporate social responsibility (CSR), inspired by Friedman (1970), supports the argument that environmental performance will lead to additional costs that are not offset by potential gains, thus affecting negatively corporate profitability (Walley and Whitehead, 1994). Furthermore, increasing the operating costs in order to be socially responsible can put a firm at a disadvantage relative to rivals that do not follow social criteria in their investment decisions (Aupperle et al., 1985; McGuire et al., 1988; Ullmann, 1985). In line with this perspective, Feldman et al. (1997) argue that companies should only take investments in CSR practices when it is required by law regulations: all other CSR investments are unnecessary and reduce the value of the firm.
At the portfolio level, Chang et al. (2012) argue that investing according to green criteria will limit the pool of investments, thus portfolios will suffer from diversification losses, resulting in lower risk-adjusted returns. The additional costs associated to screening activities also contribute to a lower portfolio performance (Cortez et al., 2009).
On the other hand, Stakeholder Theory supports that firms should consider the interests of all stakeholders and not only the shareholders, in order to increase their productivity and the value
4
of the company (Freeman, 1984; Solomon and Hansen, 1985). Additionally, Ambec and Lanoie (2008) argue that being environmentally friendly can lead to an increase of revenues for several reasons, such as differentiating products. These authors also argue that a better environmental performance can lead to a cost reduction in some levels, for example, at the level of risk management and relations with external stakeholders. Therefore, according to this viewpoint, investing in environmentally friendly companies can lead to improved portfolio performance.
One of the first studies in this area was performed by Moskowitz (1972), which analyzes the performance of companies with good social performance against companies that are less socially responsible. The author concludes that corporate social performance is beneficial for companies, demonstrating a positive relationship between corporate social performance and financial performance.
2.2. The effects of environmental performance on financial performance
Previous research has provided mixed results regarding the relationship between environmental performance and financial performance. Some studies find a negative relation between environmental and financial performance, others a positive relationship between environmental and financial performance, and others find no relation between environmental and financial performance.
At first glance, it may appear that if firms improve their environmental performance will hurt from the additional costs and consequently reduce their financial performance. On the other hand, there are also reasons to think that a good environmental performance will lead to a better financial performance.
In order to study the benefits and the market response to good environmental management, Klassen and McLaughlin (1996) proposed a theoretical model that links strong environmental management with future financial performance, as measured by stock market performance. The results show that positive returns are associated with strong environmental management, while negative returns are associated with weak environmental management.
King and Lenox (2001) show a positive relationship between pollution reduction and financial gain, although they cannot demonstrate the direction of this connection. They argue that
5
only firms with specific characteristics reduce their pollution levels in a profitable way. Stanwick and Stanwick (1998) show that a firm’s corporate social performance is, in fact, affected by the size of the firm, the level of profitability, and the quantity of pollution released by the firm.
In the same line, Wahba (2008) demonstrates that the market rewards firms that protect the environment, arguing in favor of a positive impact of corporate environmental responsibility on its market value. In contrast to Friedman (1970), the author argues that the implementation of an environmental management system can improve firm competitive advantages by optimizing resources usage. In this sense, corporate environmental responsibility will not hurt corporate financial performance.
Regarding the Japanese market, Nakao et al. (2007) also find that environmental performance has a positive impact on a firm’s financial performance and vice-versa. Even if the initial investment is not based on socially accepted practices, firms can invest the surplus in environmentally friendly practices, technologies and initiatives.
Pollution reduction sometimes is considered as a cost burden on the firm and this cost can reduce its competitiveness. Alternatively, it can be viewed as way to increase efficiency, saving money and giving firms a cost advantage. To resolve this paradox, Hart and Ahuja (1996) examine the relationship between emissions reductions and financial performance. The results suggest that it does pay to be green. The operating performance is better only in the following year after the initiation of the efforts to prevent pollution and reduce emissions, whereas it takes about 2 years to affect financial performance. Furthermore, firms with the highest levels of emission are the ones who gain the most.
The relationship between corporate environmental performance and corporate financial performance is mostly studied for developed countries. Because of that, Manrique and Martí-Ballester (2017) analyze this relationship considering the economic development of the market, during a global financial crisis. The findings show that in times of economic crisis, corporate environmental performance has a positive impact on corporate financial performance. However, the effect is weaker for firms in developed countries, where the improvement only occurs in short-term corporate financial performance, than for companies in emerging and developing countries. Jo et al. (2015) investigate how environmental costs affect the performance of firms in the financial sector from 29 countries. The results show that lowering environmental costs will lead to
6
an increase in financial performance in the long term. Reducing environmental costs brings advantages to the firms, for example, improving production efficiency and competitiveness, a better company reputation and reducing the cost of capital. They also find that the effect of reducing environmental costs differs for different levels of development of the markets and across regions. For well-developed financial markets this has a rapid effect; however for firms in less-developed financial markets the effect is observed in the long term.
Konar and Cohen (2001) also analyze this relationship by relating the market value of firms in the S&P500 to objective measures of their environmental performance, instead of subjective environmental performance criteria. The results point out that bad environmental performance is negatively correlated with the intangible asset value of firms. If firms reduce the emissions of toxic chemicals by 10%, the market value of those firms increases $34 million. Yet, the impact of this effect differs across industries.
Although Entreat et al. (2014) point out the lack of consensus, integrating the results of 149 studies by meta-analytic analysis they show that for the majority of the studies this relationship is positive. They also argue that this relationship is stronger when the strategic approach underlying corporate environmental performance is proactive.
Using meta-analytical techniques and focusing on corporate carbon performance, Busch and Lewandowski (2018) examine “When does it pay to be green?”. The results show that there is a positive relationship between carbon performance and financial performance, implying that companies have an incentive to engage in carbon mitigation measures.
At a portfolio level, Derwall et al. (2005) analyze if investing in portfolios of companies with high environmental standards leads to inferior or superior performance. Based on eco-efficiency scores, the results show that from 1995 to 2003 high-ranked portfolios offer higher returns than their low-ranked counterparts.
Another set of studies supports the view that firms with high environmental performance contribute negatively to financial performance. For the US market, Cordeiro and Sarkis (1997) demonstrate a negative relationship between environmental proactivism and financial performance, using a different measure of financial performance: security analyst earnings forecasts. They argue that security analysts anticipate lower earnings-per-share in the short-term,
7
around 1 to 5 years, for companies that are more environmentally proactive. Therefore, there are short-term disadvantages of environmental proactivism.
Lioui and Sharma (2012) also find a negative relationship, arguing that environmental strengths and concerns are negatively associated with corporate financial performance, measured by ROA and Tobin’s Q. They argue that this relationship is driven by the fact that investors see environmental initiatives as a cost or disadvantage.
At a portfolio level, Boulatoff and Boyer (2009) find evidence that green firms underperform comparable Nasdaq firms. The authors also show that green firms have higher volatility. Haan et al. (2012) also observe a negative relationship between corporate environmental performance and stock returns, motivated by the common risks associated with corporate environmental performance.
Finally, some studies do not find any relationship between environmental performance and financial performance. Puopolo et al. (2015) show that there is no linear relationship between being green and financial returns, pointing out that the implementation of environmentally friendly standards is new in the marketplace.
It is also important to mention that there is even evidence of curvilinear relationship between environmental performance and firm performance, as in Ramanathan (2018). As firms improve their environmental performance, they achieve higher levels of financial performance, but after a certain level of environmental performance, financial performance deteriorates. Pekovic et al. (2018) also state a non-linear relationship, finding an inverted U-shaped relationship, suggesting that there is an optimal level of environmental investment.
2.3. The performance of green funds
There are many studies that compare the performance of socially responsible funds with conventional ones or the market. Overall, the majority of the studies find that SRI funds have similar performance to conventional funds and to the market. There are also some studies on the performance of socially responsible funds that focus specifically on funds that screen for environmental criteria – the so-called green funds. As far we know, the first study that evaluates the performance of green funds in the US and German markets is that of White (1995). The results
8
show that US green funds underperform the market, but green funds perform similarly to the market in Germany.
Climent and Soriano (2011) examine the financial performance of US green funds compared to conventional funds from 1987 to 2009. They find that US green funds underperform conventional funds, because green funds are subject to higher risks, since they limit the number of investments in which they can invest. However, when focusing in the period from 2001 to 2009, green funds had a similar performance. The authors argue that the initial poor performance of green funds may be explained by their more restricted investment set. Other possible explanation for these results may be that green funds increased in terms of value faster than conventional funds, due to a higher demand.
Chang et.al (2012) compare the financial performance of green and conventional funds in the US. The results of this study indicate that green funds underperform conventional ones. Green mutual funds exhibit higher expenses ratios, lower returns and lower risk-adjusted returns. In terms of risk, green mutual funds’ risk seems to be similar to conventional funds, so green investment restrictions in terms of diversification does not engender more risk.
Also for the US market, but from 1998 to 2007, Mallett and Michelson (2010) find that US green fund returns are similar to SRI fund and index returns. They argue that the lack of performance differences between green and SRI funds is due to the small period that green funds have been operating. As time passes, more information and data become available and the difference in green funds and SRI funds may grow wider.
Adamo et al. (2014) collected a data set of 257 green funds all over the world and evaluated their performance. The authors concluded that green funds have a growing importance and have a positive performance even in recession periods.
Controlling for crisis and non-crisis periods, Muñoz et al. (2014) analyze the financial performance of US and European SRI funds. For US SRI funds, the results show that in crisis periods SRI funds have a statistically insignificant performance, whereas in non-crisis market periods US SRI funds underperform the market. The authors argue that green funds perform similarly to other forms of SRI funds. For European SRI funds, the results show that regardless of market conditions, SRI funds show a statistically insignificant performance.
9
Silva and Cortez (2016) also consider the performance of US and European green funds in different market states. Their results show that green funds tend to underperform the benchmark mainly in non-crisis periods and when short-term interest rates are inferior than normal. Besides that, they find that funds certified with a SRI label do not out-or-under perform green funds without the label. However, the number of funds presenting negative performance is higher for non-certified funds.
Lesser and Walkshäusl (2016) analyze the financial performance and screening activity of socially responsible, green, and faith-based equity funds for periods of crisis and non-crisis. In crisis periods, the results show that these three types of funds perform similar to their conventional peers and the market. However, during non-crisis periods, green and socially responsible funds tend to underperform. The authors argue that the performance differences are due to the funds’ screening activities since there are performance drivers and reducers for each strategy. For example, social screens lead to the underperformance of socially responsible funds, while energy screens drive the performance of green funds.
Ibikunle and Steffen (2017) perform a comparative analysis of European green, black and conventional mutual funds from 1991 to 2014. The results show that green mutual funds underperform relative to conventional funds. However, there is no significant risk-adjusted performance differences between green and black mutual funds. Peculiarly, the green fund’s risk-adjusted return improves until the point where there is no difference in the performance of the green and the conventional funds. From 2012 to 2014, green funds begin to outperform their black peers, since fossil energy and natural resources are being replaced by renewable energy.
Within the green arena, several studies have focused specifically on funds that invest in renewable energy companies. The number of alternative energy funds have been growing as a result of many countries trying to encourage stakeholders to consider renewable energy sources. Reboredo et al. (2017) evaluate the performance of alternative energy funds in several countries and show that these funds underperform SRI and conventional mutual funds in terms of returns and downside risk protection. Therefore, investors are paying a premium for being green, especially using renewable energies.
Marti‐Ballester (2019a) stresses that renewable energy mutual funds channel private resources into climate finance, if managers adopt renewable energy principles in investors’ portfolios. As such, renewable energy mutual funds play an important role as financial instruments.
10
This author analyzes the performance of these funds in Europe over 2007-2018 and compares their financial performance with black energy and conventional funds. She finds that renewable energy funds outperform the energy benchmark but underperform the fossil fuel energy and conventional market benchmarks. Thus, investing in renewable energy funds has a cost for investors when compared with conventional funds.
In another study, Marti‐Ballester (2019b) analyzes the financial performance of energy and renewable energy mutual funds in Europe using conditional and unconditional models. Using unconditional models, the results show that renewable energy mutual funds outperform the specific benchmark but underperform the conventional benchmark. Using conditional models, renewable energy funds perform similarly to the market, but underperform their conventional peers using a specialized market benchmark. This author also concludes that fund characteristics such as SRI certification does not affect the financial performance of renewable energy funds. However the expense ratio has a negative effect on financial performance.
2.4. Selectivity and timing abilities
It is also important to consider that fund performance can be a result not only fund managers’ selectivity abilities but also their market timing abilities (Muñoz et al. 2014). Stock-picking and market-timing abilities have been widely discussed in the mutual fund literature, especially for conventional funds. Depending on the market or the period analyzed, the empirical evidence shows mixed results.
Muñoz et al. (2014) find that European and US global green funds do not exhibit good timing abilities. Furthermore, for the European market Leite and Cortez (2014) do not find differences in terms of timing abilities between SRI funds and their matched conventional funds. Ang et al. (2014) compare SRI funds in Europe and North America, finding market-timing abilities in both regions. In contrast, Ferruz et al. (2010) find negative timing abilities for both SRI and conventional funds in the UK market. For the Swedish market, Leite et al. (2018) show that SRI and conventional fund managers do not present selectivity and timing abilities.
Leite and Cortez (2014) argue that SRI funds present different selectivity and timing abilities relative to conventional funds for several reasons. On the one hand, if the screening
11
process generates informational advantages, it can help fund managers to recognize undervalued securities. On the other hand, the limited investment universe restricts fund managers compared to conventional funds, since SRI should follow social investment criteria. The restrictions in terms of selectivity for SRI fund managers, might motive them to be more focused on market timing opportunities. Yet, SRI fund assume a more long-term perspective compared to their conventional peers, being more loyal to the companies in which they invest, which may limit their possibility to explore market timing opportunities.
12 3. METHODOLOGY
This chapter presents the methodology used to evaluate fund performance. Starts by presenting the four-factor model of Carhart (1997) and the five-factor model of Fama and French (2015). Then, we present these models in their conditional specification. Then the models to evaluate the timing and selectivity abilities. Finally, we present the models that include a dummy variable to distinguish performance in recessions and expansions periods.
3.1. Unconditional Models
Using a market benchmark as the unique risk factor, Jensen (1968) measures performance as the difference between the actual portfolio’s return and the expected risk-adjusted return based on the CAPM. Despite the popularity of Jensen’s (1968) alpha, it has been widely argued that this model is not sufficiently good at explaining the cross-section of expected stock returns (Fama and French, 1993). One of the reasons is that the single-factor model tends to overestimate fund performance (Elton et al., 1993). In fact, multi-factor models have been recognized as much more useful to characterize portfolio returns than a single-factor model (Derwall et al., 2005; Climent and Soriano, 2011).
The Carhart (1997) four-factor model includes the original factors of the Fama and French (1993) three-factor model (market, size and book-to-market) with the momentum factor. This model is expressed by the following equation:
𝑟, = 𝛼 + 𝑏 𝑟 , + 𝑏 (𝑆𝑀𝐵 ) + 𝑏 (𝐻𝑀𝐿 ) + 𝑏 (𝑀𝑂𝑀 ) + 𝜀 , (1) where 𝑟 , is the excess return of fund p in period t, 𝑟 , represents the market’s excess return in period t, 𝑆𝑀𝐵 (small minus big) is the difference in returns between a portfolio of small stocks and a portfolio of large stocks; 𝐻𝑀𝐿 (high minus low) is the difference in returns between a portfolio of high book-to-market stocks and a portfolio of low book-to-market stocks; 𝑀𝑂𝑀 is the difference in the returns of a portfolio of past winners and a portfolio of past losers and 𝑏 , 𝑏 , 𝑏 and 𝑏 are the factor coefficients (betas on each of the factors).
13
A more recent model to evaluate the performance is the five-factor model of Fama and French (2015). Using this model, it has become possible to better understand the investment strategies of funds’ managers, since the Fama and French (1993) model does not explain the variation of returns related to the investment and the profitability. We note that there are few studies evaluating fund performance with this model since it is relatively recent. Besides the market, size and book-to-market factors, this model adds two new factors: profitability (𝑅𝑀𝑊) and investment (𝐶𝑀𝐴), and is expressed by the following equation:
𝑟, = 𝛼 + 𝑏 𝑟 , + 𝑏 (𝑆𝑀𝐵 ) + 𝑏 (𝐻𝑀𝐿 ) + 𝑏 (𝑅𝑀𝑊 ) + 𝑏 (𝐶𝑀𝐴 ) + 𝜀 , (2) where 𝑅𝑀𝑊 is the difference between the returns on diversified portfolios of stocks with robust and weak profitability and 𝐶𝑀𝐴 is the difference between the returns on diversified portfolios of the stocks of low and high investment firms (conservative and aggressive).
It has been widely debated in literature that unconditional models such as those presented so far can produce biased estimates of performance, as these models assume constant expected returns and risk. Considering this limitation, we also apply conditional models to evaluate performance. These models are more robust, as they assume that expected returns and risk vary over time, considering market conditions.
3.2. Conditional models
This conditional approach to evaluate the performance allows betas to vary over time as linear functions of a vector of predetermined information variables. These variables represent the public information that is available at time t-1 in order to predict returns at time t. The conditional single-factor model of Ferson and Schadt (1996) is represented by the following equation:
𝑟, = 𝛼 + 𝛽 (𝑟 . ) + 𝛽 (𝑧 𝑟 . ) + 𝜀 , (3) where 𝑧 represents a vector of the deviations of 𝑍 from the unconditional values, 𝛽 is an average beta that represents the unconditional mean of the conditional betas, and 𝛽 is a vector that measures the response of the conditional betas to the information variables.
14
The conditional single-factor model proposed by Ferson and Schadt (1996) can be viewed as partial conditional model, considering that it only allows betas to vary over time, while assuming that alphas are constant.
Christopherson et al. (1998) extend the model of Ferson and Schadt (1996) by also allowing alphas also to be time-varying, as follows:
𝛼 (𝑍 ) = 𝛼 + 𝑧 𝐴 (4) where 𝛼 represents the average alpha and 𝐴 measures the sensitivity of the conditional alpha to the information variables.
Rearranging the equations by combining equations (3) and (4), we have the full conditional of Christopherson et al. (1998), represented by the following equation:
𝑟, = 𝛼 + 𝑧 𝐴 + 𝛽 (𝑟 . ) + 𝛽 (𝑧 𝑟 . ) + 𝜀 , (5) The conditional Carhart (1997) four-factor model is obtained combining the conditional
single-factor model with the Carhart (1997) risk factors. Combining equation (5) with the four risk factors gives the conditional multi-factor model with time-varying alphas and betas, represented as follows:
𝑟 , = 𝛼 + 𝑧 𝐴 + 𝛽 𝑟 . + 𝛽 (𝑧 𝑟 . ) + 𝛽 , 𝑟 .
+ 𝛽 , (𝑧 𝑟 . )
+ 𝛽 , 𝑟 . +𝛽 , (𝑧 𝑟 . )
+ 𝛽 , 𝑟 . + 𝛽 , (𝑧 𝑟 . ) + 𝜀 , (6)
In turn, the conditional Fama and French (2015) five-factor model with time-varying alphas and betas is represented by the following equation:
𝑟 , = 𝛼 + 𝑧 𝐴 + 𝛽 𝑟 . + 𝛽 (𝑧 𝑟 . ) + 𝛽 , 𝑟 .
+ 𝛽 , (𝑧 𝑟 . )
+ 𝛽 , 𝑟 . +𝛽 , (𝑧 𝑟 . )
+ 𝛽 , 𝑟 . + 𝛽 , (𝑧 𝑟 . )
15
As in Cortez et al. (2012), this study applies the Wald test, to assess the importance of introducing public information variables. In order to determine if there are time-varying alphas and time-varying betas, this test tests the null hypothesis that the conditional alphas, conditional betas and the joint conditional alphas and betas are jointly equal to zero.
3.3. Managerial Abilities Models
Muñoz et al. (2014) combine the Treynor and Mazuy (1966) market-timing model with the Carhart (1997) model, in order to evaluate the fund managers style-timing abilities. Thus, this study also applies this approach combining the Treynor and Mazuy (1966) market-timing model with both Carhart (1997) four-factor model and Fama and French (2015) model, represented, respectively as follow: 𝑟, = 𝛼 + 𝑏 𝑟 , + 𝑏 (𝑆𝑀𝐵 ) + 𝑏 (𝐻𝑀𝐿 ) + 𝑏 (𝑀𝑂𝑀 ) + 𝑏 𝑟 , + 𝑏 (𝑆𝑀𝐵 ) + 𝑏 (𝐻𝑀𝐿 ) + 𝑏 (𝑀𝑂𝑀 ) + 𝜀 , (8) 𝑟, = 𝛼 + 𝑏 𝑟 , + 𝑏 (𝑆𝑀𝐵 ) + 𝑏 (𝐻𝑀𝐿 ) + 𝑏 (𝑅𝑀𝑊 ) + 𝑏 (𝐶𝑀𝐴 ) + 𝑏 (𝑟 , ) + 𝑏 (𝑆𝑀𝐵 ) + 𝑏 (𝐻𝑀𝐿 ) + 𝑏 (𝑅𝑀𝑊 ) + 𝑏 (𝐶𝑀𝐴 ) + 𝜀 , (9)
where, 𝛼 measures the stock-picking ability of the managers and 𝑏 , 𝑏 , 𝑏 , 𝑏 , 𝑏 𝑎𝑛𝑑 𝑏 represent the timing abilities of the fund manager.
As in Leite et al. (2018), this study also evaluates the timing and selectivity of green and conventional fund managers extended to a conditional context, by including the Carhart (1997) and Fama and French (2015) factors with the public information variables in the Treynor and Mazuy (1996) model, represented as follow:
𝑟, = 𝛼 + 𝑧 𝐴 + 𝛽 𝑟 . + 𝛽 (𝑧 𝑟 . ) + 𝛽 , 𝑟 . +
16 𝛽 , 𝑟 . + 𝛽 , (𝑧 𝑟 . ) + 𝛽 (𝑟 . ) + 𝛽 , (𝑟 . ) + 𝛽 , (𝑟 . ) + 𝛽 , (𝑟 . ) + 𝜀 , (10) 𝑟, = 𝛼 + 𝑧 𝐴 + 𝛽 𝑟 . + 𝛽 (𝑧 𝑟 . ) + 𝛽 , 𝑟 . + 𝛽 , (𝑧 𝑟 . ) + 𝛽 , 𝑟 . +𝛽 , (𝑧 𝑟 . ) + 𝛽 , 𝑟 . + 𝛽 , (𝑧 𝑟 . ) + 𝛽 , 𝑟 . + 𝛽 , (𝑧 𝑟 . ) + 𝛽 (𝑟 . ) + 𝛽 , (𝑟 . ) + 𝛽 , (𝑟 . ) + 𝛽 , (𝑟 . ) + 𝛽 , (𝑟 . ) + 𝜀 , (11)
3.4. Fund performance in different market states
We further investigate green and conventional fund’ performance in different states of the market. The issue of whether fund performance is better in periods of recessions/crisis is a relevant one, as Areal et al. (2013) claim. Following Areal et al. (2013), a dummy variable will be added to the Carhart (1997) four-factor model and the Fama and French (2015) model to analyze the performance of green funds in periods of expansion and recession. The Carhart (1997) model with the dummy variable is represented by the following equation:
𝑟, = 𝛼 + 𝛼 , 𝐷 + 𝛽 , (𝑟 . ) + 𝛽 , , (𝑟 . )𝐷 + 𝛽 , 𝑆𝑀𝐵 +
𝛽 , , 𝑆𝑀𝐵𝐷 + 𝛽 𝐻𝑀𝐿 + 𝛽 , 𝐻𝑀𝐿𝐷 + 𝛽 , 𝑀𝑂𝑀 + 𝛽 , 𝑀𝑂𝑀 𝐷 +
𝜀 , (12) where 𝐷 is the dummy variable that is equal to 0 in expansion periods and 1 in recession periods. The dummy variable will be also added to the Fama and French (2015) five-factor model, represented as follows:
𝑟 , = 𝛼 + 𝛼 , 𝐷 + 𝛽 , (𝑟 . ) + 𝛽 , , (𝑟 . )𝐷 + 𝛽 , 𝑆𝑀𝐵
+ 𝛽 , , 𝑆𝑀𝐵𝐷 + 𝛽 𝐻𝑀𝐿 + 𝛽 , 𝐻𝑀𝐿𝐷 + 𝛽 , 𝑅𝑀𝑊 + 𝛽 , 𝑅𝑀𝑊 𝐷 + 𝛽 , 𝐶𝑀𝐴 + 𝛽 , 𝐶𝑀𝐴 𝐷
17
The identification of the markets states was based on the recession and expansion periods as identified by the National Bureau of Economic Research (NBER). For the period under evaluation the NBER identifies the following states for the US market:
-From February of 2004 until December of 2007- Expansion period -From December of 2007 until June of 2009- Recession period -From June of 2009 until September of 2014- Expansion period
18 4. DATA
The dataset of this study includes US funds that invest domestically (US equity funds). Selecting the green funds is one of the most crucial and difficult steps of this study, since there isn’t a clear definition of what is a “green” fund: generally this term is used to describe a fund that uses environmental criteria in the security selection process.
As in Chung et al. (2012), we identified green funds using the Social Investment Forum (SIF) website.1 This forum provides information about the funds, like screening standards and funds’ general profiles. Following Chung et al. (2012), we selected SRI funds with a positive (key: P) or restricted investment (Key: R) in at least one of the 3 subsets of the “environment” category which includes “climate/clean technology", “pollution/toxic", and “environment/other" subsets. The green mutual funds were identified using the most recent information provided by the US SIF (US SIF 2018). We analyzed the information provided by US SIF 2018 under Screening and Advocacy and selected only the funds with at least one P or R in one of the subsets of the “environment” category.2
As in Climent and Soriano (2011), the sample excludes bonds funds, balanced funds, guaranteed funds, index funds and institutional funds. Besides that, only funds with at least 24 monthly observations are included in the dataset, as in Silva and Cortez (2016). In the case of funds with different share classes, only the oldest one was considered (Cortez et al., 2012).
This study compares the performance of US green funds with a portfolio of US conventional funds. Like other studies (e.g., Nofsinger and Varma, 2014) we use a common procedure for that purpose: matched paired analysis. In this study, the conventional funds were identified using DataStream. The matching procedure was based on the following criteria: base date, Lipper classification and the total net assets, as in Nofsinger and Varma (2014). Firstly, funds with same Lipper objective and inception dates within a year of the green funds were identified. Then, for each green fund, two conventional funds were selected with the closest total net assets. As in Nofsinger
1 https://www.ussif.org/ US SIF: The Forum for Sustainable and Responsible Investment is the leading voice advancing sustainable, responsible and impact investing across all asset classes. Its mission is to rapidly shift investment practices toward sustainability, focusing on long-term investment and the generation of positive social and environmental impacts.
2 The limitation of using this procedure to identify green funds is that we cannot identify funds that ceased to exist, so the dataset is not survivorship bias-free.
19
and Varma (2014), in the case that conventional funds did not meet the age criteria, the age criteria were extended for 3 years. If after that it was still not possible to identify any fund, the age criteria was dropped completely and the fund with the same Lipper objective and closet total net asset was selected.
In this study we created two equally weighted portfolios: a portfolio of green funds and a portfolio of conventional funds. The average monthly returns of each fund it was computed according to the following formula (n is the number of sample funds):
𝐸𝑞𝑢𝑎𝑙𝑙𝑦 𝑊𝑒𝑖𝑔ℎ𝑡𝑒𝑑 = ∑ 𝑟𝑒𝑡𝑢𝑟𝑛
𝑛 (14) Besides the analysis of fund performance at the aggregate level, this study analyzes funds’ performance individually, as in Silva and Cortez (2016), considering that the results based on equally weighted portfolios can hide some significant performance differentials at the individual level.
As market benchmark we use two benchmarks, in order to compare the exposure of green and conventional funds to a green and conventional index. The conventional benchmark used is the Standard & Poor`s 500 index (S&P500), that includes the top 500 companies in the US market. Climent and Soriano (2011) use the FTSE KLD Global Climate 100 Index to characterize the green sector, since this index promotes investment in 100 public companies that demonstrate a good potential for mitigating short-term and long-term causes of climate change. However, the fact that this index is a global one and this study is focused in the US market led us to choose the MSCI KLD 400 index as the benchmark used to represent the green sector. 3 This benchmark is generally recognized for measuring the impact of social and environmental screening on investment portfolios (Climent and Soriano, 2011). To proxy for the risk-free rate, the 1-month treasury bill was collected from the website of Professor Kenneth R. French.4 From this website we
3 The MSCI KLD 400 Social Index is a capitalization weighted index of 400 US securities that provides exposure to companies with outstanding Environmental, Social and Governance (ESG) ratings and excludes companies whose products have negative social or environmental impacts. The parent index is MSCI USA IMI, an equity index of large, mid and small cap companies. The Index is designed for investors seeking a diversified benchmark comprised of companies with strong sustainability profiles while avoiding companies incompatible with values screens. Launched in May 1990 as the Domini 400 Social Index, it is one of the first SRI indexes. Constituent selection is based on data from MSCI ESG Research. (https://www.msci.com/documents/10199/904492e6-527e-4d64-9904-c710bf1533c6 accessed on October 24, 2019)
20
also collected the risk factors: the SMB factor, the HML factor, the MOM factor, the RMW factor and the CMA factor.
Fund monthly returns, in US dollars, were obtained from DataStream. To be consistent with the data extracted from the professor Kenneth R. French, the data for both benchmarks were extracted from DataStream and the returns were computed in a discrete way.
To apply the conditional models of Christopherson et al. (1998), two lagged information variables were used: the dividend yield and the short-term rate, as in Ferson and Warther (1996) and Cortez et al. (2012). Cortez at al. (2012) argue that financial markets are increasingly integrated, in this way supporting the use of global information variables. The dividend yield is based on the S&P500 index and was extracted from DataStream. The short-term rate variable is proxied by the 3-month US Treasury bill yield, extracted from the Federal Reserve website.5
As these variables tend to be highly persistent, a potential problem that might arise is the bias resulting from the spurious regressions (Cortez et al., 2009). To prevent this problem, we used the procedure of Ferson et al. (2003) that consists in detrending these variables by subtracting their 12-month moving average. To minimalize possible scale effects on the results, these variables are used in their corresponding mean zero values (Bernhardt and Jung, 1979).
In order to correct the standard errors for heteroscedasticity and autocorrelation, the procedure of Newey and West (1987) was used. As in Baum (2006) the number of lags is determined by the rule of thumb: √𝑁, where N represents the number of observations.
Table 1 shows the list of US green funds used in this study and their corresponding conventional peers. The sample is composed of 13 green funds and 26 matched conventional funds.
Table 2 reports the descriptive statistics for the two equally weighted portfolios: the equally weighted portfolio of US green funds and the equally weighted portfolio of US conventional funds. Besides that, it also reports the descriptive statistics for the green (MSCI KLD 400) and conventional (S&P500) benchmarks and for the risk factors. The period under analysis is the last 15 years (from 2004 to 2019).
21
Table 1- List of US green and conventional funds
Fund Name Inception
date
Lipper Global Classification
Total net assets
1 Green ARIEL FOCUS FD.INVR.CL. 01/02/2006 Equity US 40,8
Conventional FID.ADVI.ASST.MANAGER 85% CL.C 02/10/2006 Equity US 40,9
HARTFORD GW.OPPS.FD.CL. R3 21/12/2006 Equity US 44,5
2 Green ASPIRATION REDWOOD FUND 16/11/2015 Equity US 84,5
Conventional SEI INST MGD TAX-MANAGED MANAGED VOLATILITY Y 30/04/2015 Equity US 87,7
AQR TM LARGE CAP MULTI- STYLE FUND I 11/02/2015 Equity US 92,8
3 Green BROWN ADVISORY WINSLOW SUSTBY.FD.INSTL.SHS. 29/06/2012 Equity US 861,3
Conventional TOUCHSTONE FOCD.FD.CL.Y 16/04/2012 Equity US 829,1001
WELLS FARGO PREMIER LARGE CO GR FD R6 03/12/2012 Equity US 789,5
4 Green PARNASSUS ENDEAVOR FUND INVESTOR 29/04/2005 Equity US 2709,7
Conventional AMERICAN CENTURY MID CAP VALUE FUND I 31/01/2005 Equity US 2375,5
MFS VAL.FD.CL.R4 01/04/2005 Equity US 2975,6
5 Green PARNASSUS FUND INVESTOR 27/08/1987 Equity US 776,1001
Conventional ANCHOR SA WELLINGTON CAPITAL APPRECTN PORT 1 23/03/1987 Equity US 771
AMG MANAGERS BRANDYWINE FUND I 23/05/1986 Equity US 786,2
6 Green PARNASSUS MID CAP FUND INVESTOR 29/04/2005 Equity US 2271,2
Conventional ADVANCED SRS WELLINGTON MANAGEMENT HEDGED EQ PTF 05/12/2005 Equity US 2067,6
DFA US.CORE EQ.1 PRTF. 21/10/2005 Equity US 26071,1
7 Green TIAA-CREF INSTL.SOCIAL CHOICE EQ.FD.RTMT.CL. 12/12/2002 Equity US 657,7
Conventional
AMERICAN FUNDS AMCAP FUND R2 31/05/2002 Equity US 614,8
BRIGHTHOUSE/WELL CORE EQUITY OPPTY PTFL B 30/07/2002 Equity US 683,2
8 Green GREEN CENTURY EQUITY FUND INDIVIDUAL INVESTOR 22/09/1997 Equity US 243,4
Conventional AB GROWTH FUND ADVISOR 31/03/1997 Equity US 202,8
ALGER CAP.APPREC.FD.CL.C 08/08/1997 Equity US 217,3
9 Green PARNASSUS CORE EQUITY FUND INVESTOR 19/04/1993 Equity US Income 9591,898
Conventional PTNM.EQ.INC.FD.CL.A 14/10/1993 Equity US Income 8184,898
JP MORGAN EQUITY INCOME FUND I 01/09/1989 Equity US Income 9908
10 Green ARIEL APPRECIATION FUND INVESTOR CL. 19/07/1990 Equity US Sm&Mid Cap 997,3
Conventional ICM SML.CO.PRTF.INSTL. CL. 28/02/1991 Equity US Sm&Mid Cap 890
INVESCO OPPENHEIMER MID CAP VALUE FUND A 03/12/1991 Equity US Sm&Mid Cap 824,2
11 Green ARIEL FUND INVESTOR CL. 16/03/1987 Equity US Sm&Mid Cap 1303,8
Conventional NORTHWESTERN MUTUAL MCG STK PFOLIO 30/11/1990 Equity US Sm&Mid Cap 1095,2
INVESCO OPPENHEIMER DISCOVERY FUND A 02/02/1987 Equity US Sm&Mid Cap 1341,1
12 Green WALDEN SMALL CAP FUND 30/10/2008 Equity US Sm&Mid Cap 110,5
Conventional MML MID CAP GROWTH FUND SERVICE 15/08/2008 Equity US Sm&Mid Cap 103,4
NATIONWIDE NVIT MULT- MNGR MCG FD II 24/03/2008 Equity US Sm&Mid Cap 138,2
13 Green WALDEN SMID CAP FUND 29/06/2012 Equity US Sm&Mid Cap 57,1
Conventional NATIONWIDE BAILARD COGNITIVE VALUE FUND M 16/09/2013 Equity US Sm&Mid Cap 60
MADISON MID-CAP FD.CL.R6 29/02/2012 Equity US Sm&Mid Cap 54,1
This table presents the sample of green funds identified using the US SIF 2018 and the respective conventional funds. For each fund present the name of the fund, inception date, Lipper Global classification and the total net assets extracted from DataStream.
22
Over the period under analysis both fund portfolios and the market factors present positive mean excess returns, except the book-to-market (HML) and investment factor (CMA). Comparing the green fund portfolio with the green benchmark, the green portfolio presents higher mean monthly excess returns and a higher standard deviation. In addition, the conventional fund portfolio presents higher mean monthly excess returns and higher standard deviation than the conventional benchmark. Comparing both portfolios, the green portfolio presents higher mean excess returns than conventional funds and also a higher standard deviation, meaning that green funds present a higher risk. Comparing the benchmarks, the conventional benchmark has a higher mean monthly excess return and a lower standard deviation than the benchmark of the sector.
Regarding the symmetry of the distribution, both portfolios and benchmarks have a negative skewness (negatively skewed), which indicates that the left tail of the distribution is greater than the right tail. Regarding to the characterization of the peak of the distribution, both portfolios and benchmarks have exhibit excess kurtosis (higher than 3), which classifies it as leptokurtic.
Additionally, the normality test was performed. The results support that the portfolios of green and conventional funds and the benchmarks are not normally distributed, since we do not accept the null hypothesis of normality at the level of 5 %. For the risk factors, we only reject the null hypothesis for the HML and MOM factors. As argued by Adcock et al. (2012), the rejection of normality of returns supports the application of conditional models.
Table 2- Descriptive statistics of US green and conventional funds, market benchmarks and risk factors No. of obs. Mean
excess returns (%)
Standard deviation
(%)
Kurtosis Skewness Min Max Adj. 𝝌𝟐 P value
US green portfolio 188 0.672 4.44 5.866 -0.474 -0.196 0.175 19.73 0.0001 US conventional portfolio 188 0.663 4.20 5.192 -0.828 -0.187 0.117 24.90 0.0000 S&P500 188 0.662 3.93 5.090 -0.764 -0.169 0.109 15.72 0.0004 MSCI KLD 400 188 0.644 3.94 4.475 -0.594 -0.155 0.106 22.81 0.0000 SMB 188 0.0422 2.38 2.837 0.303 -0.0478 0.0681 3.08 0.2148 HML 188 -0.0737 2.55 5.364 0.0765 -0.112 0.0829 12.55 0.0019 RMW 188 0.307 1.55 3.468 0.240 -0.0399 0.0508 3.86 0.1449 CMA 188 -0.0434 1.41 2.873 0.329 -0.0333 0.0370 3.54 0.1699 MOM 188 0.109 4.40 22.29 -2.659 -0.344 0.125 . 0.0000
This table reports summary statistics for equally weighted portfolios of US green and conventional funds, market benchmarks and the additional risk factors. Mean excess returns, standard deviation, kurtosis, skewness, minimum and maximum for the period of February 2004 to September 2019. The Adj. 𝝌𝟐 is a statistic that is around a 𝝌𝟐 distribution with 2 degrees of freedom
23
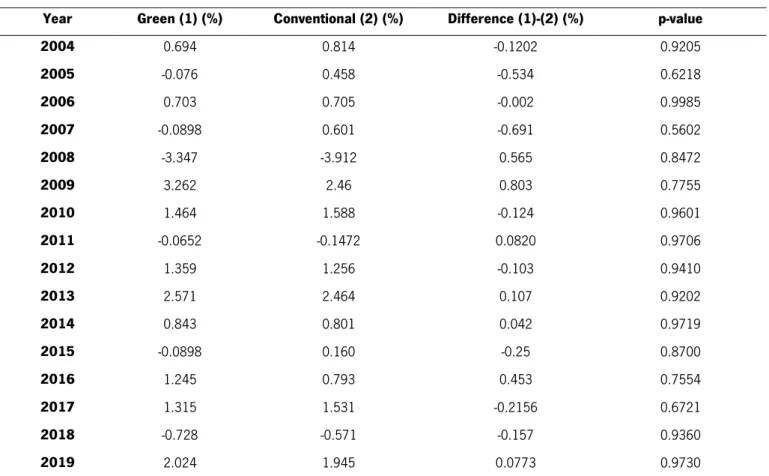
Table 3 reports the monthly mean excess returns for both portfolios (green and conventional) by years, from 2004 to 2019. From this table, it seems that green and conventional funds present similar fluctuations over time. In 2008, the year of the global financial crisis, the mean monthly excess returns dropped drastically for both green and conventional funds. This drop was higher for conventional funds. The mean monthly excess returns start to increase again in 2009. Analyzing the expansion periods, overall, conventional funds present higher values for the mean excess returns. However, in recession periods, green funds present higher values. Yet, there are no statistically significant differences between the mean monthly excess returns of green and conventional funds.
These results suggest the importance of controlling the funds’ performance by market states, since these fluctuations may be in accordance to the business cycles identified by the NBER.
Table 3- Mean excess returns by years for green fund and conventional funds
Year Green (1) (%) Conventional (2) (%) Difference (1)-(2) (%) p-value
2004 0.694 0.814 -0.1202 0.9205 2005 -0.076 0.458 -0.534 0.6218 2006 0.703 0.705 -0.002 0.9985 2007 -0.0898 0.601 -0.691 0.5602 2008 -3.347 -3.912 0.565 0.8472 2009 3.262 2.46 0.803 0.7755 2010 1.464 1.588 -0.124 0.9601 2011 -0.0652 -0.1472 0.0820 0.9706 2012 1.359 1.256 -0.103 0.9410 2013 2.571 2.464 0.107 0.9202 2014 0.843 0.801 0.042 0.9719 2015 -0.0898 0.160 -0.25 0.8700 2016 1.245 0.793 0.453 0.7554 2017 1.315 1.531 -0.2156 0.6721 2018 -0.728 -0.571 -0.157 0.9360 2019 2.024 1.945 0.0773 0.9730
This table reports the mean excess returns for the equally weighted portfolios of green and conventional, and for the difference between these two, by years. The p value is calculated for the difference of the mean between green and conventional funds.
24 5. EMPIRICAL RESULTS
This chapter presents the results on the performance of the US green and conventional funds. The analysis starts with the results of the unconditional multi-factor models (Carhart, 1997 and Fama and French, 2015) and then those of the conditional approach, as in Christopherson et al. (1998), applied to each model. Then we compare timing and selectivity abilities of both types of funds, using the multifactor version of the Treynor and Mazuy (1966) model. To finish we present the results of the Carhart (1997) four-factor model and Fama and French (2015) with a dummy variable, in order to analyze the performance of green and conventional funds in different market states.
5.1 Fund performance using unconditional models
Considering that multi-factor models are more useful to explain the cross-section of expected stock returns, we apply the Carhart (1997) four-factor model and the Fama and French (2015) five-factor model to evaluate fund performance.
5.1.1 Unconditional Carhart (1997) four-factor model
Table 4 presents the results of fund performance at the aggregate level for the Carhart (1997) four-factor model from 2004 to 2019 and summarizes the results on individual fund performance. Appendixes 1 and 2 detail the results for individual funds.
Panels A and B show the results considering a conventional index (S&P500) and a green index (MSCI KLD 400), respectively, as the market benchmark. As in Climent and Soriano (2011), this study also evaluates the “difference” portfolio, constructed by subtracting the returns of the conventional portfolio from the green portfolio. This portfolio is constructed in order to evaluate the differences in risk and return between the different investment approaches.
The explanatory power of the models is above 95% for the green and conventional portfolio regressions, which means that more than 95% of the variability of the excess returns is explained by the model. The explanatory power is slightly higher when the benchmark is the S&P500, which
25
means that the conventional index is more capable to explain portfolio performance than the SRI index.
Analysing panel A, none the portfolio alphas are statistically significant. Individually, there are 5 green funds with positive alpha coefficients, but only one is statistically significant. Regarding conventional funds, there are 10 conventional funds with positive alpha coefficients, but only one is statistically significant. Overall, the majority of green and conventional funds present neutral performance, so we can conclude that neither green or conventional funds perform significantly differently from the market. These results are consistent with previous studies (e.g., Climent and Soriano, 2011; Muñoz et al., 2014) on the performance of green funds. Climent and Soriano (2011) show that green funds underperform the market benchmark from 1987 to 2001, which is not in accordance with panel A. However, focusing in the period from 2001 to 2009, Climent and Soriano (2011) show that green and conventional funds did not perform differently from the market
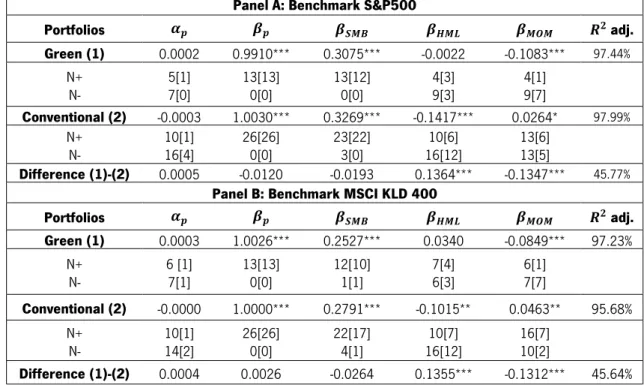
Table 4 - Unconditional Carhart four-factor model performance Panel A: Benchmark S&P500
Portfolios 𝜶𝒑 𝜷𝒑 𝜷𝑺𝑴𝑩 𝜷𝑯𝑴𝑳 𝜷𝑴𝑶𝑴 𝑹𝟐 adj. Green (1) 0.0002 0.9910*** 0.3075*** -0.0022 -0.1083*** 97.44% N+ N- 5[1] 7[0] 13[13] 0[0] 13[12] 0[0] 4[3] 9[3] 4[1] 9[7] Conventional (2) -0.0003 1.0030*** 0.3269*** -0.1417*** 0.0264* 97.99% N+ N- 10[1] 16[4] 26[26] 0[0] 23[22] 3[0] 10[6] 16[12] 13[6] 13[5] Difference (1)-(2) 0.0005 -0.0120 -0.0193 0.1364*** -0.1347*** 45.77%
Panel B: Benchmark MSCI KLD 400
Portfolios 𝜶𝒑 𝜷𝒑 𝜷𝑺𝑴𝑩 𝜷𝑯𝑴𝑳 𝜷𝑴𝑶𝑴 𝑹𝟐 adj. Green (1) 0.0003 1.0026*** 0.2527*** 0.0340 -0.0849*** 97.23% N+ N- 6 [1] 7[1] 13[13] 0[0] 12[10] 1[1] 7[4] 6[3] 6[1] 7[7] Conventional (2) -0.0000 1.0000*** 0.2791*** -0.1015** 0.0463** 95.68% N+ N- 10[1] 14[2] 26[26] 0[0] 22[17] 4[1] 10[7] 16[12] 16[7] 10[2] Difference (1)-(2) 0.0004 0.0026 -0.0264 0.1355*** -0.1312*** 45.64%
This table presents regression estimates for the equally weighted portfolios of US green and conventional funds, as well as the difference between these two portfolios, obtained from the four-factor model regressions with both S&P500 (Panel A) and KLD400 (Panel B) as benchmarks, from February 2004 -September 2019. It reports estimates of performance (𝜶𝒑), systematic risk (𝜷𝒑) , factor loadings associated to size (SMB),
book-to-market (HML) and momentum (MOM) factors and the adjusted coefficient of determination (𝑅 adj.). Standard errors are corrected for autocorrelation and heteroscedasticity following Newey and West (1987). The asterisks are used to identify statistical significance of the coefficients to a level of significance of 1% (***), 5% (**) and 10% (*). N+ and N- indicate the number of the funds that have positive and negative estimates, respectively. Within brackets the number of funds whose estimates are statistically significant at a 5% significance level are presented.
26
and that the difference between green and conventional funds is statistically insignificant. In panel B, using the MSCI KLD 400 as the market benchmark, the alpha coefficients are also statistically insignificant for both green and conventional portfolios, meaning a neutral performance. In sum, comparing the performance of green and conventional funds, whatever benchmark is used, we can observe that the alphas of the green performance are higher than those of the conventional portfolios, although the difference is not statistically significant.
In relation to market risk, the results show that betas are statistically significant at the 1% level for both green and conventional portfolios. Green funds present higher values of beta when the benchmark is the green benchmark (MSCI KLD 400), whereas the conventional funds exhibit higher beta when the benchmark is the conventional benchmark (S&P500). This means that green funds are more exposed to the green benchmark and the conventional funds to the conventional benchmark. However, there is no statistically significant difference regarding the market risk between the two portfolios. At the individual level, all coefficients associated with the market risk are positive and statistically significant.
Regarding the risk factors, the results demonstrate that green and conventional funds are more exposed to the size (SMB) factor, since this risk factor is statistically significant at the 1% level. At the individual level, the majority of the funds also present positive and statistically significant SMB coefficients.
The betas associated to the book-to-market (HML) factor are only statistically significant for conventional funds, with a negative sign, suggesting that conventional funds are more exposed to growth stocks than to value stocks. Observing the coefficients of the difference portfolio, we conclude that green funds are more exposed to value stocks than conventional funds.
The MOM risk factor is statistically significant for all portfolios. However, the green portfolio presents negative coefficients and the conventional portfolio positive coefficients. This means that green funds are more exposed to companies with poor performance in the recent past, while conventional funds are more exposed to companies with a good past performer.