Abstract – There is a clear need for risk management of future contracts in any company that tries to minimize equity losses and expenses arising from interest rate and price variations. The purpose of this work is to evaluate freight hedging strategies for the agricultural commodities market, mainly Alagoas sugar exports. To do this, it is necessary, in view of the way in which the market operates, to understand the hedge as one of the economic functions of futures commodities markets, used for protection and risk management. Knowledge of cost and logistics as applied to the agribusiness sector is also required. With this in hand, it is possible to define the variables and hedge models of freight cost risk for Alagoas sugar exports.
Keywords: commodities, future market operations, hedge evaluation.
Análise do hedge de risco do custo do frete de commodities
Resumo – Existe uma necessidade clara de gestão de risco com contratos futuros em qualquer em-presa que vise minimizar as perdas de capital e despesas decorrentes das taxas de juros e variações de preço. O objetivo deste trabalho é avaliar as estratégias de hedge de frete para o mercado de commodities agrícolas, principalmente as exportações de açúcar de Alagoas. Para isso, é necessá-rio, tendo em vista a maneira pela qual o mercado opera, entender que o hedge atua como uma das funções econômicas dos mercados futuros de commodities, usados para proteção e gerenciamento de riscos. Conhecimento de custo e logística aplicado ao setor do agronegócio também é necessá-rio. Com isso em mãos, pode-se definir as variáveis e os modelos de hedge de risco de frete para as exportações de açúcar de Alagoas.
Palavras-chave: commodities, operações em mercados futuros, avaliação de hedge.
1 Original recebido em 22/8/17 e aprovado em 4/11/2017.
2 Bacharel em Economia e Engenheiro de Produção, engenheiro da Eletropaulo. E-mail: [email protected] 3 Economista, doutor em Economia Aplicada, livre-docente, professor adjunto da Universidade Federal de Alagoas.
E-mail: [email protected]
4 Doutora em Administração, professora associada da Universidade Federal de Alagoas. E-mail: [email protected]
5 Economista, doutor em Economia da Indústria e da Tecnologia, professor adjunto da Universidade Federal de Alagoas.
E-mail: [email protected]
Risk hedge analysis
of commodity
freight cost
1
Matheus Baumgarten2
Waldemar Antônio da Rocha Souza3
Luciana Santa Rita4
André Maia Gomes Lages4
Introduction
Currently, Brazil is emerging as a leading exporter of food products. With approximately
23% of national GDP in 2015 and growth close to 4% per year, Brazilian agribusiness stands out as one of the main sectors of the national economy.
In addition, the sugar and ethanol sector accounted for 20% of the state’s GDP in 2015, corresponding to R$2 billion and employing 75,000 people directly and indirectly (STIAAL, 2018). That is why it deserves special attention in studies and research focused on the topics of infrastructure and international trade. As a result, the agents of the local production chain for the commodity need analysis techniques and tools to evaluate the behavioral dynamics of the sector.
Therefore, the results of hedge strate-gies can increase the efficiency of production, marketing, warehousing and logistics decisions made by agents in the Alagoas sugar production chain.
Considering the importance of sugar and logistics in Alagoas agribusiness, the purpose of this work is to analyze the risk hedge of the cost of commodities freight, studying the case of maritime freight of Alagoas sugar. The variables and risk management models associated with freight cost hedge are defined, providing the means to examine the structure of freight costs for world sugar and to compare them with those of Alagoas.
After the first introductory section, which provided a global view of the importance and position of Brazil in the world sugar market, this paper has six additional sections.
The second section discusses the emer-gence and functioning of derivative markets and the main contractual instruments used. Subsequently, the concept of the hedge as used for both risk protection and speculative purposes is approached from the point of view of the analysis of the proposed theme. The final part of this section deals with logistics and national infrastructure issues, specifically in the road and port systems.
In the third section, a comparison between Brazil and the United States is made, focusing on the issues of risk management and hedging, the methodology Americans use in grain negotia-tions, and the disposal of these products in both countries.
In the international arena, Brazil, as the largest exporter of soybeans, coffee, sugar and orange juice, is an agricultural superpower that competes with the US and Europe. Agribusiness is also responsible for the employment of most of the country’s economically active population (EAP), with 37% of the total in 2015 (Confederação Nacional da Agricultura, 2017).
However, these products, known as com-modities, suffer from intense price competition on a global scale. Unfortunately, deficiencies in the logistics infrastructure have proven to be a significant impediment to agroindustry expan-sion in Brazil. The resulting so-called “Brazil Cost” places the country in a less competitive position internationally, despite the high pro-duction potential.
The sugar and alcohol industry is one of the most affected by the precarious infrastructure in the country, mainly due to lack of investment and lack of specialized logistics knowledge.
Sugar has stood out as the third most active product on the national export agenda for years, placing Brazil as the world’s largest exporter and accounting for around 31% of the total product exported worldwide (Estados Unidos, 2017).
With 22% of world sugar production (ap-proximately 38 million tons out of the 170 million produced worldwide) in 2016, Brazil’s position in the international market for this product has been consolidated in relation to its main com-petitors (Estados Unidos, 2017).
On average, 55% of Brazilian sugarcane is transformed into alcohol and 45% is converted to sugar (Estados Unidos, 2017). The two macro-regions of Brazil that are considered in the litera-ture as sugarcane producers are the Center-South and the North-Northeast.
The sugar and alcohol industry has signifi-cant economic relevance for Alagoas. The state is the largest producer of the commodity in the Northeast Region. It produces 1.8 million tons, accounting for 51.8% of Northeastern produc-tion and 5.0% of Brazilian producproduc-tion in the 2015-2016 sugar harvest (Conab, 2016).
The fourth section elaborates the method-ology used and how the data and information pertaining to the theme was collected. The fifth section contains the results and topics for further discussion.
The conclusions are presented in section six. In the final section, texts and bibliographical references that provide the theoretical founda-tion for the work can be found.
Theoretical reference
This section discusses the evolution of the derivatives market and the main instruments used today. Some basic concepts about deriva-tives and futures markets, such as hedge terms, futures, options and basis, are explained below. Next, the Brazilian logistics system is explained.
Market concepts
Derivatives
Conceptually, derivatives markets are so named because the contracts traded in them and, consequently their values, are derived from other assets. Thus, a forward exchange contract, for example, is derived from the value of the traded currency that is contracted for a future price. The derivatives market provides risk mitigation by transferring market risk among the various agents that interact. Diversity of interests enables derivatives to meet different objectives, providing protection for some and profit per-spectives for others (Mendonça, 2005).
According to Reymão (2001), derivatives are used as a means to limit unexpected fluctua-tions in prices, namely: interest rates, exchange rates, commodities indices and commodities. Contracts may be traded in these markets in a variety of ways, such as futures contracts, forward contracts, options on various financial products, such as exchange rates, interest rates, and options on agricultural products, also known as commodities (soy, sugar and coffee, among others).
A derivative is a security that has its price dependent upon or derived from one or more underlying assets. The derivative itself is a con-tract between two or more parties based on the asset. Its value is determined by fluctuations in the underlying asset.
Derivatives are securities that move in terms of one or more underlying assets. They include options, swaps, futures and forward contracts. The underlying assets may be stocks, bonds, commodities, currencies, indices or inter-est rates.
Derivatives can be effective hedges against their underlying assets, since the relationship be-tween the two is clearly defined. The effective-ness of a derivative hedge is expressed in terms of delta, sometimes called a hedge ratio. Delta is the amount that the price of a derivative changes for a $1.00 movement in the price of the underly-ing asset.
Commodities
Commodities have a huge importance in the world economy. The term defines homoge-neous, high-consumption, low-industrialization products produced and traded by many com-panies with almost uniform quality. These “in nature” products (foods of vegetable or natural origin consumed in their natural state) are de-fined as soft commodities that can be stored for a certain period of time without losing quality.
Commodities are important in the world economy because they are used in commercial transactions, that is, in spot and future markets (where a contract for future delivery/payment is already concluded) and are traded on com-modity exchanges (in Brazil, the BM & BOVESPA - Stock, Commodities and Futures Exchange) in standard quantities. The commodities traded on BM & FBOVESPA are soybeans, cotton, corn, coffee, sugar, ethanol and bullion.
The choice of marketing mechanism depends on the general characteristics of the products and, mainly, on the characteristics of the transactions. For example, commodities are
iting loss, in that the loss is limited to the amount paid for the option.
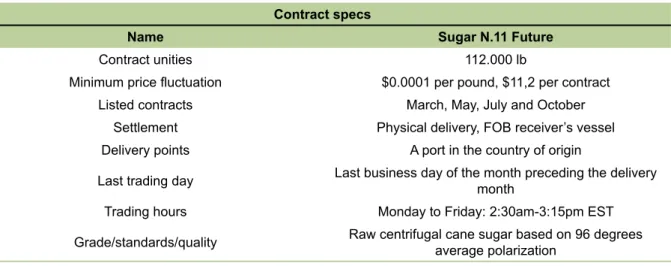
Sugar can be marketed under different conditions. For export, VHP, VVHP, crystal or demerara sugar is marketed. The most common sugar contract is Sugar # 11 (Table 1).
Hedging
Hedge operations are carried out in the derivatives markets of futures contract negotia-tions and it is in this aspect that the agents adopt strategic behaviors with the intention of reduc-ing risk, since uncertainty is inherent in these markets. At present, the most common hedging strategies used for risk management are forward contracts, futures contracts, swaps and options.
According to Leuthold & Garcia (2004), hedging acts as a protection mechanism that can be adopted by economic agents against possible losses arising from unexpected changes in the economy’s behavior.
According to Eiteman et al. (2002), the hedge policy is to take a position to acquire both an asset and a contract, characterizing a cash flow that will increase (fall) in value and com-pensate for a decrease (increase) in the value of an existing position.
traded efficiently through spot or futures market mechanisms.
Sugar
Sugar is a commodity traded like all other commodities in the futures market - however, the similarities between sugar and other commodi-ties end there. Most of the world›s sugar supply is not traded on the free market and sugar is highly subsidized in its home country. This can make it almost impossible to discover the true supply and demand for sugar. All governments, to some extent, intervene in the production and growth of sugar in their country.
The market where sugar is traded serves two purposes: to have one buyer for each seller and one seller for each buyer. It also provides a standardized place where sugar can be delivered through futures contracts.
Those interested in marketing sugar have only a few options to choose from. The first op-tion is to buy or sell a sugar futures contract. All futures contracts are standardized, which allows both hedgers and traders to assess the quality and quantity of the commodity.
The second option is to buy an option in sugar futures. This method has the benefit of
lim-Table 1. Specifications of Sugar Agreement No. 11 on ICE Exchange.
Contract specs
Name Sugar N.11 Future
Contract unities 112.000 lb
Minimum price fluctuation $0.0001 per pound, $11,2 per contract Listed contracts March, May, July and October
Settlement Physical delivery, FOB receiver’s vessel Delivery points A port in the country of origin
Last trading day Last business day of the month preceding the delivery month Trading hours Monday to Friday: 2:30am-3:15pm EST Grade/standards/quality Raw centrifugal cane sugar based on 96 degrees average polarization
For Ederington (1979) hedging is based on the principle that spot market prices and future market prices tend to rise and fall together. This movement is not necessarily identical but is gen-erally close enough that it is possible to reduce the risk of a loss in the spot market by taking an opposite position in the futures market. Taking opposite positions allows losses in one market to be offset by gains in the other.
Futures contracts
According to Eiteman et al. (2002), a futures contract is a commitment to make or receive delivery of a certain quantity and qual-ity of a commodqual-ity in the future at a specific delivery location. All terms of the agreement are standardized except for the price, which is determined by supply and demand.
This process of price determination takes place through an e-commerce trading system. All contracts are ultimately settled through a clearing transaction or delivery of the actual physical merchandise.
Futures and options on agricultural commodities have seen phenomenal growth in turnover in recent years due to increased global demand and the increasing availability of e-commerce for these commodities. It is now more important than ever to understand how to incorporate these tools into risk management.
This is because futures contracts are the underlying instruments in which the options are traded. Based on current market conditions and the specific objectives, decisions need to be made as to whether to use futures contracts, op-tions on futures contracts or other risk and price management alternatives.
According to Leuthold & Garcia (2004), futures markets exist mainly for hedging, that is, the management of price risks inherent in the purchase or sale of commodities. The word hedge means protection. The dictionary states that protection is “trying to avoid or lessen a loss by making counterbalanced investments.” In the context of futures trading, this is precisely what a
hedge is: a counterbalancing transaction involv-ing a position in the futures market that is op-posite to the current position in the spot market.
Options
According to Leuthold & Garcia (2004), just like stocks, government bonds or debentures, options are assets traded in the financial market. Since the price of the options results from the quotation of other assets such as stocks, stock indices or currencies, the options are classified as derivatives. This means that they are contracts between two parties that anticipate the purchase and sale of these assets at a future date for a pre-established price. Then one of the parties will, for example, have the right to buy or sell a share on the maturity date for a pre-determined price. The counterparty will have the obligation to pay the price stipulated by the option on the date on which the contract expires.
Speculation in the options market allows the holder of the option to exercise it or to let it expire without being used. Thus, the holder of a call option will only exercise the option when it is profitable, that is, if the spot price is greater than the exercise price (negotiated rate).
According to Eiteman et al. (2002), the advantages of option contracts include the limi-tation of the holder’s loss to the payment of the premium, which represents the cost of eliminat-ing the unfavorable scenario and the possibility of realizing gains, if the option at maturity has a lower exercise value (right to buy) or higher (right to sell) than the spot market value. On the other hand, the instrument has the disadvantage that there may be a loss of the premium if the option at maturity is higher (right to buy) or lower (right to sell) than the spot market value.
Basis
Fundamentally, Basis is defined as the lo-cal value of a commodity adjusted for price in the futures market, considering variables such as freight, handling, storage and quality, as well as local factors of supply and demand.
The local Basis is the difference between the local spot price for the commodity and its current price in the futures market. Futures mar-kets provide a standardized price for a specific location, delivery time and quality. The price of futures contracts gives buyers and sellers a well-known price based on futures contract standards. Grain buyers and sellers can use this price in the futures market as a parameter, adding quality premiums and subtracting transportation costs from the price in multiple locations. Prices will be adjusted to reflect shipping costs and quality differences.
The local grain base of a producer is de-fined as the difference between the cash spot price of local elevators and the future price quo-tation on some financial market. This basis is the difference between a cash market and a specific futures contract price, the difference reflecting transportation costs, elevator rates, storage costs and quality differences. The base is defined as:
Local base for futures = spot price - future contract
Logistics
Logistics is essential for the production, trading, storage and distribution of commodi-ties. Good planning is essential to carry out the necessary logistics operations in the marketing of commodities.
In addition to the cost, there are market variables, which make up the dynamic portion of the freight behavior. During the year, there is seasonality in freight prices, as a result of several factors such as the relationship between supply and demand of cargo and vehicles available for transportation, the commercial policies of transport undertakings, climatic influences on the sugar cane crop and on the conditions for logistics operations, the currency exchange rate (and the price of the product in the interna-tional market), logistics costs (involving storage and transport), transit time, and port unloading efficiency.
Sugar is transported from production cen-ters to ports in bulk and only by road. Usually the mills are responsible for transporting sugar to the ports, since they sell the FOB (free on board) product. In the case of mills that are not aggres-sive in managing freight costs, the traders will assume this responsibility.
In this market, the agent responsible for the vehicle also receives the goods in the port.
Road transport
When considering the importance of road freight in the determination of the final price of sugar for export, it is important to note that this varies greatly due to several factors that determine the total freight value, among them, transportation costs.
In the sugar market, the price of the final product is significantly impacted by the road transport system used and the formulation of the freight prices. In other words, the transportation sector contributes a significant percentage of the total cost of the product and must be taken into account in the process of planning and invest-ment by agents involved in the sector.
Road freight has a more direct influence on the compensation of the mills, since these companies are usually the ones who bear this cost.
Port system
In spite of the fact that a large proportion of agricultural exports pass through the Brazilian ports system, this system still has difficulty in meeting the demands placed on it, particularly for crops such as sugar cane and its products (sugar and alcohol). The Brazilian ports system has been undergoing a cycle of large investments in recent years, mainly carried out by private companies. According to the Exame Magazine Infrastructure Yearbook 2009/2010, private companies were planning to invest approximately R$30 billion in the period between 2010 and 2015.
In this manner, shipping companies, es-pecially North American ones, have started to explore opportunities to participate in the global distribution of industrialized products with low added value. However, the operational effi-ciency of these activities depends on compatible port infrastructure to expedite the activities of berthing, loading and unloading cargo.
In the Brazilian port terminals, road access is still a problem, which can be observed as con-gestion during harvest periods.
In addition, it has been observed that limits on the size of large vessels and storage capacities in the port and port retro areas are incompatible with the demand for the product during peak periods.
It is a well known fact that, in the pres-ent day, infrastructure is an important factor in the development of a region and of a country. According to Maia Júnior (2013), the port sec-tor in Brazil is the least developed, negatively impacting the overall infrastructure. According to Ballou (1998), logistics make a significant contribution to the entire value chain created around a product. One part of the value chain is the port terminals, which require specific meth-odologies so that the costs involved are within the projected ranges. However, for Varella et al. (2011) ports have a vital role in logistics and have been playing important roles and operating on multiple fronts.
Bloningen & Wilson (2008) affirm that, due to this significant role, there is even more pressure to improve the quality of maritime trans-port and efficiency in cargo handling.
In addition, according to Israel et al. (2013), the port sector, in the same way as any other organization, needs to measure its performance, that is, its productivity. Marlow & Paixão Casaca (2003) describe the productivity of the port stud-ied in their work based on the delay between the entry and exit of materials from the port. According to Marlow & Paixão Casaca (2003), inefficient port operations represent additional inventory costs for shippers, lower capacity
for port gain, and increased operating costs for transport operators.
Porto (2011) cites the importance that the port cargo market has been gaining in Brazil and elsewhere. The author also adds that in 2005, 649 million tons of cargo were transported through Brazilian ports. According to ANTAQ (Agência Nacional de Transportes Aquaviários, 2016) in 2011, around 903 million tons of cargo were handled at Brazilian ports and terminals. However, Maia Júnior (2013) states that Brazilian ports and terminals still perform comparatively poorly in the international arena.
Comparison between the
United States and Brazil
Sugar can appear in several forms: natural sugar can be found in the stem of sugar cane or beet root. Beet sugar is mainly produced in the United States and other countries with non-tropical climates. Sugar from sugarcane is mainly present in tropical climates, such as Brazil.
Most sugar-producing countries protect their domestic sugar market from foreign com-petition by establishing government policies and regulations affecting production. These measures may include quotas, import and export restric-tions, subsidies, tariffs, and customs duties, in the case of the United States and the countries of the European Union. Because of such policies, domestic sugar prices vary greatly from country to country.
NY 11 is used as the primary reference for uncontrolled raw sugar prices in the world. Another reference price is Lon 5, which is based on refined sugar and traded on LIFFE.
Sugar prices in Brazil are determined according to free market principles, the main indicator being the ESALQ index, but they are directly influenced by prices in the international market. Crude sugar prices in the United States and the European Union are substantially higher than the price of raw sugar in NY 11, while the
the consumption of sugar cane and beet sugar requires a free market for sugar production.
The US government protects domestic sugar production through a policy that controls the flow and subsidizes the price of the sugar it buys from the Dump Market. There are two main parts that make up the US sugar policy:
• The Tariff-rate quota (TRQ) - This ensures that there is enough sugar to meet both the needs of producers and consumers at fair prices. It sets the amount of im-ported sugar that can enter the country at a lower rate.
• The price support loan program - Na-tional sugar production is supported by the USDA Merchandise Credit Corpora-tion, which distributes non-recourse loans to sugar producers. The loan program can be viewed as a floor for market prices. If sugar producers cannot sell sugar at a price higher than the loan rate, they return the unsold sugar to the government.
The structure of freight prices is critical for the movement to PNW ports and the prices re-ceived by farmers. For a producer, the basis and future prices determine the spot price. An under-standing of how changes in the base and future price can affect the net price received per bushel is critical in evaluating marketing strategies.
This base calculation is used for both spot prices and, with adjustment for the cost of the lift, for the price of grain delivered months in the future.
Brazil
Crude sugar production costs in the center-south of Brazil are lower than those in the north-northeast region, because of the more favorable topography and climate, a more devel-oped transport infrastructure, and greater prox-imity of the mills to the large consumer centers in the country. The privatization of highways, port facilities and railways has improved the export price of raw sugar in Brazil is similar to the price
of NY 11 sugar.
The effect of protectionist policies on sugar prices in the United States shows the correlation between the domestic prices of this country, under contract NY 14, and international prices, represented by contract NY 11. Although the correlation is high, domestic prices stay at a much higher level than the international prices of the commodity. In the case of Brazil, domestic prices (CEPEA-ESALQ) follow the behavior of international prices, NY 11.
The impact of the oscillation of interna-tional sugar prices on production is softened mainly by two factors. The first one stems from the fact that many sugar producers operate in controlled markets, protected against price fluc-tuations and therefore do not tend to dramatically change production because of these variations. Secondly, the sugar cane crop, the largest source of global sugar production, is semi-perennial, with planting cycles ranging from two to seven years. In Brazil, the world’s largest producer, the average cycle is five years.
In recent years, international sugar prices have risen due to an overall reduction in inven-tories and production problems faced by some producers such as China, India and Thailand, mainly related to unfavorable climatic condi-tions. In addition to these events, the reduction of government subsidies for sugar production in the European Union has contributed to this movement. Brazil, as the global leader in sugar production, responsible for approximately 22% of world exports in the 2016 harvest, plays a key role in establishing sugar prices worldwide.
USA
Like all sugar-producing countries, the US has a protectionist policy in place for sugar prices. The higher sugar prices enjoyed by pro-ducers forces consumers to look at alternatives, a situation that has led to a significant number of companies switching to corn syrup. Increasing
infrastructure and transportation in Brazil, result-ing in reduced costs and shorter lead times for delivering sugar to world markets.
July to September is the off-season for the main suppliers of sugar in the world market. Demand, however, remains constant and, since Brazilian producers can supply sugar at that time, an export spike, not very accentuated, can be observed during that period, with a correspond-ing impact on the freight market.
Very Hight Polarization (VHP) is the most prevalent of the varieties of sugar destined for the foreign market, being the main type exported. This variety is characterized by surface polariza-tion, which ensures greater durability in the face of the weather encountered during transport, especially in consideration of the conditions and time required to reach the final destination.
Brazilian sugar exports consist basically of raw sugar and refined white sugar. The raw sugar exported is shipped in bulk for reprocessing at refineries. Refined sugar is used in the manufac-ture of food products or retail products. VHP is purer than the raw sugar traded on NY 11 and, as of July 1, 2006, commands a fixed premium of 4.05% on the price of raw sugar traded based on the NY 11 price.
The transportation of sugar from the pro-duction centers to the ports is also done in bulk in most cases and carried out only by road.
Bulk: Currently, due to its greater efficien-cy at the time of loading and unloading of the product, it is the standard most used by market agents. Due to the more stringent requirements that this mode demands, it is characterized as a slightly more expensive freight option, when compared to other packaging standards.
Traders are companies responsible for ne-gotiating the sale of the product to international buyers and are responsible for contracting and controlling the transport of sugar until delivery to the ship, at which time it becomes the respon-sibility of the buyer. The trading company has three disposal options. First, it can choose to use the services of the carrier, which, through its own
fleet, can fully dispose of the product or use, if necessary, the services of a cargo agency - in order to find independent truck drivers - if such contact has been established. The second option - which has been happening due to the greater bargaining power and quality of the large carriers - is the use of the cargo agencies, in which it is simply up to the agent to find some independent truck driver to perform the service. The last op-tion - a very rare case, due to the lack of guaran-tee on the part of the independent truckers and difficulty for the traders to locate them - is the direct contracting of a truck driver to carry out the service. This last option most often occurs in cases of very low volumes.
Other differences are found in the agroin-dustry systems of the two countries. In Brazil, there are a large number of employees in all links of the chain, the cane is often harvested manually and transported to the plant by road, and there are still significant challenges with transportation of the final product to the port (characteristics of a developing country). In the USA, there is a small number of workers at all links in the chain, the harvest is 100% mechanized, there is no competition in transporting the product to the terminals and grain is most often transported to the port by rail.
Alagoas
Sugar cane production has been a part of the history of Alagoas from its origin. The first mills were established in the middle of the 16th century. The sugar-alcohol sector has become the most important of the Alagoas economy, being the main source of jobs and economic development in the state.
Sugarcane production has grown, ethanol has been established as an export product, and expanded even more as sugarcane has been delivered as neutral alcohol. The sector is also involved in the production of energy from the biomass of sugarcane bagasse. All industries are self-sufficient, generating the necessary energy for their operation and some industries have
already started cogeneration projects, marketing the surplus on the national electrical grid.
The sugar is delivered in bulk by truck, direct from the mills to the ship, in Port I located in Jaraguá. Operations at the Port of Maceió began in 1942, but the last major investments in infrastructure were made three decades ago. Today, more than 2 million tons of bulk sugar are transported through the port.
Empat
Currently the company has 200 employ-ees and 16 plants and cooperatives use EMPAT services to transport their products. Thus, this study has significance both from an educational point of view and for the companies that supply VHP sugar in the state, as they are able to use the results in support of their operations. Around 1.2 million tons of bulk VHP sugar are exported per vintage. These figures correspond to approxi-mately 70 vessels being supplied (STIAAL, 2018). As per bulletin 14 of the Sugar and Alcohol Industry Union 1,160,189 tons of sugar were ex-ported in the 2015/2016 harvest. That is, 100% of the sugar produced by companies affiliated to the Syndicate passed through the Port and EMPAT (STIAAL, 2018). EMPAT is responsible for all shipments of bulk sugar from the State and has a static capacity of 180 thousand tons, with an average volume of 1.5 million metric tons of bulk sugar in the last harvest.
The average production per harvest in the State is 2,500,000 tons (including the companies not affiliated to the Union). As a result, almost half of the sugar produced in Alagoas has EMPAT as intermediary in the logistics process.
The country that buys the most sugar from Alagoas is Russia, followed by the US and Canada. These three countries buy 50% of the exported volume.
Methodology
The research described in this article was exploratory in nature. The results were obtained by comparing the management of the freight hedge for the sugar exports of the mills and cooperatives located in Maceió, Alagoas with the price and indices of international prices of maritime freight.
The methodology used is described below.
Bibliographic research
Bibliographic research was performed to refine the concepts, learn more about the subject and have the necessary knowledge to determine what would be the appropriate tool to analyze the management of the freight hedge.
Data collection
After acquiring knowledge in the area and learning what tools could be applied to hedge management, visits were made to companies. In conversations and interviews with managers and associated personnel, information was obtained in the areas of grain management, logistics, price analysis of the financial market, operational pro-cedures and risk management. Numerical data had already been collected from the operation of the Bloomberg Platform.
Survey data was collected for the period between January 2000 and January 2017, with monthly values accounting for 205 observations. The data referring to the price of sugar in Alagoas is based on CEPEA-ESALQ’s pricing methodol-ogy. Both the values of the historical international sugar series (ICE, Sugar # 11) and the values of the Baltic Dry Index were used together with data collected using the Bloomberg Platform.
Auxiliary tools
With the data collected, there was a need to store it in a suitable format for analysis and to make comparisons between possible hedging strategies. Excel software was used to compile
data from the Bloomberg Platform and perform the required analysis and additional calculations. EViews software was used for the construction and formulation of the sugar price regression in Alagoas and the International Freight Price.
Theoretical model
Let Ui be the i-th sugar-alcohol plant of
Alagoas, producing ethanol and sugar. Sugar is sold to the domestic and foreign markets, the majority being approximately 50% exported (UNICA, 2016). Also, the Tj importer, located abroad, for example a trading company, when buying Alagoas sugar, examines the competitive-ness of the import price. Thus, by the law of one price (LoP), we have that:
PALt + FALt = PMt (1)
Where: PALt = FOB price at the port of Maceió
(AL) for the export of Alagoas sugar at time t; FALt = sea freight price of AL sugar at time t, paid
by importer Tj;
PMt = international price of sugar at time t.
In addition, given the amount of sugar exported by the Ui,t plant, Qi,t , the profit of the
Ui,t plant and the importer Tj,t at time t, π(Ui,t) and π(Tj,t), are respectively:
π(Ui,t) = PALt × Qi,t - CPi,t (2)
π(Tj,t) = (PMt - PALt - FALt + µj,t) × Qi,t (3) Where, Qi,t = quantity sold by the plant Ui,t = quantity imported by Tj,t, at time t, Qi,t > 0; CPi,t = cost of sugar production of the Ui,t plant at time t;
µj,t = Tj,t importer's profit margin at time t; µj,t > 0. By hypothesis, the expected value of π(Tj,t) is positive, then by Equation 3:
π(Tj,t) = (PMt - PALt - FALt + µj,t) × Qi,t > 0,
Since Qi,t > 0, µj,t > 0 and PMt - PALt > 0, the strategic variable to determine the level of π(Tj,t) will be FALt, the cost of sea freight of
Alagoas sugar. Thus, the marginal profit variation between FALt and π(Tj,t) will be:
∂π(Tj,t) / ∂FALt
Therefore, the higher the cost of maritime freight for sugar exported from Alagoas, the lesser the profitability of the exporter and vice versa. Thus, the cost of maritime freight is strategic to identify the competitiveness of the price of sugar exported from Alagoas.
In this way, management strategies for the maritime freight of Alagoas sugar will be formu-lated to answer the questions posed. In particu-lar, from Equation 1, we have that:
FALt = PMt - PALt (4)
It is possible to calculate the price of sea freight of Alagoas sugar, FALt, taking as a proxy for the elements of Equation 4:
PMt = ICE sugar futures contract # 11 price from New York (USA), in monthly values, quoted in US cents per pound; converted to US$ per sack of 50 kg by multiplier 1.10231. Source: Bloomberg Platform;
PALt = FOB price in the port of Maceió (AL) of sugar exported from Alagoas; is a proxy pointed out by the series of Monthly Indicators of Sugar CEPEA/ESALQ - Alagoas - Internal Market, in US$ per sack of 50 kg. To determine the price, the multiplier 0.7474 was applied, calculating the FOB export price.
Next, based on the FALt values
calcu-lated using Equation 4, synthetic positions are formulated in the sea freight market, taking as a reference the Baltic Dry Index indicator of The Baltic Exchange6.
The Baltic Freight Index (BFI) is an
indica-tor of dry bulk load rates. It is not a navigation 6 Available at: <https://www.balticexchange.com/ and the Bloomberg Platform>.
index, but an indicator of the bulk cargo market. It is calculated by the Baltic Exchange, based in London, a key market for the global shipping business. The BDI is a measure of the price of transporting raw materials such as metals, grains and fossil fuels by sea.
The BDI is a compound of 4 sub-indices, each covering a different carrier size: Capesize, Panamax, Handysize and Supramax. To compile the index, members of the Baltic Exchange call dry bulk shippers around the world to see what their prices are for 22 different shipping routes around the globe. With these numbers in hand, they compile them and determine an average.
The formula used to calculate the BDI is:
[(Capesize TCavg + Panamax TCavg + + × Supramax TCavg + Handysize TCavg) / 4] ×
× 0.110345333 TCavg = Avg Mean Time
The BDI contains route evaluations based
only on “USD hire paid per day” time-charter rates. These companies that own bulk carriers earn revenue through two main channels: the charter market and the spot market. In the char-ter markets, bulk carriers are contracted at fixed rates over a fixed period (of several years), usu-ally with a renewal option. In the spot market, bulk carriers are contracted in the short term at the prevailing market rate.
Strategies for managing the cost of
maritime freight of Alagoas sugar
Based on the results of Equations 3 and 4, the importer Tj can apply three strategies to man-age the cost of sea freight of Alagoas sugar:
1) Do not use any type of price risk hedge of the sea freight of Alagoas sugar, thus incurring the total variance of freight prices, FALt, that is:
Max Var (FALt)
2) Formulate a naïve hedge with Forward Rate Agreement (FFA), using the Baltic
Dry Index. Thus, it assumes the same position in the forward and forward shipping markets. The synthetic position Πj,t at time t will be:
Πj,t = FALt - FFAt (5) Where: FFAt = position with Forward Rate Agreement (FFA) using the Baltic
Dry Index - BDI, identical to the mar-ket position of the sea freight, with cost
FALt;
3) Use an optimal hedge, with Forward Rate Agreement (FFA) applying the
Bal-tic Dry Index - BDI. Thus, assume a po-sition parameterized by b*, the optimum hedge ratio, 0 < b* < 1, in the marine freight forward market. The synthetic position Πj,t at time t will be:
Πj,t = FALt - b*FFAt (6) Myers and Thompson (1989) pioneered the concept of a generalized approach to hedging. They pointed out that the form of the equation to be used in the estimation is dependent on the assumptions about stochastic prices whose risks are being managed.
In the original work by Myers and Thompson, they suggest that the optimal hedge ratio, b, should be estimated with an OLS regression:
Pt = bFt + aXt-1,
where Pt is the spot price level, Ft is the future price level and Xt-1 is a vector of variables known at time t-1 that helps predict Pt and Ft.
Myers and Thompson (1989) suggest that
Xt-1 include delayed values of Pt and Ft, as well as production, storage, exports and consumer income. They also admit that "the specification of the model is ad hoc with economic theory, hypothesis testing and common sense used as guidelines." Moreover, the authors readily recog-nize that model specification is the most difficult part to estimate in generalized hedges.
In particular, b*, the optimum hedge ratio is calculated by applying OLS in first differences, according to the model of Myers and Thompson:
DFALt = c + b*DFFAt + et (7)
Where: DFALt = first difference of price of sea freight of Alagoas sugar, FALt;
c = constant;
b* = optimum hedge ratio for the Baltic Dry Index - BDI position;
DFFAt = first difference of the position with Forward Rate Agreement (FFA) using the Baltic
Dry Index - BDI;
et = standard OLS error term.
Finally, we calculate the variances of the returns of the three synthetic positions to com-pare the results of the strategies:
(8) Where Var(Πj,t) = variance of the synthetic posi-tion, in the three simulations;
rk = return of the synthetic position in period k; r_ = average return of the synthetic position;
n = number of observations.
Results and discussion
Results
In this section, we analyze the results of the calculations to see if it is possible to determine the naive and the thymus hedge for Alagoas Maritime Freight. After computing and formatting the data, the EViews Software was used to construct the following charts and tables.
The FREIGHT nomenclature represents the FALt = sea freight price of the AL sugar at time t, paid by the importer Tj. DFREIGHT is the
nomenclature used for the 1st FREIGHT differ-ence. The same idea is used for BDI (Baltic Dry Index) and DBDI.
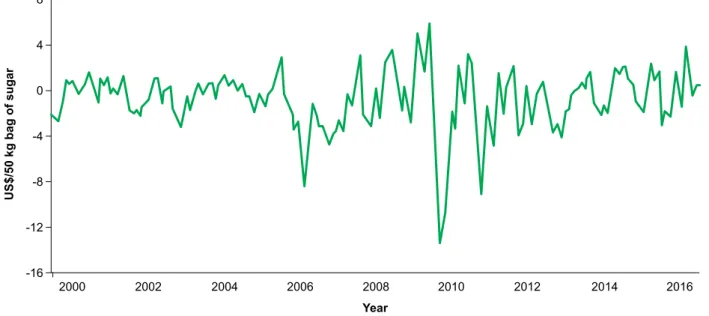
Figure 1 refers to the difference between the international sugar price negotiated at ICE and the FOB sugar price in Alagoas (CEPEA). This
Figure 1. Difference between the international sugar price negotiated at ICE and the FOB sugar price in
Alagoas.
difference is important, since it interacts with the Maritime Freight Price in Alagoas. If PMt - PALt> 0, FALt is the variable that will determine the gains or losses for the exporter.
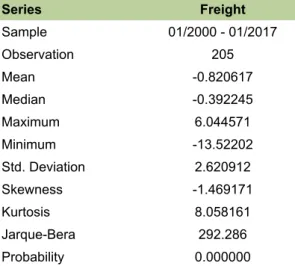
Table 2 shows the results of the FREIGHT Variable analysis in the EViews software. A total of 205 observations were used between January 2000 and January 2017. The results produced include the mean, maximum and minimum val-ues, standard deviation, Jaque-Bera test and the probability of occurrence.
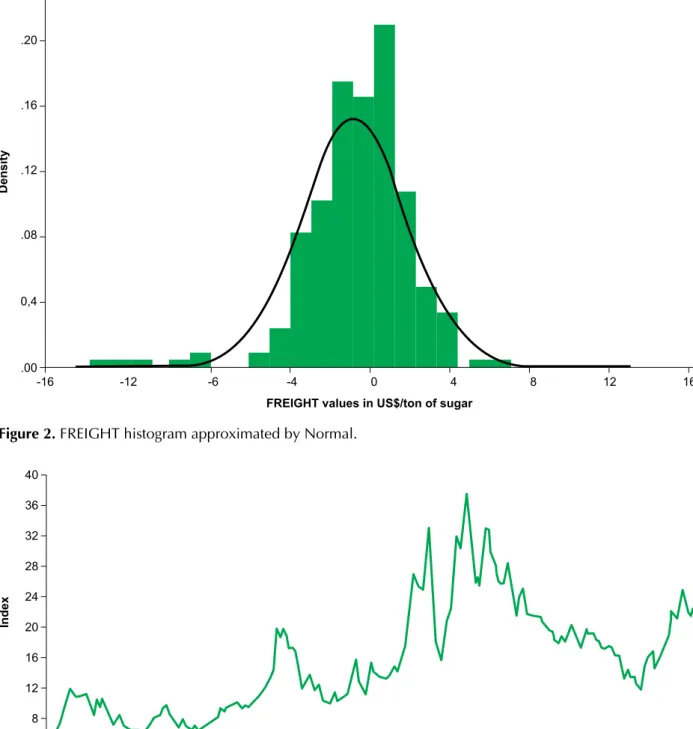
The residue normality is an essential as-sumption for the results of the fit of the linear regression model to be reliable. The ordinary least squares method makes no assumption about the probabilistic nature of the FREIGHT variable. Therefore, it is necessary to know if the variable employs some probability distribution. In Figure 2, we can see the FREIGHT histogram approximated by the normal distribution with 10 grouping points.
Figure 3 shows the monthly historical variation of BDI over 17 years.
As can be seen in this chart the BDI suffers from tremendous variations, alternating between high and low years, but with a tendency to in-crease over the long term. These values of the Index are closely related to the world production
Table 2. Descriptive values of the analysis of the
FREIGHT variable. Series Freight Sample 01/2000 - 01/2017 Observation 205 Mean -0.820617 Median -0.392245 Maximum 6.044571 Minimum -13.52202 Std. Deviation 2.620912 Skewness -1.469171 Kurtosis 8.058161 Jarque-Bera 292.286 Probability 0.000000
of commodities. Since the time period for the construction of new ships may be on the order of years, the quantity of ships available is not subject to great variations.
The FREIGHT and DFREIGHT - 1st FREIGHT difference and trend tests are shown in Table 3.
According to the analysis of Trend and Seasonality tests values that show probability less than 0.1, P < 0.05, are considered statisti-cally significant. This means that these values undergo temporal and trend influence. As can be seen in Table 3 above, the FREIGHT variable shows no trend, but indicates seasonality in 6 months. When the first difference is removed, DFREIGHT, there is the same lack of trend, and only 4 months are seasonal.
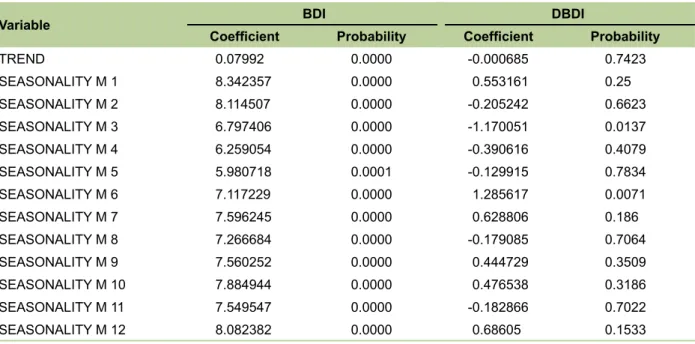
Table 4 shows the BDI trend and seasona-lity tests of DBDI - 1st BDI difference results.
When performing the same trend and sea-sonality tests with the BDI variables and their first difference, DBDI, the BDI shows a statistically significant trend and seasonality. For the DBDI test no trend is observed and the seasonality in months 3 and 6 coincides with DFREIGHT.
As a result of the above analysis, it is con-cluded that DBDI can be used to calculate the optimal hedge since it indicates interaction with DFREIGHT.
The next step, according to the model of Myers & Thompson (1989), is to examine the first differences of the variables, in this case BDI and FREIGHT.
After verifying the possibility of using the DBDI to calculate the optimal hedge, Eq. 7 was used to determine its value. It is calculated as b* applying OLS in first differences, according to the model of Myers and Thompson.
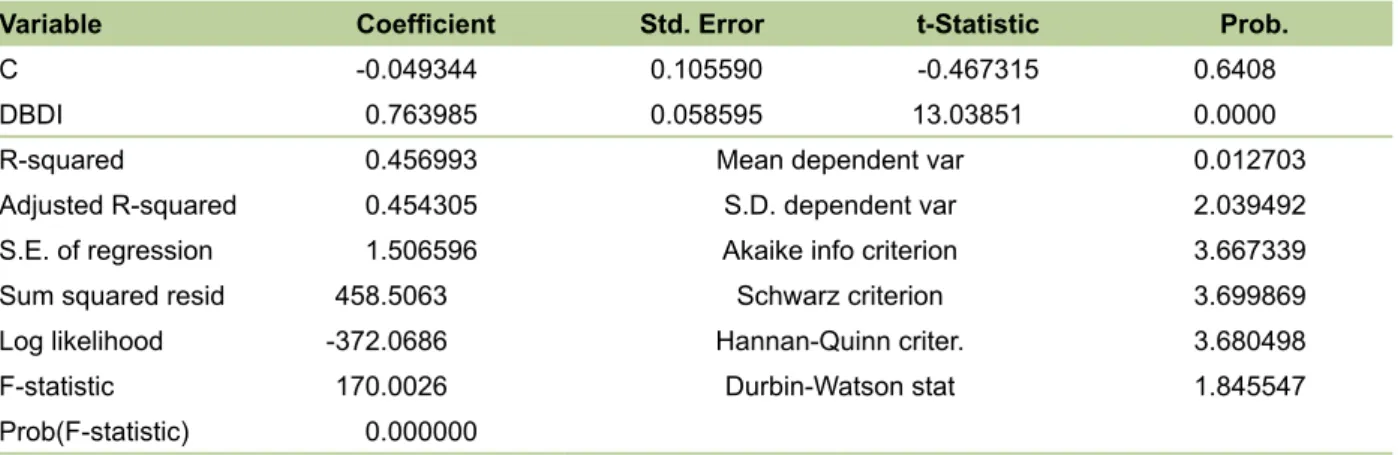
Table 5 shows the regression values of DFREIGHT as the dependent variable and DBDI as the independent variable with 205 observations.
Figure 2. FREIGHT histogram approximated by Normal.
Figure 3. BDI historical data between JAN 2000 and JAN 2017.
Examination of Table 5 shows that the 1% increase in the Baltic Dry Index equals an increase of 0.763985% in the sea freight price
in Alagoas, showing inelasticity. With test F de-monstrating statistical significance, we can adopt the DBDI variable influencing DFREIGHT.
Table 3. The FREIGHT and DFREIGHT - 1st FREIGHT difference and trend tests.
Variable Freight Dfreight
Coefifcient Probability Coefficient Probability
TREND -0.001456 0.6029 -0.000328 0.8834 SEASONALITY M 1 0.366411 0.5589 -0.795937 0.1242 SEASONALITY M 2 -0.300291 0.6363 -0.614409 0.2247 SEASONALITY M 3 -1.909716 0.003 -1.578695 0.0021 SEASONALITY M 4 -2.571128 0.0001 -0.630353 0.2147 SEASONALITY M 5 -2.620367 0.0001 -0.017852 0.972 SEASONALITY M 6 -1.21563 0.0586 1.436453 0.0052 SEASONALITY M 7 -1.012671 0.1153 0.235002 0.6451 SEASONALITY M 8 -1.516731 0.019 -0.471687 0.3565 SEASONALITY M 9 0.054054 0.9331 1.603485 0.002 SEASONALITY M 10 0.732703 0.2566 0.711679 0.1665 SEASONALITY M 11 0.522207 0.4193 -0.177138 0.7305 SEASONALITY M 12 1.34437 0.0389 0.855849 0.0978
Table 4. The BDI and DBDI - 1st FREIGHT difference and trend tests.
Variable BDI DBDI
Coefficient Probability Coefficient Probability
TREND 0.07992 0.0000 -0.000685 0.7423 SEASONALITY M 1 8.342357 0.0000 0.553161 0.25 SEASONALITY M 2 8.114507 0.0000 -0.205242 0.6623 SEASONALITY M 3 6.797406 0.0000 -1.170051 0.0137 SEASONALITY M 4 6.259054 0.0000 -0.390616 0.4079 SEASONALITY M 5 5.980718 0.0001 -0.129915 0.7834 SEASONALITY M 6 7.117229 0.0000 1.285617 0.0071 SEASONALITY M 7 7.596245 0.0000 0.628806 0.186 SEASONALITY M 8 7.266684 0.0000 -0.179085 0.7064 SEASONALITY M 9 7.560252 0.0000 0.444729 0.3509 SEASONALITY M 10 7.884944 0.0000 0.476538 0.3186 SEASONALITY M 11 7.549547 0.0000 -0.182866 0.7022 SEASONALITY M 12 8.082382 0.0000 0.68605 0.1533
R2 demonstrates the percentage reduction in variance if we adopt the optimal hedge strat-egy against the stratstrat-egy of not doing any type of hedge, that is, R2 is the efficiency of risk manage-ment. This shows that the optimal hedge strategy reduces risk and price variance by 45.7%.
Finally, the variances of the returns from the three synthetic positions were computed us-ing Eq. 8 to compare the results of the strategies, based on the previously calculated FALt values, and the BDI indicator reference. Table 6 reports the results of these calculations.
Table 5. DFREIGHT regression as dependent variable and DBDI as independent variable with 205
obser-vations.
Variable Coefficient Std. Error t-Statistic Prob.
C -0.049344 0.105590 -0.467315 0.6408
DBDI 0.763985 0.058595 13.03851 0.0000
R-squared 0.456993 Mean dependent var 0.012703
Adjusted R-squared 0.454305 S.D. dependent var 2.039492 S.E. of regression 1.506596 Akaike info criterion 3.667339
Sum squared resid 458.5063 Schwarz criterion 3.699869
Log likelihood -372.0686 Hannan-Quinn criter. 3.680498
F-statistic 170.0026 Durbin-Watson stat 1.845547
Prob(F-statistic) 0.000000
Table 6. Hedge strategies and their return
varian-ces.
Strategy Variance VAR reduction
No hedge 4,160
-Naïve hedge 2,440 -41,3%
Optimal hedge 2,259 -45,7%
As a result, both the naive and the opti-mal hedge strategies reduce the variance of the strategy of not using any type of hedge. With the non-hedge strategy, the importer would incur the total variance of freight prices (4.60). With the second strategy, naïve, there is already a 41.3% reduction of this variance. Applying the optimal hedge as shown in the regression above, there is a 45.7% reduction.
The results show that hedging has the ad-vantages of preventing spot price variations (spot) and managing the risks of the futures market, resulting in gains and competitive advantages throughout the production chain.
Additional research questions
After analyzing the econometric variables and their first differences, together with the
cal-culations of the naive and optimal hedges, we identify some research questions resulting from the impact of FALt on the profitability of the importer Tj:
1) How can the economic-financial engi-neering be defined so that the impact of the sea freight price on the profitability of the Alagoas sugar importer is mini-mized?
2) What financial instruments can be used operationally for the strategic manage-ment of the cost of sea freight for Ala-goas sugar?
3) How should strategies to minimize the cost of maritime freight of Alagoas sugar be implemented?
4) What methods should be used to ana-lyze the different ways of managing the sea freight cost of Alagoas sugar?
5) How should strategies to minimize the cost of maritime freight of Alagoas sugar be proposed?
6) What is the evaluation of the use of economic-financial strategies in syn-thetic positions to minimize the cost of sea freight of Alagoas sugar?
Conclusions
As previously mentioned, the objective of this work was to analyze the risk hedge of com-modity freight cost, studying the case of Alagoas sea freight. The variables and risk management models for freight cost hedging were defined, allowing the structure of freight costs for world sugar to be ex-amined and compared with those of Alagoas.
It has been said that you cannot predict the future, but you can manage it. By evaluating market expectations for the months ahead and reviewing past records, operators place them-selves in a better position to make decisions and to not miss a winning opportunity.
Based on the analysis and results presented in this article, it is evident that the first step to be considered by any institution that adopts some type of protection mechanism is to identify the risks inherent in its activity. Only after such iden-tification is it possible to choose the most suit-able hedging instruments for each type of risk. As explained above, the naïve hedging strategy reduces the variance by 41.3% and the optimal hedging strategy reduces the variance by 45.7%. Both hedge strategies are efficient mechanisms to reduce the variance in the cost of the maritime freight of Alagoas sugar.
However, improper and inappropriate use of such instruments can cause even greater losses to companies. These risks may result in financial and equity losses.
Therefore, recognizing the fundamental patterns and their underlying causes provides a framework with which to develop an informed marketing strategy during each month of the crop cycle. Freight components have been quite predictable over time and handling rates have been the source of volatility at the local base for export. Any reduction in risk and variance in the cost of sea freight for Alagoas sugar results in more competitive exports in the markets.
Sugar importers in Alagoas will realize economic benefits by reducing the risk of mari-time freight costs, particularly the reduction of
the impacts of seasonal shipments, lower finan-cial costs due to the volatility of monthly freight costs, and a stable scenario to make efficient allocation decisions.
BDI can be applied in synthetic derivative operations to minimize the risk of sea freight cost of Alagoas sugar, particularly the Forward Freight Agreements (FFAs) and over-the-counter derivatives, parameterized by the monthly BDI differential. One can examine the use of BDI in hedge strategies used for maritime freight of other Brazilian agricultural commodities.
In any case, it became evident in the de-velopment of this study that the sugar and alco-hol sector (with emphasis on sugar) shows great demand for increased intervention in the area of transportation infrastructure and useful tools for its commercialization. The implementation of a state-of-the-art logistics system along with market analysis tools would increase the sec-tor’s competitiveness vis-à-vis the international market.
References
AGÊNCIA NACIONAL DE TRANSPORTES
AQUAVIÁRIOS. Estatísticas. Available at: <http://portal. antaq.gov.br/index.php/estatisticas/>. Accessed on: June 30 2016.
BALLOU, R. Business logistics management: planning, organizing and controlling the supply chain. 4th ed.
London: Prentice Hall, 1998.
BLONINGEN, B.A.; WILSON, W.W. Port efficiency and trade flows. Review of International Economics, v.16, 2008. DOI: 10.1111/j.1467-9396.2007.00723.x. CEPEA. Centro de Estudos Avançados em Economia Aplicada. Preços do açúcar em Alagoas. Available at: <www.cepea.esalq.usp.br>. Accessed on: June 30 2016.
CONAB (Brasil). Relatório de safra 2015/2016. Available at: <https://www.conab.gov.br/>. Accessed on: June 30 2016.
CONFEDERAÇÃO NACIONAL DA AGRICULTURA (Brasil).
Confederação Nacional da Agricultura. Available at: <http://
EDERINGTON, L.H. The hedging performance of the new futures markets. The Journal of Finance, v.34, 1979. DOI: 10.1111/j.1540-6261.1979.tb02077.x.
EITEMAN, D.K.; STONEHILL, A.I.; MOFFETT, M.H.
Administração financeira e internacional. 9.ed. Porto
Alegre: Bookman, 2002.
ESTADOS UNIDOS. Department of Agriculture. U.S.
Department of Agriculture. Available at: <https://www.usda.
gov/wps/portal/usda/usdahome>. Accessed on: June 10 2017. ISRAEL, E.; GOMES, A.A.; FRAZZON, E.M.;
WESTPHAL, L.R. Desempenho operacional dos serviços conteinerizados: um estudo nos Portos de Santa Catarina. In: ENCONTRO NACIONAL DE ENGENHARIA DE PRODUÇÃO, 33., 2013, Salvador. Anais. Salvador: Abepro, 2013.
LEUTHOLD, R.M.; GARCIA, P. A selected review of
agricultural commodity futures and options markets.
Champaing: University of Illinois at Urbana-Champaing, 2004.
MAIA JÚNIOR, H. Um choque de concorrência nos portos brasileiros. Revista Exame, 13 jun. 2013. Available at: <http://exame.abril.com.br/revista-exame/noticias/um-choque-de-concorrencia>. Accessed on: June 10 2017. MARLOW, P.; PAIXÃO CASACA, A.C. Measuring lean ports performance. International Journal of Transport
Management, v.1, p.189-202, 2003. DOI: 10.1016/j.
ijtm.2003.12.002.
MENDONÇA, A.A. A decisão de realizar ou não hedge
no ambiente corporativo. São Paulo: BMF, 2005.
MYERS R.J.; THOMPSON S.R.; Generalized optimal hedge ratio estimation. The American Journal of
Agricultural Economics, v.71, p.858-867, 1989. DOI:
10.2307/1242663.
PORTO, M.M. Portos e o desenvolvimento. São Paulo: Aduaneiras, 2011.
REYMÃO, A.E.N. Cobertura de risco cambial. 2001. 126p. Dissertação (Mestrado) – Universidade Estadual de Campinas, Campinas.
STIAAL. Sindicato dos Trabalhadores na Indústria do Açúcar no Estado de Alagoas. Relatórios. 2018. Available at: <http://stia-alagoas.com.br/site/>. Accessed on: June 30 2018.
THE INTERCONTINENTAL EXCHANGE – ICE. SUGAR
#11 - Futures Contract Specifications. Available at:
<http://tradesofts.net/sbfuturescontractspecifications. html>. Accessed on: June 30 2018.
UNICA. União da Indústria de Cana-de-Açúcar.
Exportação anual de açúcar por estado brasileiro. 2016.
Disponível em: <http://www.unicadata.com.br/listagem. php?idMn=43>. Acesso em: May, 30 2017.
VARELLA, L.; FRAZZON, E.; NASCIMENTO, H.J.; BUSS, M.B.; Proposição de um modelo conceitual de plataforma logística adaptado à realidade do Estado de Santa Catarina. In: CONGRESSO DE PESQUISA E ENSINO EM TRANSPORTES, 35., 2011, Belo Horizonte. Anais. Belo Horizonte: Anpet, 2011.