Considerations on the diffuse seismicity
assumption and validity of the G-R law in
Stable Continental Regions (SCR)
Jorge D. Riera1, Ignacio Iturrioz2
ABSTRACT
It is well known that seismic activity is much higher along inter-plate boundaries, de-creasing markedly in intra-plate regions. Although a few locations in so-called Stable Continental Regions (SCRs) around the globe, like the New Madrid region in the USA, have been subjected to earthquakes with magnitudes above Mw = 8, the largest events
in most SCRs do not exceed Mw ≈ 7, and their prediction for engineering purposes
presents great difficulties on account of the scarce available evidence on seismic activ-ity in intra-plate regions. The situation led in the last two decades to extensive stud-ies promoted by EPRI. In view of the difficulty to identify seismogenic sources in most SCR areas, in such regions the assumption of diffuse seismicity is often accepted. The South American Plate is used in this paper as an illustrative example. The acceptance of the assumption of diffused seismicity justifies the adoption of a Poisson process to describe the distribution in time of the occurrence of seismic events in such locations. Note that, if in addition to the assumption of a Poisson process in time to describe the occurrence of seismic events, the distribution of the magnitudes of these events is assumed to be exponential, the result is the well-known Gutenberg-Richter relation. In the paper the authors examine available seismic data for a 1200km square region in the South American SCR, showing conclusively that the distribution of amplitudes is not exponential, but may be satisfactorily approximated by a Weibull (minimum) distribution, giving rise to a frequency-magnitude relation that differs from the G-R relation and that presents improved fit to available data, since the G-R law is just an specific case of the former. Moreover, the approach permits the identification of large seismic events that should not be included in the same data base as the background seismicity, since they are characterized by a different rate of occurrence.
Keywords: Diffuse Seismicity, Stable Continental Regions, Seismic Risk,
Gutenberg--Richter Law, b-value, Weibull distribution.
http://dx.doi.org/10.5335/rsee.v12i2/4544
1 Prof, PPGEC, Universidade Federal do Rio Grande do Sul, Porto Alegre, RS, Brasil E-mail: [email protected]
2 Prof. PROMEC, Universidade Federal do Rio Grande do Sul, Porto Alegre, RS, Brasil(PROMEC-UFRGS). Rua
Sarmento Leite 425, CEP: 90050-170, Porto Alegre, RS, Brasil. Tel: +55 51 3316-3255. E-mail: ignacio@mecanica. ufrgs.
1 Introduction
It is well known that seismic activity is much higher along inter-plate boundaries, decreasing perceptibly in intra-plate regions. Although a few locations in so-called Sta-ble Continental Regions (SCRs) around the globe, like the New Madrid region in the USA, have been subjected to earthquakes with magnitudes above Mw = 8, the largest
events in most SCRs do not exceed Mw ≈ 7, and their prediction for engineering
pur-poses presents great difficulties on account of the scarce available evidence on seismic activity in most intra-plate regions. The situation motivated extensive research on the topic, which resulted in the EPRI (1994, 2006) reports and led to the consolidation of the notion of SCR.
In view of the difficulties inherent in the identification of seismic sources in SCRs, the assumption of diffuse seismicity is often accepted in Seismic Risk Analysis in ge-neral, including also in the seismic risk assessment of Nuclear Power Plants (NPP) in those locations, like the South American Plate, used in this paper as an illustrative example. In such context, Riera and Iturrioz (2014) note that no objective criteria has been proposed to accept or reject the hypothesis that the currently used uniform seis-micity model is acceptable in any given site, subject that had been explored earlier by Beauval et al (2006).
In fact, the assumption of diffuse seismicity justifies the adoption of a Poisson pro-cess to describe the time distribution of the occurrence of seismic events in the region and, when the probability distribution of the magnitudes of seismic events is assumed
to be exponential, the result is the Gutenberg-Richter Law. In this paper the authors
examine available seismic data for a 1200km square region in the South American SCR, showing that the distribution of amplitudes is not exponential, although it may be satisfactorily modeled by a Weibull (minimum) distribution, giving rise to a relation that differs from the G-R Law and that presents an improved fit to available data in general, since the latter is just an specific case of the Weibull function. Moreover, the approach permits the identification of seismic events that should not be included in the background seismicity data, as will be briefly discussed below.
It is germane to underline that In recent years, developments in Solid Mechan-ics allowed the determination of reliable numerical predictions of the rupture process of nonhomogeneous quasi-fragile materials subjected to slowly increasing externally induced loads, allowing also predictions of the ensuing process of damage localization. With such purpose, the authors employed a model consisting of nodal masses linked by uniaxial nonlinear elements, which are generally known as lattice models and herein designated as Discrete Element Method (DEM). The method was employed, among other applications, to simulate the motion around a seismic fault (Dalguer et al, 2001). Similar approaches for analyzing heterogeneous quasi-fragile materials were proposed by other authors (Krajcinovic, 1996).
Independently, attempts to detect these events were conducted in laboratory ex-periments by means of so-called Acoustic Emission (AE) techniques, which register the occurrence and eventual propagation of micro fractures in solids subjected to different loading conditions, as described, for instance, by Pollock (1973), Turcotte et al (2003), Shiotani et al (1994) and Carpinteri et al (2006, 2009). Both the numerical predictions
mentioned in the preceding paragraph and experimental results suggest that the
as-sumption of an approximately uniform distribution of sources of AE events, jointly with a Poisson type time distribution of events, usually occur at the beginning of the loading process and hold until damage localization occurs. Afterwards, AE events at regions of damage localization tend to take place at more regularintervals, as shown, for example, in the studies of Krajcinovic et al (1998) and Riera and Iturrioz (2012). The preceding considerations lead to the conclusion that the occurrence of large seis-mic or AE events cannot be predicted by observations of small seisseis-mic or AE events.
For SCRs, such as the internal area of the South American plate considered in the illustrative example of Section 4, these considerations, although derived from observa-tions at very different time and space scales, also lend support to the assumption of dif-fuse seismicity associated to a Poisson time process, to describe background seismicity, i.e. small to moderate magnitude events (typically Mw < 5). Seismic risk assessments must be complemented by the independent consideration of data for large events (typi-cally Mw > 5). These outliers, in relation to the background seismicity data, must be caused by seismic events at regions of damage localization, that is, at larger faults along which the rupture may propagate distances of the order of a dozen km or longer. It is also shown in the following sections that the occurrence of background seismic events in the Brazilian SCR herein analyzed is not satisfactorily modelled by the G-R Law because the probability distribution of the magnitudes is not exponential.
2 Applicability of the gutenberg-richter law
Assuming that the magnitude m of seismic events occurred within a given region is characterized by a Type III (Weibull-minimum) probability distribution, the proba-bility of occurrence of an event with moment magnitude Mw larger than m is given by:
Prob(Mw > m) = exp[-(βm)γ] (1)
An exponent γ = 1 corresponds to the exponential distribution, in which case:
Prob(Mw >m) = exp[-(βm)] (2) Note that if the events occur in time according to a Poisson process and the dis-tribution of amplitudes is given by eq.(2), i.e. it is exponential, then a linear relation between the logarithm of the number of events and the maximum magnitude results, known in Seismology as the Gutenberg-Richter (G-R) relation. In case of the more general Type III distribution, it follows from equation (1) that when m is equal to the expected value μm then:
Prob(Mw > μm) = exp[-(β μm)γ]= 0.5 (3)
Taking natural logarithms of both sides of equation (3):
(β μm)γ = - ln (0.5) (4)
From which it follows that:
γ ln(β μm) = ln [ - ln (0.5)] (5) Hence:
ln(β μm) = ln [ - ln (0.5)] / γ (6)
ln(β μm) = - 0.3665/ γ) (7)
β μm = exp (- 0.3665/ γ) (8)
Since for any seismogenic region μm denotes the mean value of the magnitudes of all seismic events that occur in the region, equation (8) is a condition that any pair of parameters (β,γ) of a candidate Weibull distribution must satisfy. Thus for any γ value under examination, the parameter β will be given by:
β = exp (- 0.3665/ γ) / μm (9) It is a trivial but instructive exercise to confirm by simulation that the assump-tions (a) that seismic events occurrence in time define a Poisson Process and (b) the probability density function of the magnitudes is exponential (Weibull with γ = 1), lead to the linear relation between Log10 N and m widely known as Gutenberg-Richter law. Moreover, for Weibull (minimum) distributions characterized by γ > 1, the Log10 N vs. m
relation is a nonlinear function. If γ = 2, the quadratic law proposed by Esteva (1976) is derived:
Log10 N = ao + a1 m – a2 m2 (10)
The bi-linear law employed by Riera (2009):
Log N ( m ) = [(a1 – b1 m) f(m) + [(a2 – b2 m) [1-f(m)] (11) f(m) = exp[-(m – mc)/s] /{ 1+ exp[-(m – mc)/s] } (12) presents an improved fit to existing data in SCRs, in which the coefficient mc is related to the shape parameter in Weibull’s distribution of the magnitudes by the equation:
mc = 0.835 γ (13)
but, similarly to the G-R law, its validity would be generally restricted by the need to specify an upper limit of the magnitude. In summary, the Weibull (minimum) distri-bution constitutes a fairly flexible and general model of the magnitude distridistri-bution of seismic events registered in a region at an early stage of loading. The exponential dis-tribution (γ = 1) is a specific case that leads to the G-R law, which in fact only applies
the model has led researchers to pay great attention to the b-value, that is, to the slope of G-R straight line, and to the introduction of remedies to obvious deficiencies of the linear relation, like a cut-off or upper limit of the magnitude. Finally, note that there are certain similarities between the notion of characteristic earthquake and the larger earthquakes that occur in SCRs after damage localization has begun. In such cases, the source of the characteristic earthquake may be recognized as an active fault, rather than a number of unidentified, randomly distributed sources, or not, but it seems clear that the risk that results from so-called characteristic (i.e. large) earthquakes should
be assessed separately from the risk posed by background seismicity (i.e. small
earth-quakes), without merging them in a single probability distribution of the magnitudes.
3 Fit of censored data to frequency-magnitude plots
In the preceding derivations, N designates the number of seismic events recor-ded in the region and time period under consideration. Only events with magnitude exceeding a threshold value Mo are included in the data base, due to deficiencies in
the network of seismological stations, sensibility of recording instruments and other reasons, hence, let:
ΔN = number of events with magnitude Mw < Mo
N = number of events with magnitude Mw ≥ Mo (incomplete data set)
N + ΔN = total number of seismic events (complete data set) Then, eq.(1) leads to:
Prob (Mw > m) = exp [– (βm)γ] (14)
The probability of an event Mw > m may be estimated by the past relative fre-quency:
n / (N + ΔN ) = exp [-(βm)γ] (15)
in which n is the number of events with magnitude Mw > m. Expressing the left-hand side as:
n / (N + ΔN ) = (1/a) n / N (16)
in which a = 1+ΔN/N is a dimensionless number equal to or larger than 1 and taking logarithms of both sides of eq. (15) leads to:
Log10 (n/N) = Log10 a – 0.43429 (βm)γ (17)
Setting m = Mo in eq. (14), it may be shown that:
a = 1 + { 1 – exp[– (βMo)γ]} / exp[– (βM
o)γ] (18)
Introducing eq. (18) into eq. (17), an expression in γ and β results. For Type III (Weibull) distribution, the expected value is given by:
4 The diffuse seismicity assumption in SCR
The assessment of the diffuse seismicity assumption in a 1200km square area within a SCR conducted by Riera and Iturrioz (2014), as a preliminary step in the exa-mination of the frequency-magnitude relation, will be partially reproduced in this sec-tion. For such purpose, the south-eastern region of Brazil located within the expanded 1600km square area shown in Figure 1, designated by Berrocal et al (2013) as Seismo--Tectonic Province of the South East (PSS), was considered. The epicenters of seismic events with moment magnitude Mw ≥ 1.5 are indicated by blue circles. Actually both the catalog reported by Berrocal et al, (2011), employed by Riera and Iturrioz (2014) in the assessment under discussion, and the updated and expanded catalog (Berrocal
et al, 2013), contain information on events with magnitudes in the body wave scale mb
≥ 2. For the assessment, moment magnitudes were determined from the mb scale by means of the equation:
Mw= 1.157 mb_obs ̶ 0.84 (20)
Assumpção and Drouet (2013) derived afterwards a regression equation for the SCR under consideration that differs marginally from eq. (20).
Figure 1: Distribution of epicenters of seismic events (Mw ≥ 1.5) recorded in the 54 years period between 1959 and 2013 within a 1200km square area in South-Eastern Brazilian SCR. The red triangle at (23.08° S, 44.45° W) shows the site of the Angra dos Reis NPP (CNAAA).
The magnitudes of seismic events included in the 2011 Catalog were plotted in Fig-ure 2, which also shows the locations of nodal points (observation nodes), spaced 12.5 km in a regular grid used by Riera and Iturrioz (2014) to assess the spatial distribution of seismic activity in two areas of the South American SCR. It should be underlined that the focal depth z is not known for most events in the catalog, but all reported seismic events are considered by Berrocal et al (2011) as shallow events (z ≤ 20km). Next step in the analysis consists of determining the number of events with epicenters within circles of increasing diameter, centered at the nodes of the grid, in the 50 years period under consideration. This index is shown in Figure 3 (left column) for circles of radius equal to R= 50 km. The right column of the same figure shows plots of the sum of the magnitudes, rather than the simple sum of the number of events, which provides an alternative, yet similar view of the seismic activity. As an initial step in the assess-ment of the available data, the evolution of the mean value of ln(n) for each radius was examined. It was assumed that linear equations are valid for small and for large values of R, with the boundary ξC between both ranges to be determined. The transition is modeled by the logistic function f [ln (R)]. Setting ξ = ln (R), the adopted relations are:
Log N (ξ ) = (a1 – b1 ξ) f(ξ) + (a2 – b2 ξ) [1-f(ξ)] (20) f(ξ) = exp[-(ξ – ξC)/0.2] /{ 1+ exp[-(ξ – ξC)/0.2] } (21)
Figure 2: Magnitude Mw of seismic events in SCR 1200 km square region (Berrocal et al, 2011). The small triangles indicate the locations of observation nodes in the grid. The red dots indicate the location of epicenters, in the Atlantic Ocean, of seismic events considered outliers (See Section 5).
Figure 3: Distribution of epicenters of seismic events within the PPS 1200 km region in Brazil, in the 50 years period between1961 and 2011. (left) number of events in circular regions of radius R and (right) sum of magnitudes of events within each circle.
Radius of circles centered at nodes of grid: R= 50 km.
Figure 4 presents a plot of equations (20) and (21) fitted to the mean values of ln (N) by means of a non-linear regression analysis. Adopting by trial and error a location parameter of the logistic function equal to ξC = 4.2, leads to coefficients a1 = -1.0796, b1= - 0.5339, a2 = -6.9635 and b2 = -1.9218. The last coefficient, applicable to large R values, is close to 2, thus suggesting uniformly distributed seismicity, but the authors are not aware of any criteria to accept or reject such hypothesis.
In relation to the last issue, Beauval et al (2006) argue that although Seismicity is a complex phenomenon, it may nevertheless be quantified using fractal concepts. In fact, fault networks and distributions of epicenters seem to have fractal properties (Goltz, 1998). Thus, a natural way to analyze the spatial distribution of seismicity is to determine the fractal dimension (D-value). This D-value is an extension of the Eu-clidean dimension and measures the degree of clustering of earthquakes. In a two-di-mensional space, D can be a decimal number and ranges from 0 (point) to 2.0 (uniform distribution in a 2D space). Beauval et al (2006) aimed at characterizing the bias in
probabilistic hazard estimates resulting from the incomplete knowledge of the degree of clustering of the true seismicity distribution. The fractal dimension considered in their study is the correlation dimension (Grassberger and Procaccia, 1983). Although the assessment of the diffused seismicity assumption presented in this study does not follow the approach described by Beauval et al (2006), the concepts are useful in the interpretation of the results shown in Figure 4: in case of uniformly distributed diffuse seismicity the slope b2 should be exactly 2. The observed difference, less than 2%, is judged to be compatible in the present case with the uniform seismicity assumption.
Figure 4; Plot of equations (20) and (21) fitted to the mean values of ln (n), yielding a1 = -1.0796, b1= - 0.5339, a2 = -6.9635, b2 = -1.9218. For R=10, 25, 50, 100, 200, 300, 500Km. The location param-eter of the logistic function is ξC = 4.2.
5 Frequency-magnitude relations in SCR
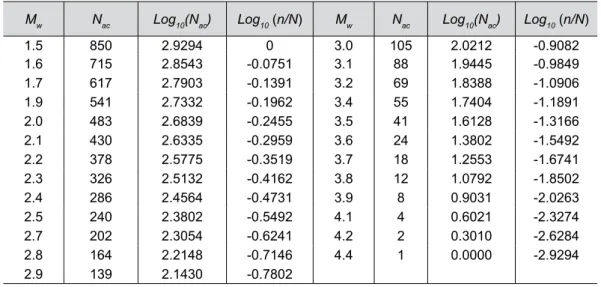
Available seismic data (Berrocal et al, 2013) recorded within the square region with 1600 km sides in the South American SCR shown in Figure 1 was used as an illustrative example. The Mw magnitudes as well as Log10 (n/N) values are shown in Table 1. Three events (Mw = 4.7, 4.8 and 5.2) in the data base, with magnitudes Mw > 4.4, were regarded as outliers in a preliminary analysis, as justified below. The epicen-ters of these three events are located in the Atlantic Ocean, at distances larger than 100 km from the coastline, and were not included in the diffuse seismicity region under consideration.
Thus, eqs. (17) and (18) were fitted to the values shown in Table 1 by means of nonlinear regression, to estimate the values of Log10 a, β and. Note that, as previously defined, the positive coefficient a ≥ 1 is given by:
a = 1+ΔN/N (20)
The value of the mean value μm of the (N+γN) complete set is not known, but it may be estimated by means of eq. (8), which leads to:
μm = exp (- 0.3665/ γ) /β (21) The coefficients obtained for the N = 852 events are γ=3.1672, γ =0.41 and a=1.0109. Applying then equation (20) and (21), μm=2.1412 and γN =93 result. The standard er-ror is s=0.04866, and the correlation coefficient = 0.998453. The mean value for the censored data set N was determined as μm=2.95.
Table 1: Values of Mw and cumulative number of events Nac for the SCR area shown in Figure 1. Three
events Mw ≥ 4,4 were deleted from the data base.
Mw Nac Log10(Nac) Log10 (n/N) Mw Nac Log10(Nac) Log10 (n/N)
1.5 850 2.9294 0 3.0 105 2.0212 -0.9082 1.6 715 2.8543 -0.0751 3.1 88 1.9445 -0.9849 1.7 617 2.7903 -0.1391 3.2 69 1.8388 -1.0906 1.9 541 2.7332 -0.1962 3.4 55 1.7404 -1.1891 2.0 483 2.6839 -0.2455 3.5 41 1.6128 -1.3166 2.1 430 2.6335 -0.2959 3.6 24 1.3802 -1.5492 2.2 378 2.5775 -0.3519 3.7 18 1.2553 -1.6741 2.3 326 2.5132 -0.4162 3.8 12 1.0792 -1.8502 2.4 286 2.4564 -0.4731 3.9 8 0.9031 -2.0263 2.5 240 2.3802 -0.5492 4.1 4 0.6021 -2.3274 2.7 202 2.3054 -0.6241 4.2 2 0.3010 -2.6284 2.8 164 2.2148 -0.7146 4.4 1 0.0000 -2.9294 2.9 139 2.1430 -0.7802
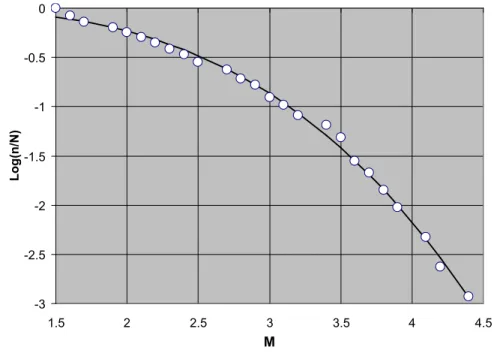
The data points presented in Table 1 as well as the Weibull Type III distribution based fit are shown in Figure 5. The agreement between the observed seismic data and the theoretical model is quite satisfactory. The events (Mw = 4.7, 4.8 and 5.2) were removed from the original data set employing standard criteria of statistical analysis, supported by the locations of the epicenters, all of them more than 100km offshore. The authors contend that these events must be taken into consideration in association with another seismic source, which requires additional study, but in principle may not cause seismic events with epicenters in the neighborhood of the Angra dos Reis NPP.
Figure 5: Relation between Log(n/N) and Mw for the approximately 1200 km square area around Angra dos Reis NPP in the South American SCR. Three events characterized by Mw ≥ 4,4 occurred in the region in the 50 years considered in the analysis were deleted from the data base in order to be
assessed independently. -3 -2.5 -2 -1.5 -1 -0.5 0 1.5 2 2.5 3 3.5 4 4.5 M Log(n/N)
6 Proposed model for stable continental regions (SCR)
The evidence available in so-called Stable Continental Regions (SCR), jointly with both numerical and experimental analyses of solids subjected to various stress states, strongly suggest that at initial stages of the loading process, in other words for low
magnitude events, the assumptions of diffuse seismicity associated to an extreme Type
III distribution of the magnitudes lead to Log(n/N) vs. Mw relations that satisfactorily fit available data. Note that the widely used Gutenberg-Richter law, which implies an exponential distribution of the amplitudes, requires the introduction of upper and lower limits of the magnitude to preserve a reasonable fit to instrumental data. The upper limit avoids the prediction of unrealistically high frequencies of occurrence of high magnitude events.
As damage localization occurs, the Poisson process assumption increasingly fails to describe the occurrence in time of seismic (or AE) events, which as damage grows appear to take place at more regular intervals in specific seismic or AE sources. The so-called characteristic earthquake constitutes an alternative scheme to account for the occurrence of these larger seismic events. The basic equations of the model are presented next.
Assuming that the magnitude m of seismic events that occur in a given region is characterized by a Type III (Weibull-minimum) probability distribution, the probabi-lity of occurrence of a seismic event in the region of magnitude Mw larger than m is given by:
Prob(Mw > m) = exp[-(βm)γ] = z (22)
The probability of occurrence of an event with magnitude Mw > m in a group of N events from the same population may be determined from the expression:
Prob(Mw > m)N = 1 – (1 – z)N (23) Hence, the annual probability pa of exceeding the magnitude m may be determined by means of equation (23), in which N >1 is set equal to the expected number of seismic events per year:
pa = 1 – (1 – z)N (24)
Finally, the annual probability of exceeding the magnitude m within a circular or annular area A contained in the region under consideration may be determined by the product η pa, in which:
η = A / AT (25)
AT denotes the total area of the region. When the frequency of occurrence of seis-mic events μ in the region (events/year) is smaller than one, a different scheme must be resorted to.
7 Magnitude distribution of seismic events at the PSS
It was previously established that (a) the assumption of uniformly distributed dif-fuse seismicity in the so-called Seismo-Tectonic Province of the South-East (PSS) in the Brazilian Stable Continental Region is not rejected by the data and (b) the data collected in the last 50 years is satisfactorily fitted by equation (1), with parameters γ = 3.1672, β = 0.41. In this preliminary assessment, the mean number of events per year is estimated as N = 20. The total area of the region considered in the data base is nominally 1200 × 1200 = 1.44 × 10⁶ km2, but quite likely a significant number of events
are missing in the triangles close to the corners of the square region, which led to the adoption of a reduced effective area, estimated as AT = 106 km2.
Consider now a circular region of radius r1 centered at a location of interest in the diffuse seismicity region. If this region is divided in an inner circle and an annular region with equal areas ½ π r12, it may readily be found that the radius of the inner
circle is r1/ √2. In the ensuing discretization procedure it will be admitted that this value (0.7071 r1) estimates the mean distance between the epicenter of seismic events occurred within the circle of radius r1 and the center of the circle. Similarly, for the ad-jacent annular region with external radius r2, the mean distance results:
r = 0.707 (r12 + r
22)½ (26)
Eq. (26) is applicable to any annular section with internal and external radii r1 and
r2 respectively. The radii (in km) of the circles in which the area around the location of interest was subdivided in the discretization scheme, as well as internal and external radii and mean distances to the center for each annular sector, are presented in Table 2, which also shows the values of coefficient η given by equation (4) for the various zones.
Table 2: Coefficients η (× 10-3) for circular or annular areas and mean epicentral distances.
Zone 1 2 3 4 5 6 7 8
ri (km) 0 14.14 24.33 34.75 61.58 94.91 140.88 318.31
re(km) 14.14 24.33 34.75 61.58 94.91 140.88 318.31 564.19
R(km) 10 20 30 50 80 120 246 458
η 0.656 1.23 1.93 8.12 16.3 34.1 256 682
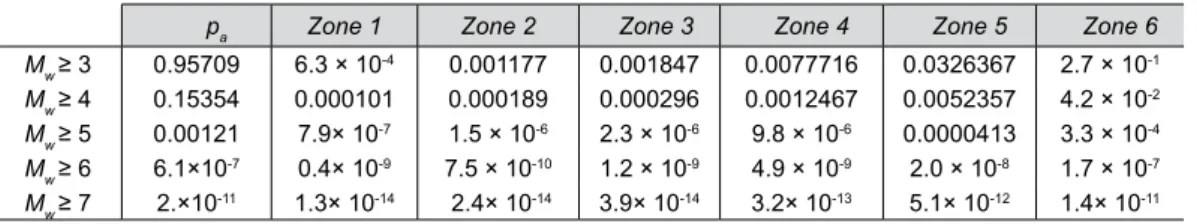
For such case, Table 3 presents the annual probability of occurrence of seismic events of moment magnitudes equal to or larger then Mw in the range(3,7) within an-nular areas characterized by the discretization described before and mean distances to the center up to 120km, determined employing equations (2-4) and the parameters indicated above.
Table 3: Annual probability of occurrence of seismic events in circular or annular areas within PSS.
pa Zone 1 Zone 2 Zone 3 Zone 4 Zone 5 Zone 6
Mw ≥ 3 0.95709 6.3 × 10⁻⁴ 0.001177 0.001847 0.0077716 0.0326367 2.7 × 10⁻¹
Mw ≥ 4 0.15354 0.000101 0.000189 0.000296 0.0012467 0.0052357 4.2 × 10⁻²
Mw ≥ 5 0.00121 7.9× 10⁻⁷ 1.5 × 10⁻⁶ 2.3 × 10⁻⁶ 9.8 × 10⁻⁶ 0.0000413 3.3 × 10⁻⁴
Mw ≥ 6 6.1×10⁻⁷ 0.4× 10⁻⁹ 7.5 × 10⁻¹⁰ 1.2 × 10⁻⁹ 4.9 × 10⁻⁹ 2.0 × 10⁻⁸ 1.7 × 10⁻⁷
Figure 6: Relation between Log (pa), in which pa denotes the annual probability that the magnitude Mw be exceeded in the region and within Zones 1 to 6, assuming uniform diffuse seismicity (back-ground earthquakes in SCR). -14 -12 -10 -8 -6 -4 -2 0 3 4 5 6 7 Mw Log( pa ) pa=1-(1-z)^N Zone 1 Zone 2 Zone 3 Zone 4 Zone 5 Zone 6
8 Distribution of large magnitude earthquakes
Three events (Mw = 4.7, 4.8 and 5.2) in the data base considered in the previous section, with magnitudes Mw > 4.4, were regarded as outliers in the analysis of the complete data base. The epicenters of these three events were located in the Atlantic Ocean, at distances larger than 100 km from the coastline. It is herein assumed that these events belong in a different group of seismic events, which presents similarities with the notion of characteristic earthquake (Youngs and Coppersmith, 1985; Bommer and Stafford, 2008). These larger events must be described by a different distribution of magnitudes and rate of occurrence in relation to the background events. In connection with the latter, the assumption of a Poisson Process will be maintained, with a mean recurrence period equal to No = 16.7 years, based on the observation of three events in the last 50 years, resulting in a mean frequency μ = 0.06/year.
There is also very scarce data to estimate the parameters of a probability distribu-tion of the magnitude, let alone its funcdistribu-tional form. Thus, it will be assumed that the magnitude m of large seismic events occurred within the region under consideration is characterized by a Type III (Raleigh) distribution with two parameters. Hence, given an event, the probability that its magnitude is larger than m would be given by:
Prob(Mw > m) = 1 - exp{-[β(m - Mmin )]2} = z; ( m > M
min ) (27)
In which the bound Mmin = 4.5 was adopted so that all outliers of the previous anal-ysis (Mw ≥ 4.7) are included. The remaining parameter γ= 1.25 was determined from
the condition that the mean value of the distribution (27) slightly exceeds the largest observed value Mw= 5.2 in the 50 years sample.
The annual probability of exceedance of magnitude Mw is estimated assuming that the events are independent. According to the multiplicative rule, it then follows that:
pa = μ Prob(Mw > m) (28)
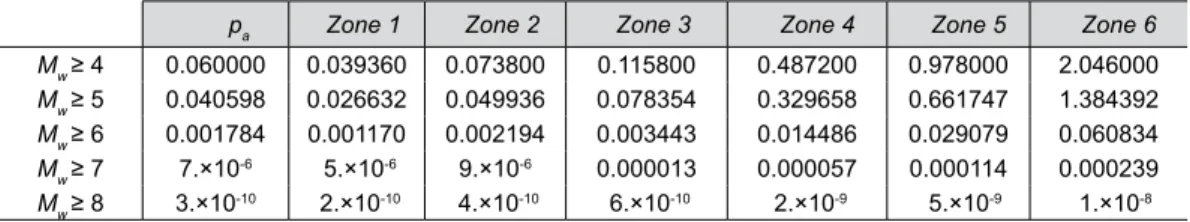
in which the mean frequency μ = 0.06/year estimates the probability that a large seis-mic event actually occurs. For the parameters indicated above, Table 4 presents then the annual probability of occurrence of seismic events with moment magnitudes Mw in the range(4, 8) within the circular or annular areas previously described, for large earthquake events, and diffuse (uniform) seismicity in the region. Note that it was shown before that this assumption may be accepted for background seismicity events (Mw < 4,5). It is also applied for the larger earthquakes considered in this section.
Table 4: Annual probability of occurrence of large seismic events in the region and probabilities (× 10-3) of seismic events in zones admitting the diffuse (uniform) seismicity assumption.
pa Zone 1 Zone 2 Zone 3 Zone 4 Zone 5 Zone 6
Mw ≥ 4 0.060000 0.039360 0.073800 0.115800 0.487200 0.978000 2.046000
Mw ≥ 5 0.040598 0.026632 0.049936 0.078354 0.329658 0.661747 1.384392
Mw ≥ 6 0.001784 0.001170 0.002194 0.003443 0.014486 0.029079 0.060834
Mw ≥ 7 7.×10-6 5.×10-6 9.×10-6 0.000013 0.000057 0.000114 0.000239
Mw ≥ 8 3.×10-10 2.×10-10 4.×10-10 6.×10-10 2.×10-9 5.×10-9 1.×10-8 Figure 7 shows the resulting relation between Log (pa), in which pa denotes the an-nual probability that the magnitude Mw of large earthquakes be exceeded within region
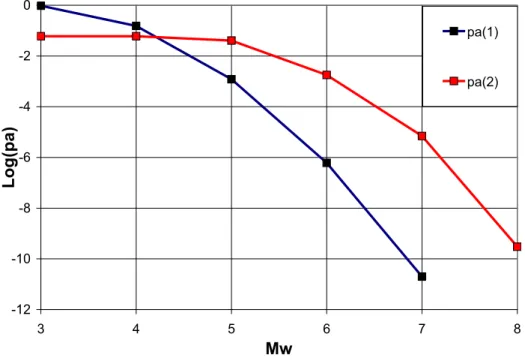
i and Mw for Zones 1 to 6 around location of interest. It was assumed that the diffuse (uniform) seismicity assumption is applicable. Finally, Figure 8 presents the relation between Log (pa), in which pa denotes the annual probability that the magnitude Mw be exceeded in the region under consideration, of total area AT ≈ 106 km2, and M
w for background seismicity pa (1) and characteristic earthquakes pa (2). The probability per km2 may be estimated, assuming diffuse (uniform) seismicity by dividing the values
Table 5: Annual probability of occurrence (× 10-3) of small and large seismic events in entire PSS region. pa (Table 7.2) pa (Table 8.1) pa (combined)
Mw ≥ 3 0.95709 0.060000 0.95966 Mw ≥ 4 0.15354 0.060000 0.20433 Mw ≥ 5 0.00121 0.040598 0.041759 Mw ≥ 6 6.1×10⁻⁷ 0.001784 0.001810 Mw ≥ 7 2.×10-11 7.×10-6 7.×10-6 Mw ≥ 8 0. 3.×10-10 3.×10-10
Figure 7: Relation between Log (pa), in which pa denotes the annual probability that the magnitude Mw be exceeded in the entire region and within Zones 1 to 6, assuming uniform diffuse seismicity (characteristic, large magnitude earthquakes in SCR).
-14 -12 -10 -8 -6 -4 -2 3 4 5 6 7 8 Mw Log( pa ) pa=Eq. (28) Zone 1 Zone 2 Zone 3 Zone 4 Zone 5 Zone 6
Figure 8: Relation between Log (pa), in which pa denotes the annual probability that the magnitude Mw be exceeded in the region of total area AT ≈ 106 km2 under consideration and M
w for background
seismicity pa (1) and characteristic earthquakes pa (2).
-12 -10 -8 -6 -4 -2 0 3 4 5 6 7 8 Mw Log( pa ) pa(1) pa(2)
7 Conclusions
The paper presents an assessment of models and assumptions currently employed in the seismic reliability analysis of engineering systems, with focus on the assump-tion of diffuse (uniform) seismicity and on the validity of the Gutenberg-Richter (G-R) relation. It is shown that, since the so-called G-R law implies the validity of the as-sumptions that seismic events occur as a Poisson time sequence, with the amplitudes of individual events characterized by an exponential probability distribution, the latter is an unnecessary simplifying assumption. Data for an approximately 106 km2 area in
the South American Stable Continental Region (SCR) shows that the Weibull extreme type III distribution satisfactorily fits the magnitudes observed in the last decades, for which instrumental observations are available. Resorting to a general Type III distri-bution, which includes the G-R relation as a special case, has two important advanta-ges: (a) it allows the identification of events that ought to be considered samples of a
different group of seismic events (characterized by a different rate of occurrence) and
(b) it eliminates the need to introduce a cut-off or maximum magnitude in the analysis, in order to maintain a relation that would otherwise overestimate the rate of
occur-rence of large magnitude events. As an illustration, the analysis is completed with a preliminary model, also founded on the assumption of a Poisson process, to account for the larger earthquakes, which occur in SCRs much less frequently and render the characterization of seismic sources very difficult. The proposed approach may also be useful in the assessment of inherent uncertainties, aspect of the problem not discussed in this paper.
Acknowledgements
The authors gratefully acknowledge the support of CNPq and CAPES (Brazil).
References
Ambrosini, D., Curadelli, O. and Mingorance, F. (2006): “Historical and instrumental seismicity within a 600 km-radius circular area around the Atucha II NPP”, Internal Res. Report submit-ted to CNEA, Argentina.
Assumpção, M. and Drouet, S. (2013): personal communication.
Beauval, C., S. Hainzl and F. Scherbaum (2006): “The Impact of the Spatial Uniform Distribu-tion of Seismicity on Probabilistic Seismic-Hazard Analysis”, Bulletin of the Seismological Soci-ety of America (BSSA),Vol.96, No. 6, pp. 2465-2471,doi:
Berrocal & Associates (2011): “Estudos sismológicos relacionados com o sitio das Usinas Nucle-ares de Angra dos Reis e Auscultação da sismicidade regional através da Estação Sismográfica de Angra dos Res (ESAR)”, Relatório Técnico No. 7, Submetido a Eletronuclear, ETN, Julho-Dezembro 2011.
Berrocal & Associates (2013): “Estudos sismológicos relacionados com o sitio das Usinas Nuclea-res de Angra dos Reis e auscultação da sismicidade regional através da Estação Sismográfica de Angra dos Res (ESAR)”, Relatório Técnico No. 10, Submetido a Eletronuclear, ETN, Jan-Junho 2013.
Carpinteri A., Lacidogna G., Niccolini G. (2006): “Critical behaviour in concrete structures and damage localization by acoustic emission”. Key Eng Materials. 2006; 312:305–10.
Carpinteri, A., Lacidogna, G, Puzzi, S.(2009): “From criticality to final collapse: evolution of the b-value from 1.5 to 1.0”; Chaos, Solitons and Fractals, 41, 843–853.
Chakrabarti B. K., Benguigui L. G. (1997): “Statistical Physics of Fracture and Breakdown in Disordered Systems“. Clarendon Press, Oxford.
Chiaia B., Vervuurt A., Van Mier J. G. (1997): “Lattice model evaluation of progressive failure in disordered particle composites”. Engineering Fracture Mechanics, 7; 57/2/3:301-318.
Dalguer L. A., Irikura K., Riera J. D., Chiu H. C. (2001): “The importance of the dynamic source effects on strong ground motion during the 1999 Chi-Chi, Taiwan, earthquake: Brief interpre-tation of the damage distribution on buildings”. Bull. Seismological. Soc. Am.(BSSA) 2001; 91:1112-1127.
Electric Power Research Institute-EPRI (1994): “The earthquakes of stable continental regions”, Edited by J.F. Schneider, EPRI-TR-102261-V1-V5, Dec.1994.
Electric Power Research Institute-EPRI (2006): “CEUS SSC – The Central and Eastern United States Seismic Source Characterization for Nuclear Facilities”.
Esteva, L. (1976): “Seismicity” , Chapter 7, in Seismic Risk in Engineering Decisions, Edited by C. Lomnitz and E. Rosenbluth, Elsevier Scientific Publications, London.
Goltz, C. (1998): “Fractal and Chaotic Properties of Earthquakes”, Lecture Notes in Earth Sciences, Springer Verlag, New York, 175pp.
Grassberger, P. and Procaccia. I. (1983). “Measuring the strangeness of strange attractors”, Physica, 9D, 189–208.
Krajcinovic D.:”Damage Mechanics” (1996), Elsevier, Amsterdam.
Pollock A. A.: “Acoustic emission-2: acoustic emission amplitudes”, Nondestructive Testing, Oc-tober 1973; 6(5): 264–9.
Riera, J.D. and Iturrioz, I. (2012): “The Gutenberg-Richter and similar laws and their relation with numerical and experimental laboratory results”, 15th World Conf. on Earth. Eng., Paper 5827, 15WCEE, Lisbon, Portugal.
Riera, J.D. and Iturrioz, I. (2013): "Performance of the Gutenberg-Richter law in numerical and laboratory experiments", Transactions, 22th. International Conference on Structural Mecha-nics in Reactor Tech. (SMiRT 22), San Francisco, CA, USA, 2013.
Riera, J.D. and Iturrioz, I. (2014): “Considerations on the diffuse seismicity assumption in Stable Continental Regions”, International J. of Advanced Seismology, Vol 1, Issue 1, pp. 16-28, Cloud Publications.
Shiotani T., Fujii K., Aoki T., Amou K. (1994): “Evaluation of progressive failure using AE sour-ces and improved b-value on slope model tests”. Prog Acoustic Emission, 7:529–34.
Turcotte, D. L. (1997): “Fractals and Chaos in Geology and Geophysics”, Cambridge University Press, New York, USA.
Turcotte D. L., Newman W.I. and Sherbakov R. (2003): “Micro and macroscopic models of rock fracture”, Geophys J. Int., 2003; 152:718–28.
Youngs, R.R. and Coppersmith, K.J. (1985): "Implications of fault slip rates and earthquake recurrence models to probabilistic seismic hazard estimates", Bulletin, Seismological Soc. Of America (BSSA), Vol. 75, No. 4, pp.939-964.