513 R. gest. sust. ambient., Florianópolis, v. 9, n. esp , p. 513-531, fev. 2020
ECONOMIC, ENVIRONMENTAL AND PRODUCTIVE PRACTICES INFLUENCE ON THE INDUSTRIAL ENERGETIC EFFICIENCY
DOI: http://dx.doi.org/10.19177/rgsa.v9e02020513-531
Fábio de Oliveira Neves1 Henrique Ewbank 2 José Arnaldo Frutuoso Roveda 3 Andrea Trianni 4 Fernando Pinhabel Marafão 5 Sandra Regina Monteiro Masalskiene Roveda 6
ABSTRACT
The industrial energetic efficiency (EE) is recognized as one of the main factors for the reduction of gas emissions that cause the greenhouse effect and for the improvement of the industrial competiveness. Within this context, many papers of the international literature have proposed different indicators of industrial, economic and environmental behavior, so as to promote the EE inside the industries. However, such proposals do not generally check the result of the joint work for more than one indicator in the organizations, making more global analysis more difficult related to EE. This paper aims to check which environmental, economic and industrial practices indicators influence the EE of the industries. The data have been collected from the framework developed by Trianni et al. (2014), that analysed the main energetic efficiency measures for the technologies: motors, lighting, compressed air and HVAC systems (heating, ventilation and air conditioning). A logistic regression model has been adjusted for understand the relationship the economic, environmental and productive practices behavior on the
1 PhD student in Environmental Sciences. São Paulo State University (Unesp). [email protected] 2 PhD in Management (UFRJ). Sorocaba Engineering School. [email protected]
3 PhD in Mathematical (UNB). São Paulo State University (Unesp). [email protected] 4 PhD in Industrial Engineering (Politecnico di Milano/Italy) . University of Technology Sydney . [email protected]
5 PhD in Eletrical Engineering. São Paulo State University (Unesp). [email protected] 6 PhD in Mathematical (UNB). São Paulo State University (Unesp). [email protected]
514 R. gest. sust. ambient., Florianópolis, v. 9, n. esp , p. 513-531, fev. 2020
energetic efficiency. Results suggest that a healthy workplace enables investments in equipment and machinery, allowing the EE inside the industries.
Key words: Energy Efficiency. Industry. Indicators. Logistic Regression. Technology
1 INTRODUÇÃO
The industrial energetic efficiency is recognized as an important cost reduction tool, improving the productive process and decreasing emission of residues that impact the environment. To understand the energy demand of the industrial sector, it is important to assess the performance of the policies related to energetic efficiency, and to define and assess the potential of future improvements of energy savings by the industries (TRIANNI et al., 2014; NORMAL, 2017).
The energetic efficiency of the industrial sector has a large potential of consumption improvements, since the final total use of energy in the industry was 2.6 Btoe in 1990, with prospecting growth of 4.2 Btoe for 2020 (Bp, 2019). Those numbers respond for 37% (156 Ej) of the final use of energy, besides representing a constant increase of 1% since 2010. The growth of the energetic consumption has been largely driven by a long-term continuous trend of production increase in sub-sectors of the intensive energy industry, like chemicals, iron, steel, cement, paper, and cellulose and aluminum (IEA, 2019).
This growth makes the energetic efficiency an attractive target for the safety of energy through the influence of new technologies, processes and products, energy sources, economic issues and managerial priorities in the decision making processes (TANAKA, 2011). In addition, the energetic efficiency may be improved by a large variety of technical actions, such as:
a. Maintenance, renovation and re-adequacy of the equipment to fight degradation.
b. Retrofitting, replacement and removal of obsolete equipment.
c. Improvement of the process control, to improve the energetic efficiency and materials and general productivity of the process.
515 R. gest. sust. ambient., Florianópolis, v. 9, n. esp , p. 513-531, fev. 2020
Still, technical actions can be provided in interventions in cross-cutting technologies7, because these technologies comprise most of the industrial energy consumption. Among the examples of cross-cutting technologies include electric motor driven systems, which account for about 70% of the worldwide electricity consumption in industrial industries (IEA, 2011; CAGNO & TRIANNI, 2014; TRIANNI et al., 2014).The industrial lighting is the most disseminated cross-cutting technology and corresponds to about 5% of the worldwide electricity consumption (IEA, 2006). Compressed air may reach about 10% of the industrial electricity consumption, while the systems HVAC (heating, ventilation, and air conditioning) have an interval of 10 to 20% of the final energy consumption in some industrial contexts (CAGNO & TRIANNI, 2014; TRIANNI et al., 2014).
Energetic efficiency policies are very relevant in saving energy consumption. Although, the rate of implementation of those policies are very low, not exceeding 50% of the recommended actions (ANDERSON & NEWELL, 2004, BUNSE et al., 2011; CAGNO & TRIANNI, 2012). This lack of implementation is due to many barriers, such as those related to economic and information aspects (SORREl et al., 2004; CAGNO et al., 2010; TRIANNI et al., 2013a; TRIANNI et al., 2013b; TRIANNI et al., 2014). These critical factors show that such barriers are not sufficiently transmitted to the industrial decision makers through a more in-depth view of the usefulness of the implementation of measures of energetic efficiency. This shows the impact on the production system, its problems related to the effective implementation, as well as the interactions with other parts where the industrial productivity may present to the decision makers when the main perspectives and characterization are not evident. (TRIANNI et al., 2014).
Therefore, those crytical factors develop in two main approaches. The first is related to general energy policies, especially regarding costs, and do not explain the real specificity of energetic efficiency measures to be promoted, such as investments affecting energetic and operational issues, consequently impacting the production performance. The second, the energy policy makers in the industries are estimulated to leverage an enhanced understanding to support the decision makers in a clear and efficient way. (SHIPLEY & ELLIOT, 2006; CAGNO & TRIANNI, 2014).
516 R. gest. sust. ambient., Florianópolis, v. 9, n. esp , p. 513-531, fev. 2020
Pye & Mackane (2000) recognize that when quantifying the benefits and even the barriers for the implementation of the energy management improvement in the industries help understand the financial opportunities of the investments on energetic efficiency measures. Taking into consideration that the energy economy is a prime factor for the industrial decision making, and therefore it can be seen as productivity increase, environmental conformity reduced costs, production reduced costs, reduction of scrap costs, product quality improvement, better capacity use, higher reliability and higher safety for the employers. These factors are part of the total benefits of a project of energetic efficiency (PYE & MACKANE, 2000). To make the energetic efficiency more convincing beyond the pollution prevention, it is also necessary to understand the inter-relations of the measurement of costs and benefits so that the financial ramifications are understood and can be communicated to the employees of different hierarchy levels, as the better the energy management is the bigger the chances of a positive decision about the investment on energetic efficiency (CAGNO & TRIANNI, 2014; COOREMANS & SCHÖNENBERGER, 2019).
In the literature, many researches show what drivers are essential for the implementation of energetic efficiency measures besides the barriers that have to be overcome, but few researches dealt with the identification, characterization and investigation of the performance of economic, environmental and industrial production on the energy management. On papers that analyze the cross-cutting technologies, Cagno et al. (2010) develops a quick methodology to check points in the manufacturing industries que can improve the energetic efficiency. Nehler (2018) provides a broad view about the compressed air measures including a systems perspective within an energy use process. Lung et al. (2005) in his study of optimization of industrial motors shows that the energy economy of projects for the energetic improvement from motors are positive for the energy improvement as of a period of 5 years. Dubois & Blomsterberg (2011) discuss strategies for the improvement of electric lighting such as: better lamps, coverage technology and reduction of the total time of the lighting times, as strategies based on the daylight collection. Finally, Dunkelberg et al. (2018) analyses that the final energy demand in the plastic industries can be reduced by 34% through the flow of different thermal energy sources with a system HVAC adequate for the industrial conditions of this sector.
517 R. gest. sust. ambient., Florianópolis, v. 9, n. esp , p. 513-531, fev. 2020
In papers that check how the productivity indicators act on the cross-cutting technologies, there is the contribution of Alhourani & Saxena (2009) that develops a logistic model for industries in the USA as a possibility to estimate the implementation of a recommendation, showing that return periods, kind of improvement recommendation and the number of worked hours per year are the most relevant factors that affect the implementation of the recommendation, however, papers that check the performance or not of environmental, economic, and industrial production indicators on the energy management, based on the cross-cutting technologies have not been analyzed yet.
Therefore, according to what has been mentioned before, this paper intends to present, by the means of a logistic regression model what economic, environmental and industrial production factors affect the energetic management, by cross-cutting technologies.
This article is organized besides the Introduction, in the Research Methods studies, Results and Discussions and Conclusion.
2 MATERIAL AND METHODS
The research method used in this paper is the statistic modeling based on a logistic regression model. This approach was chosen in order to explain the amount of saved energy in the industries, according to economic, environmental and industrial production phenomena on the quantity of energy consumed in an industry.
2.1 Research framework
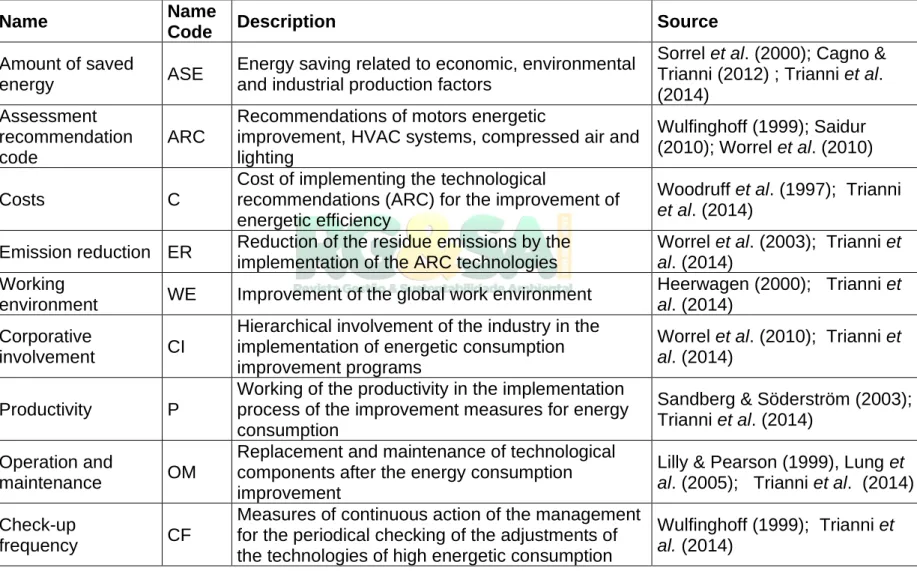
The implementation of the research occurred in the following steps: the collection was carried out through the article of Trianni et al. (2014) taking into consideration the economic, environmental and industrial production indicators as independent variables and the amount of saved energy as a dependent variable. These indicators can be found on Table 1. The amount of saved energy is composed by the proposals of energy consumption improvement proposals of the technologies proposed by the center of industrial evaluation (motors, lighting systems, HVAC and compressed air). It is noteworthy that Trianni et al. (2014) made the survey of these indicators through a broad and systematic literature review.
518 R. gest. sust. ambient., Florianópolis, v. 9, n. esp , p. 513-531, fev. 2020
In the other, with the surveyed indicators and it was made the adjustment of the logistic regression model relating the amount of saved energy to the economic, environmental and industrial production indicators. After getting the results the final analysis has been carried out and the final version of the paper was developed.
2.2. Modeling
The influence of the economic, environmental and industrial production factors has been analyzed on the amount of industrial saved energy. For this purpose, a logistic regression model has been adjusted.
According to Draper & Smith (1998), a logistic regression model is a statistic technique in which the probability of a dichotomy result (as adoption and non-adoption) is related to a set of explanatory variables that are hypothesized to influence the result, as represented by the equation 1:
ln Pi
1− Pi= β0 + β1X1i + β2X2i+…+βkXki, (1)
where the subscript i denotes the ith observation in the sample, P the probability of the result, β0 is the intersection term, β1, β2,….βk are the coefficients
Table 1 : Indicators adjusted to the logistic regression model
Name Name
Code Description Source
Amount of saved
energy ASE
Energy saving related to economic, environmental and industrial production factors
Sorrel et al. (2000); Cagno & Trianni (2012) ; Trianni et al. (2014)
Assessment recommendation code
ARC
Recommendations of motors energetic
improvement, HVAC systems, compressed air and lighting
Wulfinghoff (1999); Saidur (2010); Worrel et al. (2010)
Costs C
Cost of implementing the technological
recommendations (ARC) for the improvement of energetic efficiency
Woodruff et al. (1997); Trianni et al. (2014)
Emission reduction ER Reduction of the residue emissions by the implementation of the ARC technologies
Worrel et al. (2003); Trianni et al. (2014)
Working
environment WE Improvement of the global work environment
Heerwagen (2000); Trianni et al. (2014)
Corporative
involvement CI
Hierarchical involvement of the industry in the implementation of energetic consumption improvement programs
Worrel et al. (2010); Trianni et al. (2014)
Productivity P
Working of the productivity in the implementation process of the improvement measures for energy consumption
Sandberg & Söderström (2003); Trianni et al. (2014)
Operation and
maintenance OM
Replacement and maintenance of technological components after the energy consumption improvement
Lilly & Pearson (1999), Lung et al. (2005); Trianni et al. (2014) Check-up
frequency CF
Measures of continuous action of the management for the periodical checking of the adjustments of the technologies of high energetic consumption
Wulfinghoff (1999); Trianni et al. (2014)
520 R. gest. sust. ambient., Florianópolis, v. 9, n. esp , p. 513-531, fev. 2020
Notice that the estimate coefficients do not indicate directly the effect of the change corresponding to the probability (P) of the occurred result. On the contrary, the results reflect the result of the explanatory variables, individuals, in
the log of odds {ln 1− PiPi }. The positive coefficient means that the log of the probabilities increases as the independent increases too. However, it is possible to interpret the coefficients in terms of probability [1− PP ] or probability (P) of the result, observing the relation between P,
P 1− P and ln Pi 1− Pi . It can be shown that P
1− P is a function monotonically crescent of P
1− P. Consequently, if the log of odds {ln 1− PiPi } is positively or negatively related to an independent variable, both odds 1− PP in relation to the probability P of the result that will be positive or negatively related to this variable. The only difference is that this relation is linear for the log of odds and non-linear for odds and the probability of the results. The logistic regression coefficients are estimated by the estimate method of maximum likelihood.
To evaluate the significance of the logistic regression, model the F test has been adjusted, and the statistic of the estimated coefficients by the standard error will be equal or different from zero.
In the construction of the logistic regression models it is necessary to select the independent variables that will be part of the model. In general, the problem is to select correctly a set of independent variables that include the variables considered important by the researcher (Mann, 2006, Hair-Junior et al., 2010). In addition, the indicators that had a significant effect on the level of significance of 5% (Draper & Smith, 1998) have been selected to compose the final model.
After getting the model that best adjusts to the data, it is necessary to fulfill the premises associated to a linear regression model, so as to consider the developed model valid (DRAPER & SMITH, 1998).
521 R. gest. sust. ambient., Florianópolis, v. 9, n. esp , p. 513-531, fev. 2020
2.3 Analysis of the logistic regression model adjusted
At first three criteria have been used to validate the models:
1. The Anova test accepting significant models with a p<0.05
2. The lowest value of Akaike information criteria (AIC) found for the different studied models
3. The largest coefficient of estimation of Pseudo-R2 of Macfadden
According to Macfadden (1977) the ρ2 (Pseudo-R2) tends to have low values, with the inter value of 0.2 to 0.4 considered excellent, so the ρ2 can be interpreted as R2, but not indicating large values.
All the statistical analysis have been carried out using the computational environment R, version 3.5.3 (R Code Team, 2019).
3. RESULTS AND DISCUSSION
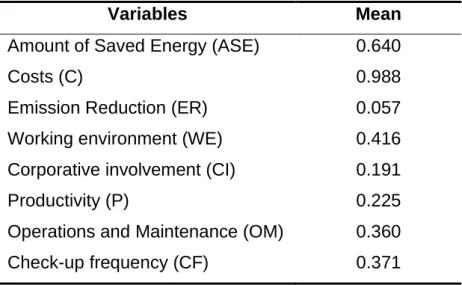
A descriptive analysis of the indicators studied in the Table 2 shows how their behaviors are in energy management in industries. Costs and waste emissions that differ most from the average for a binary data set (0.5). Thus, it is found that costs are as important as approaching 1 (98.8%), as waste emissions are less important than approaching zero (5.7%).
Table 2: Description analysis of the indicators studied
Variables Mean
Amount of Saved Energy (ASE) 0.640
Costs (C) 0.988
Emission Reduction (ER) 0.057 Working environment (WE) 0.416 Corporative involvement (CI) 0.191
Productivity (P) 0.225
Operations and Maintenance (OM) 0.360 Check-up frequency (CF) 0.371 Source: From the author
522 R. gest. sust. ambient., Florianópolis, v. 9, n. esp , p. 513-531, fev. 2020
After the selection of the indicators, the best logistic regression model has been adjusted and is presented in Table 3. For the adjustment of the model the analysis method and validation of the models presented in the section 2.2 and 2.3 have been followed. So, it was possible to identify what variables influence the relation with the quantity of saved energy by the estimate coefficients of the factors or the corresponding standard errors SE(β) and the p-value.
Table 3– Adjusted Logistic Regression Model
Variables β SE(β) p-value
Interceptor -0.2989 0.2997 0.3186 WE 1.4712 0.5916 0.0129 OM 1.3622 0.6398 0.0332 Source: From the author
Table 4 presents the results of the validation tests for the logistic regression model, as of the selection of variables, such as AIC, the accuracy of the model, the significance of the model through the Waltest, and the Pseudo-R2 of Macfadden.
Table 4 – Validation tests of the logistic regression model AIC Pseudo-R2 Wald Accuracy 102.3 0.17 0.00124 0.67
Source: From the author
As described in the section 2.3, the pseudo-R2 of Mcfadden can be considered a strong R2 for its data characteristics adjusted.
The indicators that have not been selected and adjusted are found in Table 1. These indicators have been rejected in the test of p-value.
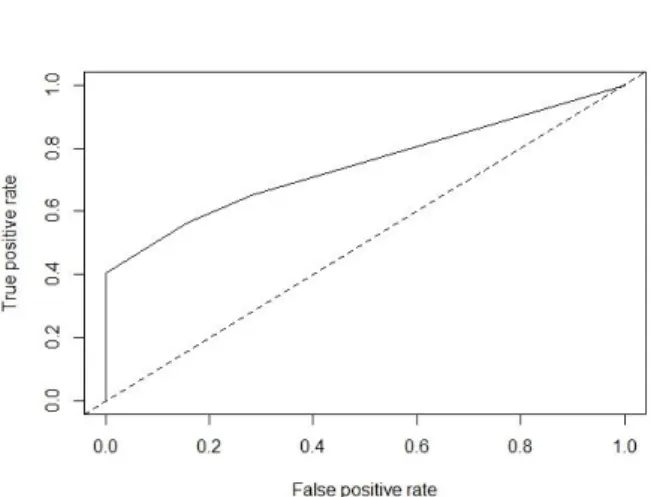
Finally, as a last step of the data analysis the ROC curve shows the performance of the binary classifier amount of saved energy, showing that the model has forecast capacity of approximately 74%.
523 R. gest. sust. ambient., Florianópolis, v. 9, n. esp , p. 513-531, fev. 2020
Figure 1 – ROC Curve
Source: From the author
4. Discussion of the adjusted logistic regression model
This section develops the discussion and analysis of the logistic regression model. It also includes, an analysis about similarities and differences of the indicators regarding the energy management.
Therefore, the most adequate logistic regression model to check the influence of the economic, environmental and industrial production factors with the amount of saved energy is presented in Table 3.
According to the logistic regression model of the Equation 1, it can be noticed that it is influenced by two different explanatory variables: working environment (WE) and operation and maintenance (OM). Taking into consideration the dummy variable WE fixed when increasing the OM in a unit, the amount of saved energy shall increase the log odds by 1.36. Taking into consideration the variable dummy OM fixed when increasing the unit to ASE shall increase the log odds by 1.47.
The economic and environmental indicators do not affect the amount of saved energy. According to Worrel at al. (2003) there is a trend of the measures of energetic efficiency in the industries of reducing dust and gas emissions that increase the greenhouse effect, as a measure of environmental control.
524 R. gest. sust. ambient., Florianópolis, v. 9, n. esp , p. 513-531, fev. 2020
However, by the analysis of the framework of Trianni et al. (2014) few recommendations of improvement have precise acting on the amount of saved energy (ASE). For the economic indicator implementation costs, Woodruff et al. (1997) stated that the first financial expenses in the implementation of improvement measures of the energetic efficiency can be even more important than the return rates of the amount of saved energy. Therefore, although there are significant costs in the implementation, its financial return rate becomes substantial to reach the amount of saved energy (Table 2).
By analyzing the industrial production indicators, we can see the importance of a workplace with impact on the satisfaction of the employees. Adequate working conditions and clarifications of the functionality of the implementation of an energy management program of the cross-cutting technologies increase the potential of the energetic efficiency (Raziq & Maulabakhsgh, 2015). The framework demonstrates that the motor and lighting systems are the main technologies that have support to develop an adequate workplace. The large quantity of these technologies in manufacturing industries and in different functional units compel the employees to deal with some environments in which the quality become primordial so that the productive routine and the energy management are not stressing and spoil all the productive system. (Lu, 2016; Schulze et al, 2016; Boyd, 2017).
In relation to the operation and maintenance of the motors, HVAC, compressed air and lighting systems leads to lower expenses and can reach significant ASE. When compared to the costs of integral change of the cross-cutting technologies to OM there is a larger acceptance by the managers. In addition, the employees may accept the operation and maintenance more easily to get to the energetic efficiency of some technologies as the HVAC and lighting systems, once they are related to the comfort of the workplace (Trianni et al., 2014; Cosgrove et al., 2017).
These results about the influence of the production on ASE differ from the pointed ones by Alhourani & Saxena (2009). This can be explained by the factor that the authors analyzed primary data, containing qualitative and quantitative indicators from USA industries. These authors stated that the return period, working hours and kinds of recommendation are the more influential
525 R. gest. sust. ambient., Florianópolis, v. 9, n. esp , p. 513-531, fev. 2020
indicators in the decrease of the quantity of energy consumed, indicating that the companies invest in recommendations that have a lower return time.
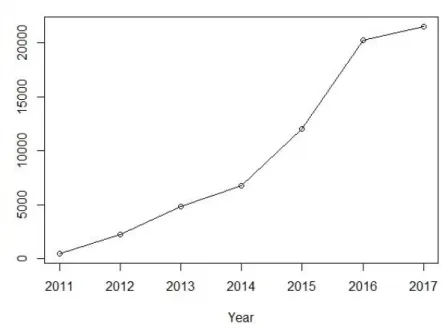
The achieved results from Table 3 indicate that, in order to occur the decrease of the amount of saved energy, first it must occur a structural change of the functionality of the industrial system. This change can be achieved by implementing management systems that achieve energy efficiency in industry, mainly in energy-intensive manufacturing industries. Among the most widespread energy efficiency improvement management systems is ISO 50001, because they follow the same implementation system of ISO 9001: the PDCA (Plan, Do, Check and Action).
Figure 2 presents the increasing number of ISO 50001 emissions, indicating a large and growing adoption of global energy improvements. Table 4 presents the main industrial sectors that issued the ISO 50001 standard. It is noteworthy that energy-intensive manufacturing was the main sector to issue ISO 50001 in 2017, which corroborates with the findings of a necessary implementation of management systems to achieve energy efficiency (ISO, 2019).
Figure 2: Number of ISO 50001 certifications issued in the world
526 R. gest. sust. ambient., Florianópolis, v. 9, n. esp , p. 513-531, fev. 2020
Table 4 – Industrial Sectors with the highest number of ISO 50001 Certifications in 2017.
Sectors ISO 50001 certifications Basic metal & fabricated metal products 1302
Food products, beverages and tobacco 923 Chemicals, chemical products and fibres 888 Rubber and plastic products 826 Wholesale & retail trade; repairs of motor vehicles,
motorcycles and personal and household goods 497 Source: Adapted from ISO survey
5. Conclusions
The results showed the characteristics of the amount of saved energy in industries, through a logistic regression model that checks the impact of economic, environmental, and industrial production indicators.
During the adjustment phase of the indicators in the logistic regression model some indicators have been excluded by the test p-value, such as implementation costs, emission reduction, corporate involvement, productivity, kinds of recommendation technologies and check-up frequency.
For the adjusted logistic regression model the indicators working environment and operation and maintenance influenced the amount of saved energy. The adjustment of these two indicators showed that the structural change of the functionality of the industry plays a ruling role in the decrease of the energetic consumption, guided by the managers and employees of the companies.
The practical implications of this paper are to cooperate with the academy through new concepts and guidelines about the amount of saved energy in a general aspect. For the industrial sector the indicators can be guidelines for the efficiency of the adoption of measures for the reduction of the amount of saved energy. For the technical committees this paper becomes relevant to supply information that allows them to improve the strategies of market as well as contribute to the orientation of the consultants of the
527 R. gest. sust. ambient., Florianópolis, v. 9, n. esp , p. 513-531, fev. 2020
corporations. Finally, for the governmental sector it can be as a parameter to analyze the indicators that did not influence the amount of saved energy.
Future works may check the influence of environmental, economic and industrial production indicators for each cross-cutting technology separately. Also, future research may use mixed multiple logistic regression models providing qualitative evaluations of the indicators associated to the influence on the quantity of saved energy.
Acknowledgements
This is study was financed in part by the Coordenação de Aperfeiçoamento de Pessoal de Nível Superior- Brasil (CAPES)- Finance Code 001
528 R. gest. sust. ambient., Florianópolis, v. 9, n. esp , p. 513-531, fev. 2020
REFERENCES
ALHOURANI, F., SAXENA, U. Factors affecting the implementation rates of energy and productivity recommendations in small and medium sized companies. Journal of Manufacturing Systems, v. 28, n.1, p.41-45,2009. ANDERSON, T. A., NEWELL, R.G. Information programs for technology adoption: the case of energy-efficiency audits. Resource and Energy
Economics, v. 26, n.1, p.27-50, 2004
BOYD, G. A. Comparing the statistical distributions of energy efficiency in manufacturing: meta-analysis of 24 Case studies to develop industry-specific energy performance indicators (EPI). Energy Efficiency, v. 10, n.1, p. 217-238, 2017
BP, Estatistical Review Energy. Available at
<https://www.bp.com/content/dam/bp/business- sites/en/global/corporate/pdfs/energy-economics/statistical-review/bp-stats-review-2019-full-report.pdf>, (Acessed: 02 july 2019).
BUNSE, K., VODICKA, M., SCHÖNSLENBEN, P., BRÜLHART, M., ERNST,
F.O. Integrating energy efficiency performance in production management –
gap analysis between industrial needs and scientific literature. Journal of
Cleaner Production, v. 19, n.6-7, p.667-679, 2011.
CAGNO, E., TRIANNI, A. Analysis of the most effective energy efficiency opportunities in manufacturing primary metals, plastics, and textiles small- and medium-sized enterprises. Journal of Energy Resources Technology, v.134, n.2, p.1-9. 2012;
CAGNO, E., TRIANNI, A. Evaluating the barriers to specific industrial energy efficiency measures: an exploratory study in small and medium-sized enterprises. Journal of cleaner production, v.82, n.1, p.70-83, 2014.
CAGNO, E., TRUCCO, P., TRIANNI, A., SALA, G. Quick-E-scan: A methodology for the energy scan of SMEs. Energy, v. 35, n.5, p. 1916-1926, 2010.
COOREMANS, C., SCHÖNENBERGER, A. (2019) ‘Energy management: A key driver of energy-efficiency investment?’, Journal of Cleaner Production, 230 (1), p.264-275.
COSGROVE, J., DOYLE, F.,LITTLEWOOD, J.,WILGEROTH, P. A methodology for electricity monitoring and targeting (M&T) in an Irish precision engineering SME. International Journal of Sustainable Engineering, v. 10, n.4-5, p.233-240, 2017.
529 R. gest. sust. ambient., Florianópolis, v. 9, n. esp , p. 513-531, fev. 2020
DRAPER, N.R., SMITH, H. Applied Regression Analysis, 3ª ed, Jon Wiley & Sons, Honoken, NJ., 1998.
DUBOIS, M.-C., BLOMSTERBERG, Å. Energy saving potential and strategies for electric lighting in future North European, low energy office buildings: A literature review. Energy and Buildings, v.43, n.10, p.2572-2582, 2011.
DUNKELBERG, H., WAGNER, J., HANNEN, C., SCHLÜTER, A., PHAN, L., HESELBACH, J., LIN, C.-H. Optimization of the energy supply in the plastics industry to reduce the primary energy demand. Journal of Cleaner Production, v.192, n.10, p.790-800, 2018.
HAIR-JÚNIOR-, J.F. BLACK, W.C, BABIN, B.J., ANDERSON, R.E. Multivariate Data Analysis. 7 ª ed, Prentice Hall, 2010.
HEERWAGEN, J. Green buildings, organizational sucess and occupant productivity. Building Research & Information, v.28, n. 5-6, p.353-367, 2000.
IEA, International Energy Agency. Available at
<https://www.iea.org/tcep/industry/ >, (Acessed : 18 june 2019)
IEA, International Energy Agency. Energy-Efficiency Policy Opportunities for
Electric Motor-Driven Systems. Working paper OECD/IEA, Paris, 2011.
IEA, International Energy Agency. Light's Labour's Lost: Policies for
Energy-Efficient Lighting. OECD/IEA,Paris, 2006.
ISO, International Organizational for Standardization. Available at https://isotc.iso.org/livelink/livelink?func=ll&objId=18808772&objAction=browse &viewType=1 (Acessed: 18 july 2019)
LILLY, P. PEARSON, D. Determining the full value of industrial efficiency
programs. Proceedings from the 1999 ACEEE summer study on energy efficiency in industry, p. 349–62, 1999.
LU, S-M. A review of high-efficiency motors:Specification, policy, and technology. Renewable and Sustainable Energy Reviews, v. 59, p-1-12, 2016.
LUNG, R.B., MCKANE, A., OLSZEWSKI, M. Industrial Motor System Optimization Projects in the US: An Impact Study. Energy Engineering, v.102, n.1, p.61-79, 2005.
MANN, P.S. Introdução à Estatística, 5ªed. LTC, Rio de Janeiro, 2006.
McFADDEN. D. Quantitative methods for analysis travel behaviour of individuals: some a recent developments. 1ªed, p. 474, Cowles Foundation Discussion Papers, 1977.
530 R. gest. sust. ambient., Florianópolis, v. 9, n. esp , p. 513-531, fev. 2020
NEHLER, T. Linking energy efficiency measures in industrial compressed air
systems with non-energy benefits – A review. Renewable and Sustainable
Energy Reviews, v.89, p.72-87, 2018.
NORMAN, J. B. Measuring improvements in industrial energy efficiency: A decomposition analysis applied to the UK. Energy, v.137, p.1144-1151, 2017;
PYE, M., McKANE, A. Making a stronger case for industrial energy efficiency by quantifying non-energy benefits. Resources, Conservation and Recycling, v.28, n.3-4, p. 171-183, 2000.
R Core Team R: a Language and Environment for Statistical Computing R Foundation for Statistical Computing,Vienna, Austria (2019) http://www.R-project.org/.
RAZIQ, A., MAULABAKHSGH, R. Impact of Working Environment on Job Satisfaction. Procedia Economics and Finance, v.23, p.717-725, 2015.
SAIDUR, R. A review on electrical motors energy use and energy savings.
Renewable and Sustainable Energy Reviews, v.14, n.3, p. 877-898, 2010.
SANDBERG, P. SÖDERSTRÖM, M. Industrial energy efficiency: the need for investment decision support from a manager perspective. Energy Policy, v.31, n.15, p.1623-1634, 2003.
SCHULZE, M., NEHLER, H., OTTOSSON, M., THOLLANDER, P. Energy management in industry e a systematic review of previous findings and an integrative conceptual framework. Journal of Cleaner Production, v.112, n.5, p. 3692-3708, 2016.
SHIPLEY, A.M., ELLIOTT, R.N. Ripe for the picking: have we exhausted the
lowhanging fruit in the industrial sector? Washington, DC, US; p.28, 2006.
SORREL, S. MALLEY, E.O., SCHLEICH, J., SCOTT, S. The economics of
energy efficiency. Cheltenham, UK.: Edward Elgar Publishing, p.349, 2004.
SORRELL, S., SCHLEICH, J., SCOTT, S., O’ MALLEY, E. Reducing barriers
to energy efficiency in public and private organizations, p. 232, 2000.
TANAKA, K. Review of policies and measures for energy efficiency in industry sector. Energy Policy, v.39, n.10, p.6532-6550, 2011.
TRIANNI, A., CAGNO, E., DE DONATIS, A. A framework to characterize energy efficiency measures. Applied Energy, v.118, n.1, p. 207-220, 2014.
531 R. gest. sust. ambient., Florianópolis, v. 9, n. esp , p. 513-531, fev. 2020
TRIANNI, A., CAGNO, E., WORRELL, E., PUGLIESE, G. Empirical investigation of energy efficiency barriers in Italian manufacturing SMEs.
Energy, v.49, n.1, p.444-458, 2013a
TRIANNI, A., CAGNO, E., THOLLANDER, P., BACKLUND, S. Barriers to industrial energy efficiency in foundries: a European comparison. Journal of
Cleaner Production, v.40, p.191-176, 2013b
WOODRUFF, M.G., DOWD, J., THEODORE,W.J., SEELY, H.E. Evidence from the industrial assessment program on energy investment decisions by small
and mediumsized manufacturers. Energy Conversion Engineering
Conference. In: Proceedings of the 32nd Intersociety, Honolulu, HI, US; p.
2138–42, 1997.
WORRELL, E., ANGELINI, T., MASANET, E. Managing Your Energy An
ENERGY STAR. Guide for Identifying Energy Savings in Manufacturing Plants;
2010.
WORRELL, E., LAITNER, J.A., RUTH, M., FINMAn, H. Productivity benefits of
industrial energy efficiency measures. Energy, v. 28, n.11, p.1081-1098, 2003.
WULFINGHOFF, D. Energy efficiency manual: for everyone who uses
energy, pays for utilities, controls energy usage, designs and builds, is interested in energy and environmental preservation. Energy Institute