Sofia Filipe Pereira
Bachelor of Science in Chemical and Biochemical Engineering
Modelling of a wastewater treatment
plant using GPS-X
Dissertation to obtain the degree of Master in Chemical and Biochemical Engineering
Supervisor: Eng. Henrique Figueira, Portucel Soporcel
Co-supervisors: Dr. Adrian Oehmen, FCT-UNL
Prof. Maria Ascensão Reis, FCT-UNL
Jury:
Chairman: Prof. Isabel Coelhoso, FCT - UNL Examiner: Dr. António Martins, Águas do Algarve Member: Eng. Henrique Figueira, Portucel Soporcel
Sofia Filipe Pereira
Bachelor of Science in Chemical and Biochemical Engineering
Modelling of a wastewater treatment plant
using GPS-X
Dissertation to obtain the degree of Master in Chemical and Biochemical Engineering
Supervisor: Eng. Henrique Figueira, Portucel Soporcel
Co-supervisors: Dr. Adrian Oehmen, FCT-UNL
Prof. Maria Ascensão Reis, FCT-UNL
UNIVERSIDADE NOVA DE LISBOA Faculdade de Ciências e Tecnologia
Departamento de Química
Modelling of a wastewater treatment plant using GPS-X
Copyright © Sofia Filipe Pereira, Faculdade de Ciências e Tecnologia, Universidade Nova de Lisboa.
A Faculdade de Ciências e Tecnologia e a Universidade Nova de Lisboa têm o direito, perpétuo e sem limites geográficos, de arquivar e publicar esta dissertação através de exemplares impressos reproduzidos em papel ou de forma digital, ou por qualquer meio conhecido ou que venha a ser inventado, e de a divulgar através de repositórios científicos e de admitir a sua cópia e distribuição com objectivos educacionais ou de investigação, não comerciais, desde que seja dado crédito ao autor e editor.
I
ACKNOWLEDGMENTS
The elaboration of this thesis would not have been possible without the collaboration of several people to whom I am deeply grateful:
First, I would like to express my sincere gratitude to Eng. Henrique Figueira, not only for giving me the amazing opportunity of doing my master thesis in Portucel but also for his guidance, interest and share of knowledge.
To my supervisors at FCT-UNL, Prof. Maria Ascensão Reis and Prof. Adrian Oehmen, I would like to thank for the tireless support and advices.
I am also thankful to Eng. Clara Candeias, Eng. Isabel Gonçalves and all the laboratory and wastewater treatment staff for the precious help they gave me during my stay at Portucel.
To my colleagues at Portucel, I want to express my gratitude for their friendship and for the great moments that we shared.
To my parents and sister, a very special thanks for making this amazing journey possible and also for their tireless support in every moment of my life.
I would also like to express my gratitude to my friends and course colleagues for the wonderful five years that I spent at FCT. Furthermore, I would like to thank Alexandra Loupas, Frederico Oliveira, Raquel Gonçalves and Ricardo Lourenço for their encouragement and patience during this last semester.
III
RESUMO
O trabalho presente nesta dissertação foi realizado na empresa Portucel Soporcel, no pólo industrial de Setúbal, e teve como principal objectivo a modelação do processo de tratamento dos efluentes desta indústria, utilizando para o efeito o software GPS-X. Este programa contém uma interface gráfica muito clara e utiliza um tradutor especializado que converte o processo gráfico em equações de balanço mássico, baseadas em modelos dinâmicos. Estes modelos permitem, além da descrição da cinética do processo de tratamento presente na ETAR, simular novos cenários visando o estudo dos parâmetros críticos no processo bem como a optimização e controlo do mesmo.
O efluente que aflui à ETAR da Portucel, proveniente das fábricas de pasta e papel do complexo, é particularmente rico em fibras (sólidos), lenhina, compostos clorados e sulfurados, resinas ácidas, fenóis e amido. Apresenta uma coloração acastanhada, devido à presença de lenhina e tem uma carência química de oxigénio elevada (cerca de 1,095 g O2/m3). A ETAR em
estudo utiliza o processo de lamas activadas com arejamento prolongado. Este método permite uma eficiente remoção da carga orgânica ao mesmo tempo que minimiza a produção de lamas.
Para a modelação do processo foi necessária a recolha de dados históricos relativos ao desempenho da ETAR nos últimos 3 anos. Estes dados foram usados como valores de input na caracterização do influente e como valores de output a atingir na caracterização do efluente tratado. Uma vez que a primeira simulação não conduziu aos resultados de output pretendidos, foi necessário proceder à calibração do modelo, através de um estudo mais aprofundado sobre as fracções orgânicas e nutricionais que compõem o influente.
Depois de calibrado o modelo, procedeu-se ao estudo do caudal de ureia. A ureia é adicionada ao influente, antes do início da oxidação biológica, como forma de satisfazer as necessidades de azoto ao longo do processo de tratamento. No entanto, este caudal nunca foi submetido a um estudo que avaliasse, em maior detalhe, as necessidades efectivas deste nutriente. Sendo assim, foram feitas simulações no programa, diminuindo sucessivamente o valor do caudal de ureia e avaliaram-se os resultados obtidos. Por outro lado, procedeu-se também à validação das simulações na própria ETAR da Portucel, reduzindo-se o caudal de ureia adicionado para metade do valor habitual. As simulações e os resultados da Portucel mostraram que, de facto, a adição de ureia não é necessária uma vez que não afecta de forma significativa o processo de tratamento, nomeadamente em termos de remoção de carência química de oxigénio. As simulações mostraram também que a concentração de azoto no efluente final diminui significativamente com a redução do caudal de ureia, o que pode trazer vantagens sob o ponto de vista ambiental.
Palavras – chave: efluentes de pasta e papel, processo de lamas activadas, modelação,
V
ABSTRACT
The work present in this thesis was conducted in Portucel Soporcel mill, in the industrial complex of Setúbal, and had as main objective the modelling of the treatment process of the effluents from this industry, using for this purpose the software GPS-X. This program has a clear-cut graphical interface and uses a specialized translator that converts the graphical process into material balance equations, based on dynamic models. These models allow, besides the kinetic descripton of the treatment process carried out at the WWTP, to simulate new scenarios towards the study of critical parameters for the process as well as optimization and control of the WWTP.
The effluent that arrives to Portucel’s WWTP, from the pulp and paper mills of the complex,
is particularly rich on fibers (solids), lignin, chlorinated and sulphur compounds, resin acids, phenols and starch. It has a brown colour due to the presence of lignin and has a high oxygen chemical demand (about 1,095 g O2/m3). The WWTP uses the activated sludge process with
extended aeration. This method allows an efficient removal of organics at the same time as it minimizes the sludge production.
For the modelling of the process it was necessary to collect historical data related to the
WWTP’s performance over the last 3 years. This data was used as input values for the influent characterisation and as output values to achieve the treated effluent characterisation. Since the first simulation did not lead to the desired output results, it was necessary to proceed to the model calibration, by means of a more detailed study concerning the nutrient and organic fractions of the influent.
Once the model was calibrated, a study of the urea flowrate was conducted. The urea is added to the influent, before the beginning of the biological oxidation, as a way to satisfy the nitrogen requirements along the treatment process. However, this flowrate was never submitted to a study that evaluated, in a higher detail, the effective requirements of this nutrient. Thus, some simulations were done using the software, by decreasing successively the value of the urea flowrate and the results obtained were analyzed. Furthermore, these simulations were validated in the WWTP itself, at Portucel, through the decrease of the urea flowrate to half the
normal value. Both the simulations and Portucel’s results showed that, actually, the addition of urea is not necessary because it does not affect the treatment process in a significant way, namely in terms of the removal of chemical oxygen demand. The simulations have also showed that the concentration of nitrogen in the final effluent diminishes significantly with the reduction of the urea flowrate, which could be advantageous in an environmental point of view.
VII
LIST OF CONTENTS
Acknowledgments ... I Resumo ... III Abstract ... V List of contents ... VII List of figures ... IX List of tables ... XI Abbreviations and symbols ... XIII
Part I ... 1
Chapter 1. Introduction ... 3
1.1 General context... 3
1.2 Motivation ... 4
1.3 Outline of work ... 4
Chapter 2. General concepts ... 5
2.1 Pulp and paper industry ... 5
2.2 Pulp and paper effluents ... 8
2.3 Activated sludge process ... 11
Chapter 3. WWTP modelling ... 19
3.1 Introduction ... 19
3.2 Modelling: state of the art ... 20
3.3 ASM2d - Characterisation ... 23
Part II ... 31
Chapter 4. Methodology ... 33
4.1 Portucel’s WWTP – description ... 34
4.2 Portucel’s WWTP – collection of historical data ... 37
4.3 Building the WWTP in GPS-X ... 43
4.4 Influent characterisation and model calibration ... 48
Chapter 5. Case study: urea... 67
Chapter 6. Conclusions and future developments ... 69
References ... 71
Appendix... 75
Appendix I – ASM2d rate equations ... 75
Appendix II – Composite Variables ... 81
Appendix III – BOD5:N:P ratios ... 83
IX
LIST OF FIGURES
Figure 1 – Portucel pulp and paper mill in Setúbal: (a) outside view of the pulp mill; (b) inside
view of the paper mill ... 7
Figure 2 - Classification of the Chemical Oxygen Demand according to biodegradability... 12
Figure 3 - Bacteria metabolism: (a) aerobic, heterotrophic; (b) aerobic, autotrophic; (c) anaerobic, heterotrophic. ... 13
Figure 4 - Schematic diagram of Activated Sludge Process ... 15
Figure 5 – Steps followed to simulate Portucel's WWTP ... 33
Figure 6 - Total influent distribution. ... 34
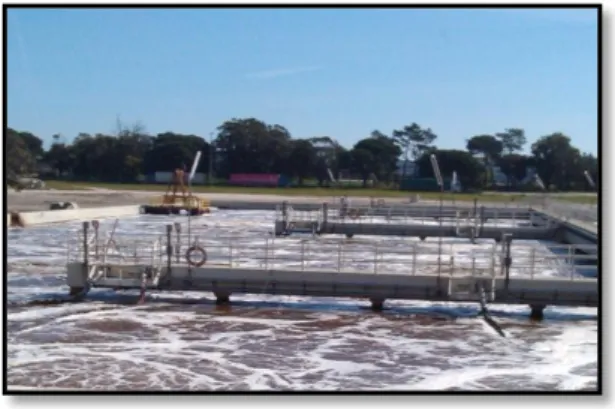
Figure 7 - View of part of the aeration tank at Portucel in Setúbal ... 35
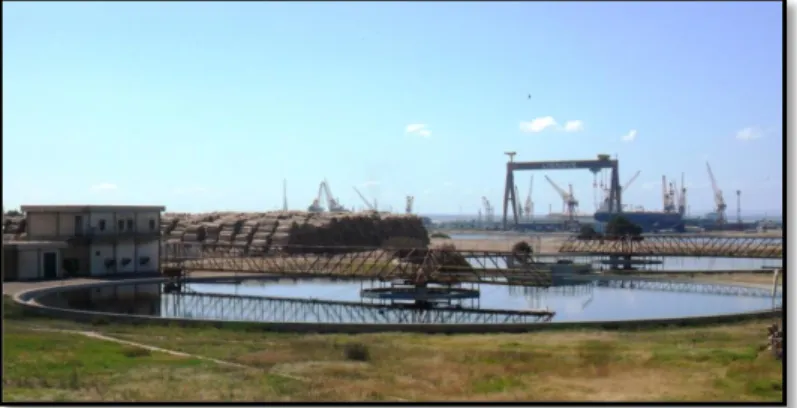
Figure 8 - View of the secondary clarifiers at Portucel in Setúbal ... 36
Figure 9 - View of the thickener at Portucel in Setúbal ... 36
Figure 10 - View of the filter press at Portucel in Setúbal ... 36
Figure 11 - Layout of Portucel's WWTP in GPS-X... 43
Figure 12 - Simple1d model - scheme of the 10 - layer clarification. ... 45
Figure 13 - Evolution of the solids in the aeration tank during the 80 days of simulation ... 61
Figure 14 - Evolution of the nutrients in the aeration tank during the 80 days of simulation. ... 62
Figure 15 - Evolution of soluble and particulate material in the aeration tank during the 80 days of simulation. ... 62
Figure 16 - Evolution of biomass, PHA and metals in the aeration tank during the 80 days of simulation ... 63
Figure 17 - TSS profile along the 10 layers (average values) ... 64
XI
LIST OF TABLES
Table 1- Classification of pulp and paper waste ... 8
Table 2- Discharge of organic substances from kraft pulp mills ... 9
Table 3 - Typical wastewater discharges from paper mills ... 10
Table 4 - Biological processes concerning organic matter. ... 14
Table 5 – Characterisation of the treated effluent from a Kraft pulp mill ... 18
Table 6 – Processes covered by each model... 23
Table 7 - State and composite variables defined in the ASM2d model – Part I ... 28
Table 8 - State variables defined in the ASM2d model – Part II ... 29
Table 9 - Average COD in the influent and effluent over the last 3 years. ... 38
Table 10 - Average BOD5 in the influent and effluent over the last 3 years ... 38
Table 11 - Average TKN in the influent and effluent over the last 3 years ... 39
Table 12 - Average of TP on the influent and effluent over the last 3 years. ... 40
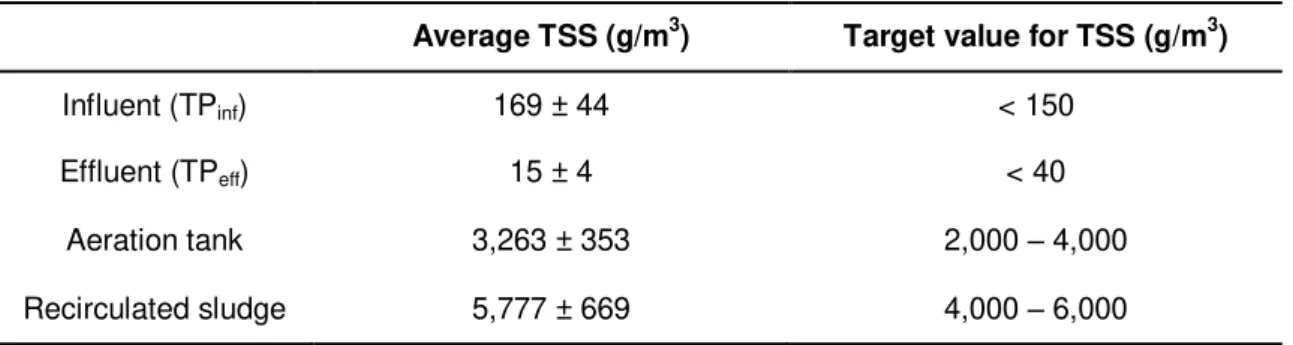
Table 13 - Average TSS in the influent and effluent, aeration tank and recirculated sludge streams, over the last 3 years... 40
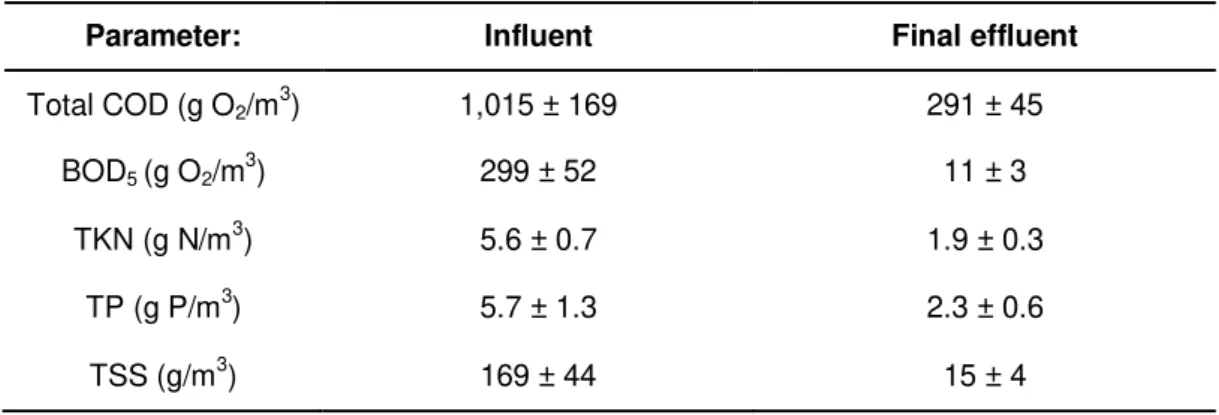
Table 14 - Summary of the main characterisation parameters for the influent and effluent of the WWTP. ... 41
Table 15 - Average dissolved oxygen in the aeration tank over the last 3 years ... 41
Table 16 - Average of SVI over the last 3 years ... 42
Table 17 - Average flowrates over the last 3 years ... 42
Table 18 - Physical and operational data ... 47
Table 19 – Input of influent fractions (urea influent) ... 48
Table 20 – Input of organic fractions (urea influent) ... 49
Table 21 – Phosphorus and nitrogen fractions (wastewater influent) ... 49
Table 22 - Input of influent fractions (wastewater influent) ... 51
Table 23 – Input of metal precipitates fractions (wastewater influent) ... 51
Table 24 - Nutrient fractions (wastewater influent) ... 51
Table 25 - Results of the VFA's quantification in an influent sample, using the method of HPLC. ... 53
Table 26- Target values for the main output streams ... 54
Table 27 - Output concentrations after simulation ... 55
Table 28 - Results of the sensitivity analysis done to frxi, frsf and frxs ... 55
Table 29 - Summary of the estimated organic fractions for the influent characterisation ... 56
Table 30 - Comparison of the concentrations of the main output streams given by the historical data from Portucel and by the simulation using GPS-X ... 57
Table 31 - Summary of COD influent fractions from similar studies ... 57
Table 33 - Results of the N and P content of the main output streams obtained by the simulation
... 58
Table 34 – Modifications in the N and P fractions ... 59
Table 35 - N and P concentrations in the dehydrated sludge and final effluent after the modifications. ... 60
Table 36- Wastewater influent characterisation - main parameters ... 61
Table 37 - Urea influent characterisation - main parameters ... 61
Table 38 - Dissolved oxygen (DO) and alkalinity profile inside the aeration tank (average values) ... 64
Table 39 - Simulation results for the urea flowrate decrease (after a 80 day period) ... 67
Table 40 - Summary of results concerning the urea flowrate experiment at Portucel ... 68
Table 41 – ASM2d rate equations for hydrolysis ... 75
Table 42 – AM2d rate equations for processes concerning heterotrophic organisms ... 76
Table 43 –ASM2d rate equations for processes concerning phosphorus accumulating organisms (PAO) ... 77
Table 44 – ASM2d rate equations for processes concerning nitrifying organisms (autotrophic organisms) ... 78
Table 45 – ASM2d rate equations for simultaneous precipitation of phosphorus with ferric hydroxide ... 78
Table 46 - Definition and typical values for the kinetic parameters of ASM2d ... 79
Table 47 - ASM2d model stoichiometry ... 80
Table 48 - BOD, COD and TSS composite variables for ASM2d ... 81
Table 49 – Nitrogen Composite Variables... 82
Table 50 - Phosphorus composite variables ... 82
Table 51 - Nutrient Ratios registrated in the WWTP’s influent over the last 3 years. ... 83
Table 55 - Simulation Results - streams characterisation on the 80th day of the simulation - Part I ... 84
Table 56 - Simulation Results - streams characterisation on the 80th day of the simulation - Part II ... 84
Table 57 - Simulation Results - streams characterisation on the 80th day of the simulation - Part III ... 85
XIII
ABBREVIATIONS AND SYMBOLS
AOX - Adsorbable Organic Halides ASM – Activated Sludge Model bCOD – Biodegradable COD
BOD – Biochemical Oxygen Demand
BOD5– Biochemical Oxygen Demand in a 5 day incubation period
C5H7NO2– Biomass (chemical formula)
CaCO3– Calcium Carbonate
CO2– Carbon Dioxide
COD – Chemical Oxygen Demand DO – Dissolved Oxygen
F/M – Food to Microorganism ratio H+ - Hydrogen ion
H2O – Water
MLSS – Mixed Liquor Suspended Solids N – Nitrogen
N2– Dinitrogen
NH4+ - Ammonia
NO2- - Nitrite
NO3- - Nitrate
nbCOD – Nonbiodegradable COD O2– Oxygen molecule
P – Phosphorus
PAO – Polyphosphate Accumulating Organisms PHA – Poly-hydroxy-alkanoates
rbCOD – Readily Biodegradable COD sbCOD – Slowly Biodegradable COD SO2- - Sulphur Dioxide
SO3- - Sulphur Trioxide
SRT – Solids Retention Time SVI – Sludge Volume Index TKN – Total Kjeldahl Nitrogen TN – Total Nitrogen
1
Part I
3
CHAPTER 1. INTRODUCTION
1.1
GENERAL CONTEXT
Pulp and paper industry is one of the largest polluting industries. The effluent of a pulp and paper mill contains an abundance of different substances, both organic and inorganic. The particulate material is mainly made up of wood fibres while soluble pollutants become part of the wastewater through different rejected flows from purification and separation processes within the pulp and paper mill. They consist mainly of lignin, carbohydrates, extractives and their degradation products. Different additives and chemicals may also be found as soluble components in the wastewater. The major contribution of additives is starch, which is added to increase the strength of the paper [1].
If these wastewaters are not efficiently treated, the large amounts of organic matter and nutrients present in the effluent will lead to severe impacts on the aquatic ecosystem, such as eutrophication and the release of toxic pollutants (chlorinated compounds, resin acids, phenols). The most frequent way to reduce organic matter in the effluents of pulp and paper mills is by biological oxidation processes such as the activated sludge process. This method depends upon groups of microorganisms, mainly bacteria, along with protozoan, fungi and rotifers, being maintained in contact with the organic matter in the waste in an aerobic environment. This allows the reduction of the organic load with a minimum sludge production [2].
1.2
MOTIVATION
The main aim of this study is the application of one of the state-of-the-art modelling softwares to describe the behaviour of the WWTP of Portucel, a pulp and paper mill located in Setúbal. In particular, this study focuses on the tasks of influent characterisation and model calibration with the purpose of building a model that explains the particularities of this type of effluent in terms of components characterisation and how they behave in the biological treatment. Moreover, it is also an objective of this study to analyse the influence of the urea addition on the treated effluent and sludge production rate.
1.3
OUTLINE OF WORK
Chapter 2 introduces the basic concepts of the pulp and paper industry, addressing the process of pulp and paper making, the origin and composition of the effluents and the usual approach to treat them – the activated sludge process. This process is described in more detail, attending to issues such as biochemical components and biological reactions that occur in a wastewater treatment plant (WWTP) and its physical characterisation and control parameters.
In Chapter 3 the concept of modelling is presented, as well as a state-of-the-art concerning this topic. The model used to describe the behaviour of the WWTP, ASM2d, is explained in terms of components and kinetics of the involved biological processes.
Chapter 4 refers to the modelling of Portucel’s WWTP. The chapter begins with an
explanation of the approach used for modelling, followed by a description of Portucel’s WWTP, as well as the data collection of the main parameters. Then, the step of influent characterisation during model calibration is described. Lastly, a case study is presented (Chapter 5), concerning the effect of the decrease in urea flowrate on the treatment process.
5
CHAPTER 2. GENERAL CONCEPTS
2.1
PULP AND PAPER INDUSTRY
Paper is a product widely used in our society and it can be found in various forms. It is essentially a sheet of cellulose fibres with a number of supplements, added to affect the paper's quality and fitness for intended end use. Historical records report that paper was invented in 150 AD, by the Chinese Emperor Ts'ai Lun, made from a suspension of hemp waste in water, washed, soaked, and beaten to a pulp with a wooden mallet. From China, papermaking moved to Korea and to the west, via the Silk Road. Pulp was initially prepared from the fibers of hemp, mulberry, bamboo, rice straw, and cloth. It was only in 1850 that wood was first used for making pulp. Due to a rag shortage, along with increasing demand for paper, European and American inventors searched for alternative supplies for making pulp. These inventors found mechanical and chemical methods for efficiently making paper from wood. The first species of trees used for paper making were pine and spruce from the coniferous forests of Europe and North America. Then, hardwood species such as eucalyptus, birch, aspen and maple were introduced, mostly motivated by lower costs and better availability [4].
Pulp and paper mills may exist separately or as integrated operations. An integrated paper mill is one that conducts pulp manufacturing on-site. Pulp can be produced by mechanical or chemical methods. In mechanical pulping the wood is pressed against a grinder which destroys the wood matrix separating the fibers from each other. This type of pulping maintains the main part of the lignin, achieving high yield (≈ 95%) with tolerable strength properties and brightness. However, it is associated with a low resistance to aging which results in a tendency to discolour. This method is used for weaker paper materials such as newspapers, paperbacked books and magazines. Chemical pulping removes non cellulose wood components leaving intact the cellulose fibers through the cooking of raw materials with a solution of chemicals under elevated pressure, using the kraft (sulphate), sulphite or soda processes. Chemical pulping yields approximately 50% but offers higher strength properties and the fibers are more easily bleached. This type of pulping is used on most papers produced commercially in the world today [5].
the currently dominating chemical pulping process worldwide because it is related to superior pulp strength, is applicable to all wood species and has an efficient chemical recovery system. However, the chemistry associated with this process has an intrinsic potential trouble of malodorous compounds [6] [7].
In terms of operational steps, kraft pulping begins with wood chipping, debarking and screening. After a pre-impregnation step the wood chips are “cooked” in a digester under high pressure and temperature in the presence of white liquor, a water solution of sodium sulphide and sodium hydroxide. This mixture dissolves most of the lignin and only some of the hemicelluloses, leaving mostly cellulose to hold the fibers together. Subsequent to the digestion the wood pulp is washed and screened in order to remove knots that were not completely broken down in the digester. The spent cooking liquor, containing process chemicals, water and chemicals from the wood, is combined with pulp wash water to form the black liquor. The latter is sent to the chemical recovery process in order to recuperate chemicals and heat. The black liquor is concentrated through evaporation and combusted in a recovery furnace, where heat from the combustion of organics is recovered for process use and for the generation of electrical power. To compensate for chemicals that are lost in the pulp mill cycle, sodium and sulphur chemicals are added to the black liquor before combustion. Traditionally, sodium sulphate was the normal 'make-up' chemical, supplying both sodium and sulphur. However, modern mills only lose small amounts of sulphur and it has become necessary to partially use 'sulphur free' make-up chemicals, in form of sodium carbonate. The inorganic chemicals are recovered as molten smelt. Water and quicklime are used to convert this smelt back to white liquor in a causticising tank. The lime mud that precipitates from the tank is calcined in a lime kiln to regenerate quicklime. [8]
Bleaching of the pulp is carried out in various stages, usually four to five, each stage being conducted in a different tower, with different chemicals. Firstly the pulp is treated with sodium hydroxide (NaOH) in the presence of oxygen (O2) – a delignification step. The NaOH removes
hydrogen ions from the lignin and the O2 breaks down the polymer. Then the pulp is treated in
other stages, called extraction stages. They involved treatment with chlorine dioxide (ClO2), a
mixture of NaOH, O2 and peroxide and finally with ClO2 again to remove the remaining lignin.
The resulting pulp can be dried and stored for external sale or it can be directly pumped to a close paper mill in the case of integrated pulp and paper mills [8].
7 In Portugal, the group Portucel Soporcel is the leader in the pulp and paper industry. It is the main producer of UWF1 paper and BEKP2 pulp in Europe, with a total of 1.6 Mton/year of UWF paper and 1.4 Mton/year of BEKP pulp. In 2013, it was the second largest national exporter with an income of 1.2 billion Euros. The group is the main national producer of energy obtained through biomass cogeneration and achieves a surplus in terms of electrical energy, producing about 2.5 TWh/year. They have strong sociological and cultural values, investing in sustainability and biodiversity conservation. The industrial complexes are located in Cacia, Figueira da Foz and Setúbal. The first mill stands at the heart of Portugal’s largest area of eucalyptus forest and produces about 285 thousand tons/year of pulp designed for special applications; the mill of Figueira da Foz involves the integrated pulp and paper mill with an annual production of 800 thousand tons of UWF paper; the mill of Setúbal comprises a pulp mill and two paper mills. This complex is one of the largest and most advanced in Southern Europe. Its competitive advantages include excellent energy performance and eco-efficiency. The
group’s paper grades include Navigator, Pioneer, Inacopia, Explorer, Discovery, Soporset and many more [10].
Figure 1 – Portucel pulp and paper mill in Setúbal: (a) outside view of the pulp mill; (b) inside view of the paper mill. Source: Portucel Soporcel group [10]
1
UWF - Uncoated Wood Free Printing and Writing Paper 2
2.2
PULP AND PAPER EFFLUENTS
Pulp and paper is the sixth largest polluter industry, preceded by oil, cement, leather, textile and steel industries. In a pulp mill about 50% of the raw materials leave the process as gaseous, solid and liquid waste. According to Muna Ali and T.R. Sreekrishan, pulp and paper waste can be classified into four main categories (Table 1):
Table 1- Classification of pulp and paper waste. Adapted from: Muna Ali and T.R. Sreekrishan [11]
Type of waste: Composition and source:
Gases
Malodorous gases such as hydrogen sulphide and mercaptan;
Oxides of sulphur such as SO2 and SO3
Effluents
Suspended solids including bark particles, fiber pigments and dirt;
Dissolved colloidal organics such as hemicelluloses, sugars, sizing agents;
Chromatophores - mainly lignin compounds;
Chlorinated compounds;
Dissolved inorganics such as NaOH and Na2SO4.
Particulates Fly ash from coal;
Char.
Solids Sludges from primary and secondary treatment and
recovery section;
Solids such as grit, bark and other mill wastes.
Effluents are a major concern in a pulp and paper mill, since this industry consumes a large amount of water - the consumption of water in the processes of cooking and bleaching can reach a total of 200 m3 water/ton pulp produced. The resulting wastewater carries with it a
considerable amount of pollutants such as chlorinated compounds (as adsorbable organic halides – AOX), suspended solids, lignin, sulphur compounds, etc. While some of these pollutants are naturally occurring wood extractives (tannins, resin acids, stilbenes, lignin), others are xenobiotic compounds that are formed during the process of pulping and paper making (chlorinated lignin, resin acids and phenols). Chlorinated organic compounds may include dioxins and furans that are recalcitrant to degradation and tend to persist in nature [12].
9 organic matter and the COD parameter encompasses the majority of organic compounds and oxidizable minerals such as sulphides and sulphites, which are susceptible of being oxidized by potassium dichromate in an acidified medium.
Also, the effluents that result from the pulp making process are characterized by the presence of an intense colour, which comes from the lignin. The colour causes not only a serious aesthetic problem, but also a negative effect in the algae and aquatic plant productivity [13]. The main effluent discharges and pollutant effects for each process unit are described below:
Pulp mill
Table 2- Discharge of organic substances from kraft pulp mills. Source: European Commission [14]
Process stage COD (kg/ADt3)
Wood handling 1 – 10
Condensates 2 – 8
Spillages 7 - 10
Washing loss 6 – 12
Bleaching 15 – 65
Total 31 – 105
Debarking consumes water and creates an effluent containing nutrients, fibres and oxygen-consuming organic compounds such as resin acids and fatty acids. Condensates derive from the process vapours from digesters and the evaporation plants. The COD is mainly methanol with some ethanol and a number of organic sulphuric compounds, turpentine and inorganic nitrous compounds. They may also contain ketones, terpenes, phenolics as well as various dissolved gases. A large proportion of nitrogen discharged from a kraft pulp mill is contained in condensates. Spillage of fibres and black liquor takes place in the digestion, screening and evaporation plants, washing and also from tanks. Spillage of white liquor, weak liquor and lime occurs during causticizing. The washing losses are mainly black liquor residues from the handling of unbleached pulp. As can be seen in Table 2, the bleach plant is the most important point of pollutants discharge to water in a pulp mill. The emissions from the bleach plant depend on the degree of delignification, the bleaching sequences/steps, the chemicals used and the type of wood. For what concerns the nutrients, they originate mainly from the wood itself. Nitrogen discharges derive mainly from the unbleached part of the process, whereas phosphorus discharges come from the bleachery [14] [15].
3
Paper mill
In paper mills, water is mainly used as cleaning water for the paper machine (shower water) and as a solvent for fillers and additives. There are a large number of chemical additives that can be used in papermaking. The choice depends on the type of paper wanted: for the production of the bulk grades such as packaging papers, some printing and writing papers, newsprint and hygienic papers the use of chemicals is limited to about 10 to 20 different groups of additives. For production of fine papers and especially of speciality papers, a much higher number of chemicals may be used. The discharge of additives to water is directly related to the power of retention of the chemical additives: the higher the retention the less chemical additives pass to the wastewater [14]
The main sources of wastewater discharges from paper mills are:
o Rejects from stock cleaning - The rejects from the paper machine contain impurities such
as sand and also some valuable fibres, suspended in water.
o Excess white water - the process water that results from the paper machine and spent
shower water from the cleaning of wires and felts. The main part of this water is recycled within the paper machine as dilution water and shower water, while the excess is discharged to the effluent. It generally passes through a fibre recovery unit before being discharged.
o Temporary and accidental discharges
Table 3 - Typical wastewater discharges from paper mills. Adapted from: European Comission [14]
Paper type COD (kg/t) BOD5
4
(kg/t)
Wood free printing and writing 7 – 15 4 – 8
Paper board 5 – 15 3 – 7
Tissue 8 – 15 5 – 7
Total 20 - 45 12 - 22
The discharge of organic matter has two main sources: 1) organic matter included in the pulp and 2) organic chemicals applied as additives or auxiliaries in papermaking, which are not retained in the paper web. Starch and their degradation products contribute significantly to the organic load. Some chemical additives may also contain organic bounded nitrogen compounds, for example the optical brighteners - contain up to 30% organic bound nitrogen (urea) [14].
4
11
2.3
ACTIVATED SLUDGE PROCESS
Description:
Activated sludge refers to a mass of microorganisms cultivated in the treatment course with the purpose of transforming organic matter into carbon dioxide, water, and other inorganic compounds. This concept was developed around 1913 at the Lawrence Experiment Station in Massachusetts by Clark and Gage and by Ardern and Lockett, in 1914, at the Manchester Sewage Works. They studied the aeration of wastewater in tanks and the hastening of the oxidation of organic matter and found out that sludge played an important role in the reduction of pollutants. This process is now widely used for biological treatment of municipal and industrial wastewaters and is very popular in the treatment of pulp and paper effluents. The main purpose of this method is to achieve the maximum organic load reduction with a minimum sludge production [16].
The activated sludge process contains the following unit processes (see Figure 4) [16]:
An aeration tank, known as biological reactor, where the microorganisms growth aerobically and suspended in the wastewater, degrading the organic matter. This growing mass of microorganisms is called mixed liquor volatile suspended solids (MLVSS);
A solid-liquid separation step, normally consisting of a clarification process. An important characteristic of the activated-sludge process is the formation of floc particles, ranging in size from 50 µm to 200 µm, which can be removed by gravity settling, leaving a relatively clear liquid as the treated effluent. The overflow (liquid phase) relates to the treated effluent and the solid phase relates to the biological sludge;
A system of sludge recirculation that takes place from the bottom of the clarifiers back to the aeration tank in order to guarantee an adequate concentration of microorganisms inside the biological reactor;
A system of sludge extraction (purge) that conveys the excess sludge to a sludge treatment line, avoiding an excessive increase of the microorganisms concentration inside the biological reactor.
removal. The microorganisms are maintained in liquid suspension through a system of mechanical or diffused aeration. The aeration system must be adequate not only for keeping the microorganisms in suspension but also to satisfy the oxygen needs for growth and endogenous respiration of biomass and also for nitrification. Therefore the minimum dissolved oxygen (DO) in the aeration tank must be keep at approximately 2 mg O2/L. For the removal of phosphorus
and for denitrification, anaerobic and anoxic zones are also necessary in addition to the aerobic zone [16].
Components and organisms involved:
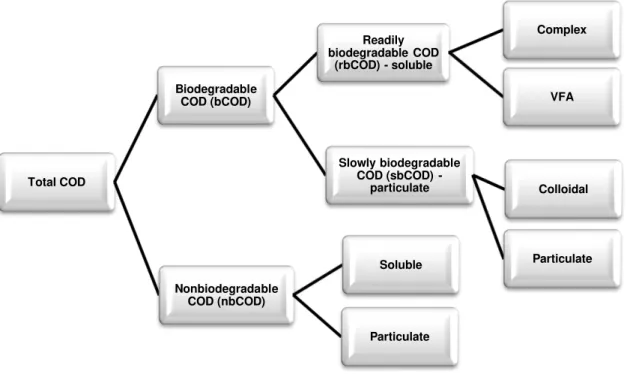
To understand the chemical reactions and biological processes that occur in a WWTP treated with the activated sludge process one must have knowledge about the components that serve as substrate and the ones that are biologically inert. For that matter, a COD classification is given, according to the degree of biodegradability of the organic matter [16] [17]:
Figure 2 - Classification of the Chemical Oxygen Demand according to biodegradability. Source: Eckenfelder and Grau [17]
Unlike BOD, some portion of the COD is not biodegradable and thus COD is divided into biodegradable (bCOD) and nonbiodegradable fractions (nbCOD). Each of these fractions can be splitted according to the physical state of the matter: soluble or particulate. The nonbiodegradable soluble COD will be found in the treated effluent and the particulate contributes to the total sludge production. Concerning the biodegradable COD, the soluble portion – readily biodegradable COD (rbCOD) is rapidly assimilated by the biomass while the particulate and colloidal COD (sbCOD) must first be hydrolysed by extracellular enzymes to be available for assimilation. Furthermore, rbCOD can be converted to acetate through fermentation, in anaerobic conditions, for uptake by the phosphorus-storing bacteria [16] [17].
Total COD
Biodegradable COD (bCOD)
Readily biodegradable COD
(rbCOD) - soluble
Complex
VFA
Slowly biodegradable COD (sbCOD) -
particulate Colloidal
Particulate
Nonbiodegradable COD (nbCOD)
Soluble
13 In terms of microorganisms, the activated sludge process consists of mixed microbial communities with a wide variety of organisms, including bacteria, protozoa, fungi, rotifers and possibly algae. These are classified according to the carbon and energy sources. For what concerns carbon sources, organisms obtain their carbon for cell growth from either organic matter (heterotrophs) or carbon dioxide (autotrophs). The energy needed for cell synthesis may be supplied by light (phototrophs) or by chemical oxidation reaction (chemotrophs). An example of phototrophic organisms is algae and/or sulphur-reducing bacteria. Chemotrophs may be either heterotrophic (protozoa, fungi and most bacteria) or autotrophic (nitrifying bacteria). Chemoautotrophs obtain energy from the oxidation of reduced inorganic compounds such as ammonia, nitrate, ferrous iron and sulphide while chemoheterotrophs derive their energy from the oxidation of organic compounds. When oxygen is used as the electron acceptor the reaction is termed aerobic and therefore, reactions involving other electron acceptors are considered anaerobic. The term anoxic is used to distinguish the use of nitrite or nitrate for electron acceptors from the others, under anaerobic conditions. Under anoxic conditions nitrite or nitrate are reduced to gaseous nitrogen in a process known as denitrification [16] [17].
In short, the biological reactions concerning the removal/formation of organic matter are listed below [16]:
Table 4 - Biological processes concerning organic matter.
Hydrolysis:
Extracellular biological reaction where hydrolytic enzymes break down large organic molecules into smaller ones that can pass
through the bacterial cell wall.
Biological growth (aerobic heterotrophics):
bacteria
2 2 3 5 7 2
Organic matter
COHNS O nutrients CO NH C H NO other end products
Endogenous respiration:
Bacteria use their own storage pools of organic matter for maintenance purposes. In this process, energy is provided by the oxidation of the organic matter contained in biomass, which leads to
undegradable matter and nutrients release.
bacteria
5 7 2 2 2 2 3
C H NO 5 O 5 CO 2 H 0 NH energy
Lysis/Decay:
The depletion of substrate and/or nutrients and the subsequent accumulation of metabolic waste products lead to the decay of
microorganisms.
Autotrophic organisms oxidize ammonia to produce the required energy for CO2 uptake and
growth - this process is named nitrification. The need for nitrification in a wastewater treatment concerns the necessity of nitrogen removal in order to control eutrophication. This process is a two-step oxidation: in the first step, nitroso-bacteria oxidize ammonia to nitrite and in the second step the nitro-bacteria oxidize nitrite to nitrate [18]:
In the denitrification process nitrate is reduced to nitrogen and other gaseous end products. Nitrification is an aerobic process while the denitrification is an anoxic process and therefore it implies the existence of an anoxic zone in the biological reactor [18].
(2.3) (2.1) (2.2) Slowly biodegr. matter Readily biodegr. matter Hydrolysis Biomass Biological growth Inert Material Decay
4 2 2 3 2
2 NH 3 O 2 NO 4 H NH 2 H 0
2 2 3
2 NO O 2 NO
3 2 2 2
15 Similarly to nitrogen, the need of phosphorus removal is also associated with the intention of avoiding eutrophication in the effluent discharge to the aquatic system. Phosphate may be present in the wastewater on the form of ortho-phosphate (PO43-), polyphosphate (P2O7) and/or
organic phosphate. The biological removal of this nutrient is carried by a certain group of microorganisms, called PAOs – polyphosphate accumulating organisms. These organisms have a specific metabolism, according to the anaerobic or aerobic conditions [16] [18]:
- Under anaerobic conditions, PAOs assimilate fermentation products (volatile fatty acids such as acetate) and store them as poly-hydroxy-alkanoates (PHA) within the cells with the simultaneous glycogen and polyphosphate consumption – phosphate release.
- Under aerobic conditions, PAOs uptake phosphate and form glycogen, restoring the pools of polyphosphate and glycogen. In this step energy is produced by the consumption of PHA resulting in the growth of PAOs.
Phosphorus can be incorporated into either biological solids (e.g. PAOs) or chemical precipitates. In a pulp WWTP, the phosphate precipitation with calcium is very frequent, due to the elevated concentration of this metal in the wastewater [16].
Physical Characterisation:
The following figure shows a scheme of the activated sludge process:
Figure 4 - Schematic diagram of Activated Sludge Process. Adapted from: Lenntech [19]
Where:
Q – influent flowrate (m3/d);
Qr– sludge recirculation flowrate (m3/d); Qw– excess sludge flowrate (m3/d);
X0– concentration of biomass in influent (g VSS5/m3); X – biomass concentration (g VSS/m3);
XR– concentration of biomass in the return line from clarifier (g VSS/m3); Xr– concentration of biomass in the excess sludge drain (g VSS/m3); Xe– concentration of biomass in the effluent (g VSS/m3);
V – volume of the aeration tank (m3)
Writing a biomass balance for the system:
Accumulation = inflow - outflow + net growth (2.4)
W
e W R gdXV Q X Q Q X Q X r V
dt
0 (2.5)
With rg being the net rate of biomass production (g VSS/m3.d). If it is assumed that the
concentration of microorganisms in the influent can be neglected and that steady-state
conditions prevails dX dt
0the equation can be simplified to:
Q QW
Xe Q XW R r Vg (2.6)
Dividing the equation byV X :
Q QW
Xe Q XW R rgV X X
(2.7)
Taking into account the definition of net biomass production rate:
g su d
r
Y r
k
X
(2.8)
W
e W R sud
Q Q X Q X r
Y k
V X X
(2.9)
With Y being the synthesis yield coefficient (g VSS/g bCOD), rsu the rate of substrate utilization
(g bCOD/(m3.d)) and k
d the endogenous decay rate coefficient (d-1). The inverse of the
right-hand term is defined as the average solids retention time (SRT) and thus:
W
e W RV X SRT
Q Q X Q X
(2.10)
The solids retention time, also known as sludge age, is defined as the average time in days the suspended solids remain in the entire system. The SRT is a particularly important parameter
in activated sludge processes as it gives an indication of the plant’s biological state: carbon removal, nitrification and condition of biomass (setteability).The common range for sludge age for a conventional activated sludge plant is between 3 to 15 days. For extended aeration
5
17 activated sludge plants the range is between about 15 and 30 days. This parameter can be controlled by adjusting the rate of activated sludge wasted from the system [20].
The food to microorganism (F/M) ratio is a parameter that describes the degree of starvation of the microorganisms. It is defined as the rate of BOD or COD applied per unit volume of mixed liquor:
Q S F
M V X
0 (2.11)
If the F/M ratio has a high value (high load) it means that the quantity of available substrate is high and therefore the microorganisms grow quickly and the majority of them are purged through the sludge. On the other hand, if there is a higher number of microorganisms than available substrate (low F/M) the growth will be much lower. Microorganisms will use the oxygen to metabolize the stored substrate (endogenous respiration) and as a consequence they produce less and better settling sludge. The F/M ratio in a conventional activated sludge plant conducted with extended aeration ranges between 0.05 and 0.15 [20].
The Sludge Volume Index (SVI) is the parameter used to evaluate the setteability and compactibility of sludge. This parameter is determined by placing a mixed liquor sample in a 1 to 2 liters cylinder and measuring the settled volume after 30 minutes and the corresponding MLSS concentration.
settled volume of sludge, mL/L mg/g
SVI mL/g
suspended solids, mg/L
3 10
(2.12)
The common range for an SVI at a conventional activated sludge plant should be between 50 and 150. A superior value is associated to the excessive growth of filamentous bacteria –
bulking. The filamentous bacteria tent to grow in long strands, having much greater volume and surface area than conventional floc and as a result they are very slow to settle, damaging the performance of the clarification. Bulking problems is associated with a low DO and low F/M and it can be detected because it is associated with high SVI values. The solutions for this problem involve the increasing of the recirculation and excess sludge flowrates and increasing of the DO in the aeration tank [20] [21].
In a PFR there is no dispersion of the influent, it flows along the reactor with a minimum longitudinal mixture (in ideal conditions) leaving in the same sequence that it entered. This configuration diminishes the probability of bulking problems, since the gradient of concentration of dissolved particles is lower and as a result the growth of filamentous bacteria is more limited. The SBR is the most recent configuration of the three considered and it is especially used for smaller communities and industrial installations with intermittent flows. It is a fill-and-draw type of reactor system involving a single completely-mixed reactor in which all steps of the activated sludge process occur. It gives more flexibility to the process and it can be operated as a selector process to minimize sludge bulking potential, due to the high F/M. On the other hand, the process control is more complicated and requires higher maintenance skills. Other types of configurations include the oxidation ditch, contact stabilization, Krause process, pure activated sludge, Orbal process and deep shaft aeration [23].
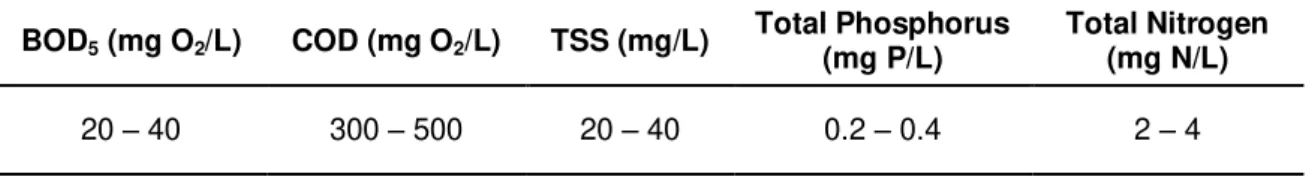
According to the Integrated Pollution Prevention and Control Report (European Commission, 2001) the typical removal efficiencies of a kraft pulp mill WWTP treated with the activated sludge process range from 85 - 98% for BOD5 and 60 - 85% for COD. Phosphorus and nitrogen
are reduced by 40 - 85% and 20 - 50% respectively. Generally, the treated effluent has the following concentration profile [14]:
Table 5 – Characterisation of the treated effluent from a Kraft pulp mill. Source: European Commission [14]
BOD5 (mg O2/L) COD (mg O2/L) TSS (mg/L) Total Phosphorus (mg P/L) Total Nitrogen (mg N/L)
19
CHAPTER 3. WWTP MODELLING
3.1
INTRODUCTION
A model is a simplified representation of what occurs in the reality. It is defined by a series of mathematical equations and procedures, constituted by different variables and parameters dependent on time. A model allows studying and analysing engineering questions in a shorter period of time, reducing the costs associated with laboratory analysis. In a WWTP, models can be used to evaluate the system response to a variety of perturbations, thus allowing the implementation of strategies that guarantee a better performance. They are also useful for process optimization and control, for example to evaluate several scenarios that might lead to improved operation of existing WWTPs and design alternatives for new WWTP installations via simulation. In this context, modelling can substantially reduce the scale-up time, because different options can be evaluated before a pilot plant is built [24].
3.2
MODELLING: STATE OF THE ART
In 1982, the IAWPRC – International Association on Water Pollution Research and Control, currently known as IAWQ – International Association Water Quality, established a Task Group in order to promote the development of studies on mathematical modelling towards the conception of a mechanistic model that could be used in a WWTP plant. The group focused on developing a simple mathematical model with realistic forecast capacity of the metabolic activity that happens in an activated sludge process, creating a solid work platform for future development of more complicated models. The final outcome was published in 1987 with ASM1
– Activated Sludge Model Nº1. This model consists of stoichiometric and kinetic expressions that describe the biochemical transformations of soluble and particulate compounds in the activated sludge, namely the processes of carbonaceous oxidation, nitrification and denitrification. The components (COD, ammonia, oxygen) may be consumed or produced in these processes according to a set of yield coefficients. The rate of each biochemical process is expressed in a series of Monod-type kinetic reactions. The transformations described by ASM1 include aerobic growth of heterotrophs and autotrophs, anoxic growth of heterotrophs, decay processes for both heterotrophs and autotrophs and hydrolysis of soluble biodegradable COD and organic nitrogen compounds [27].
By the time that ASM1 was presented, some of the WWTPs had already included a line of treatment for the biological phosphorus (bio-P) removal. However, due to the lack of knowledge associated with this process, the IAWQ group decided not to include phosphorus modelling. During the following years, several phosphorus removal studies were conducted and thus, in 1995, appeared ASM2 – Activated Sludge Model Nº2, which includes the biological phosphorus removal and also processes for phosphorus precipitation. Major additions to ASM2 include recognising a portion of heterotrophs as PAOs, which take up fermented carbon sources like volatile fatty acids (VFAs) and store them as PHA [28].
ASM2 did not include simultaneous phosphorus removal and denitrification by PAOs. This fact lead to the creation of an extended version, known as ASM2d, in 1999, which reflects the biological phosphorus removal achieved during denitrification as well as anoxic growth of PAOs. ASM2d became the most widely applied model incorporating EBPR – Enhanced Biological Phosphorus Removal [28].
21 between ASM1 and ASM3 is that the latter model is easier to calibrate, due to the conversion of the circular growth-decay-growth model (ASM1), known as death-regeneration model, into a growth-endogenous respiration model (ASM3). This facilitates the calculation of endogenous decay rates that can be performed by respirometry [29].
The models of the ASM family are considered state-of-the-art models of activated sludge processes and are used in most of the modelling and simulation studies. However, other models and versions have emerged meanwhile such as the TUDP model, Mantis, Mantis 2 and others [30].
The TUDP model, developed by the Delft University of Technology, combines the metabolic model for denitrifying and non-denitrifying bio-P with the ASM1 model (autotrophic and heterotrophic reactions). Contrary to ASM2/ASM2d, this model considers the internal metabolism of phosphorus accumulating organisms and models all organic storage components explicitly [30].
The Mantis model, developed by the modelling software company Hydromantis, is a re-adaptation of ASM1, which includes the following modifications: two additional growth processes were introduced, one concerning the autotrophic organisms and one concerning the heterotrophic organisms, both occurring on low ammonia and high nitrate conditions; the kinetic parameters are considered temperature-dependent and aerobic denitrification was also introduced. Mantis 2 is the most recent model and includes a large amount of information that was published in the literature over the last decade, namely side stream treatment processes like struvite precipitation, nitrification-anammox for nitrogen removal and other precipitation processes [31].
There is also an increasing number of modelling studies concerning the microbial population dynamics. These include: denitrification with external methanol addition, with two groups of denitrifiers exhibiting different growth kinetics and yield coefficients with the purpose of selecting the most efficient denitrifier population [32]; competition between PAOs and GAOs (Glycogen accumulating organisms) and its metabolism using not only acetate but also proprionate, incorporating production of other PHA fractions such poly-hydroxy-valerate (PHV) and poly-ß-hydroxy-2-methylvalerate (PH2MV) [33] [34].
Furthermore, empirical models have been used in association with mechanistic models in line to create the concept of hybrid models – simplified mechanistic models that include data about process reactions, relying on a prediction of desired outputs (e.g. effluent ammonia, COD, phosphate). The empirical model serves as a “trained” artificial neural network which can adjust specific inputs (e.g. aeration intensity, recycle flow rates) to produce a specific target output. Hybrid models can be attractive options for process control purposes, especially due to the increasing accessibility of consistent on-line measurement tools [37].
23
3.3
ASM2D - CHARACTERISATION
In this study the commercial software GPS-X 6.3 was used to simulate the activated sludge
process that takes place in Portucel’s WWTP. GPS-X is a modular, multipurpose modelling environment that uses an advanced graphical user interface to facilitate dynamic modelling and simulation. The simulator is built on the ACSL simulator that provides powerful integration and general simulator features. The biological models available in GPS-X are ASM1, ASM2d, ASM3, MANTIS and NEW GENERAL. The choice of the best model depends upon the processes that one is concerned about and the data/information available:
Table 6 – Processes covered by each model. Source: GPS-X Technical Reference [31]
Process: ASM1 ASM2d ASM3 MANTIS NEW
GENERAL
Fermentation Step • •
Nitrification/Denitrification • • • • •
Aerobic denitrification •
Aerobic substrate storage •
COD “loss” •
NO3- as a N source for cell
synthesis • •
Alkalinity
consumption/generation • • • •
Alkalinity (as a limiting
factor for growth processes) •
Biological phosphorus
removal • •
Precipitation of P with metal
hydroxides •
Temperature dependency • • • •
Given that the biological processes that happens in Portucel’s WWTP concern mainly the organic, nitrogen and phosphorus removal and since the pulp and paper mill release a considerable amount of metals such as Ca2+, the chemical precipitation of phosphorus was also
COMPONENTS OF THE MODEL:
Model components are basically divided in state and composite variables. The first ones are
known as the basic variables once that they are responsible for the system’s characterisation (GPS-X’s dynamic model of differential equations) and they are continuously integrated over
time. On the other hand composite variables are obtained from the matrix product of state variables and stoichiometric constants. State and composite variables are the parameters that characterize a WWTP plant model and they give an overlook of how the WWTP is behaving at a certain moment. When GPS-X builds a model of a layout, it establishes a material balance for each state variable in the unit process and then calculates the corresponding composite variables [31].
Both of these variables can be characterized according to the two physical types of matter: soluble matter (S components) and particulate matter (X components). The soluble components are transported with the water during the treatment process and may carry ionic charge, whereas particulate components (electrically neutral) are associated with the activated sludge and therefore can be concentrated by sedimentation/thickening [28].
Soluble components:
S (soluble inert organic matter)I - biologically inert organics that are present in the
influent matter but that can also be produced during the hydrolysis of particulate substrates. These components pass through the activated sludge system unchanged in form.
SS (readily biodegradable organic substrate)– these are simple molecules that may
be taken in directly by heterotrophic bacteria and used for growth of new biomass, under aerobic or anoxic conditions. In the ASM2d model, the readily biodegradable organic substrate corresponds to the sum of fermentable readily biodegradable organic substrate (SF) and the fermentation products (SA
6
). SF represents the fraction of readily
biodegradable substrate which serves as substrate for fermentation and SA/SLF
represents the endproducts of fermentation, as explained further below. Readily biodegradable organic molecules are formed by hydrolysis of particulate organic matter.
SLF (volatile fatty acids) – low molecular mass carboxylic acids (C2 - C7
monocarboxylic aliphatic acids) like lactate, acetate, propionate and butyrate, formed during the anaerobic biodegradation of organic matter. In the biological treatment, they are consumed during aerobic growth of heterotrophs on fermentation products, storage of poly-hydroxy-alkanoates (PHA) by poly-P accumulating biomass and during
6
25 denitrification with fermentation products. They are formed during fermentation and lysis of PHA. For stoichiometric considerations they are considered to consist only of acetate.
SO (dissolved oxygen) – dissolved oxygen, normally in the form of air. Oxygen
utilization is associated with heterotrophic/autotrophic growth and with aerobic storage and growth of poly-P by poly-P accumulating biomass.
SP (soluble ortho-phosphate) – inorganic soluble phosphorus. For the balance of
electrical charges it is assumed to be 50% H2PO4- and 50% HPO42-. It is consumed
during aerobic/anoxic storage and growth of poly-P by poly-P accumulating biomass and during precipitation of phosphates with metal hydroxides. It is formed during lysis of polyphosphates and redissolution of metal phosphates.
SNH (free and ionized ammonia) – ammonia nitrogen serves as nitrogen supply for
synthesis of heterotrophic bacteria and as energy supply for growth of autotrophic nitrifying bacteria.
SNO (nitrate and nitrite) – Nitrate and nitrite are produced by aerobic growth of the
autotrophic bacteria and are removed during anoxic growth of heterotrophic biomass (denitrification). For stoichiometric considerations they are assumed to completely be in the form of nitrate.
SNN (dinitrogen) – is the only nitrogenous product of denitrification. It may be suject to
gas exchange, parallel with oxygen.
SALK (alkalinity)– alkalinity of the wastewater. Alkalinity is introduced in order to obtain
Particulate components:
XI (particulate inert organic matter) – it is a fraction of the influent and it may also be
produced in the context of biomass decay. It becomes trapped in the activated sludge and is removed from the system through sludge wastage.
XS (slowly biodegradable substrate) – this parameter is related to high molecular
weight, colloidal and particulate organic substrates which must suffer cell external hydrolysis before they are available for degradation. In the process of hydrolysis they are converted into the readily biodegradable form and they are formed by decay of both heterotrophic and autotrophic biomass and also by lysis of poly-P accumulating biomass.
XBH (active heterotrophic biomass) – these organisms may grow aerobically and
anoxically (denitrification) and be active anaerobically (fermentation). They are responsible for hydrolysis of particulate substrates and they are destroyed by decay.
XBA (active autotrophic biomass) – nitrifying organisms, responsible for nitrification.
They are aerobic and chemo-litho-autotrophic.
XBP (PAOs) – these organisms are assumed to be representative for all types of
poly-phosphate-accumulating organism. XBP does not include the cell internal storage
polyphosphate and poly-hydroxy-alkanoates, but only the “true” biomass. The ASM2d
model assumes that these organisms may grow in anoxic or aerobic conditions.
XBT (poly-hydroxy-alkanoates (PHA)) – poly-hydroxy-alkanoates are cell internal
storage products of polyphosphate-accumulating organisms (PAOs). For stoichiometric considerations PHA is assumed to have the chemical composition of poly-hydroxy-butyrate (C4H6O2)n. PHA are destroyed by lysis and during aerobic/anoxic storage and
growth of PAOs.
XPP (stored polyphosphate) – polyphosphate is stored by PAOs under aerobic and
anoxic conditions and is destroyed during lysis of PAOs and through storage of PHA by the PAOs.
XMeOH (metal-hydroxides) – responsible for the phosphorus-binding capacity.
27
XMeP (metal-phosphates) – this component results from binding phosphorus to the
metal-hydroxides. They are formed during redissolution of metal phosphates and destroyed during the precipitation of phosphates with metal-hydroxides.
XTSS (total suspended solids) – this component is a lumped parameter consisting of
all particulate components, both organic and inorganic. It is important to predict since is readily measurable in WWTPs.
KINETICS AND PROCESS RATE EQUATIONS
The kinetics and stoichiometry used to describe the processes are based on simple Monod kinetics for all components that can influence the reaction rates. According to AM2d model, there are five types of biological processes that take place in an activated sludge plant:
Hydrolysis
Processes concerning heterotrophic organisms (XBH)
Processes concerning phosphorus accumulating organisms (XBP)
Processes concerning nitrifying organisms (autotrophic organisms XBA)
Simultaneous precipitation of phosphorus with ferric hydroxide (Fe(OH)3)
The mathematical representation of rate equations can be found in the appendix (Appendix I
– ASM2d rate equations), as well as the stoichiometric matrixes of the model. A summary of the description of state and composite variables for this model is shown in the next page.
![Table 2- Discharge of organic substances from kraft pulp mills. Source: European Commission [14]](https://thumb-eu.123doks.com/thumbv2/123dok_br/16502931.734110/29.892.250.642.434.658/table-discharge-organic-substances-kraft-source-european-commission.webp)
![Table 3 - Typical wastewater discharges from paper mills. Adapted from: European Comission [14]](https://thumb-eu.123doks.com/thumbv2/123dok_br/16502931.734110/30.892.192.699.769.946/table-typical-wastewater-discharges-paper-adapted-european-comission.webp)
![Table 6 – Processes covered by each model. Source: GPS-X Technical Reference [31]](https://thumb-eu.123doks.com/thumbv2/123dok_br/16502931.734110/43.892.130.771.387.979/table-processes-covered-model-source-gps-technical-reference.webp)
![Table 7 - State and composite variables defined in the ASM2d model – Part I. Source: GPS-X Technical Reference [31]](https://thumb-eu.123doks.com/thumbv2/123dok_br/16502931.734110/48.892.98.795.140.1143/table-state-composite-variables-defined-source-technical-reference.webp)