André Manuel Fernandes Coelho
Licenciado em Ciências da Engenharia Eletrotécnica e de Computadores
Solar rotation speed by detecting and
tracking of Coronal Bright Points
Dissertação para obtenção do grau de mestre em Engenharia Eletrotécnica e de Computadores
Orientador: Professor Doutor André Teixeira Bento Damas Mora, Professor Auxiliar, FCT-UNL
Co-orientador: Professora Doutora Maria Rita Sarmento de Almeida Ri-beiro, Professora Associada Convidada, FCT-UNL
Júri Presidente:
Arguente: Membros:
Solar rotation speed by detecting and tracking of Coronal Bright Points
Copyright © André Manuel Fernandes Coelho, Faculdade de Ciências e Tecnologia, Universi-dade Nova de Lisboa.
Acknowledgments
F
irst and foremost, I have to thank my dissertation supervisors Dr. André Mora and Dr. Rita Ribeiro. Without their assistance and dedicated involvement in every step throughout the process, this dissertation would have never been accomplished.I
t is unflattering not being able to describe how much effort, dedication and supervision Dr. André Damas Mora provided me and to this dissertation. It is truly an honor to be supervised by Dr. André and I believe I have learned so much from him which led me to admire him even further. I guess the best compliment I could give would be that there’s no better person to have as your dissertation supervisor and I strongly believe that if there’s a role model to follow, Dr. André is that person. Through countless hours of Q&A, problem solving headaches and even nonsenses from my behalf, Dr. André showcased the patience to put up with all of this and I would deeply like to thank him for everything he has done for me. Thank you!T
o my co-advisor Dr. Rita Ribeiro. Thank you so much for this topic proposal, the will-ingness and the support throughout all stages. Being allowed to work in a subject that I am pas-sionate about really helped boosting my commitment. Thank you for the unforgettable experience in Slovakia. The opportunity to develop my work alongside astrophysicists allowed me to grow as a person and as a student which I couldn’t be more grateful. These examples are just a glimpse of a far more rewarding acknowledgement that I ought to give. Nevertheless, my deeply thanks to you.vi
experience which I shall cherish for the rest of my life. I would also like to leave a word of appreciation for all the employees of the Slovak Central Observatory who received me so kindly and blessed me with the gift of friendship. Thank you!
T
his document finalizes my journey through university, but this journey was full of expe-riences and people that I have never truly thanked. Therefore, I want to show my gratitude to great mentors like Dr. José Manuel Fonseca, Dr. Helena Fino, Dr. José Barata, Dr. Mário Ventim, Dr. Paulo Pinto, Dr. Joaquim Pina, and Professor José Ferreira who taught me most importantly life lessons. Thank you Faculdade de Ciências e Tecnologia da Universidade Nova de Lisboa and everyone in it!W
hile family and friends are always there to back me up, cheer me up and encouraging me to fly higher when I feel I can´t even lift my own weight, I know there’s someone else that supports me unconditionally, knows who I am and what I’m capable of, trusts me to overcome my challenges and is the first one to step in and raise me from wherever hole I dug myself into. She is and has been the light of my life, my first love and my model of integrity and responsibility and for all that, there is no thanks, there is a deeper feeling that only she knows. Alexandra Videira for your efforts, patience, love and caring throughout most of my university days I just hope I’m up to the task to make you feel the same way you make me feel. Love you!F
amily is and will always be our safeguard. Firstly, I want to start by apologizing for not being able to finish this course sooner and for all the things I put you all through. In fact, it some-how made me realize some-how much I care, some-how much it hurts and some-how much I appreciate everything you do for me. Often we do not appreciate the things around us until we lose them, therefore, I am taking this time to think in each one of you, mom, dad, sister, grannies, aunt, uncle and cousins for everything you represent in my life. For everyone, thank you so much!T
o all my friends, (and please disregard the order, you all mean same, right?) Gonçalo Alves, João Lourenço, João Ralo, Gonçalo Oliveira, Nuno Ramos, José Ferreira and all your girlfriends that I may or may not know, but at least everyone gets happy! For the sake of this acknowledgement I do have more friends but I decided to state the name of the few who directly or indirectly encouraged me to finish my thesis and helped me to get there. Thank you very much!friendship endures for many, many years… I think both you, while being so different, taught me so much, not only school related subjects but also professionally and personally. Despite acknowl-edging your emphasis in my life, I just have one question to ask: When is the next snow trip going to be?
Abstract
Coronal Bright Points are one of many Solar manifestations that provide scientists evi-dences of its activity and are usually recognized by being small light dots, like scattered jewels. For many years these Bright Points have been overlooked due to another element of solar activity, sunspots, which drawn scientists full attention mainly because they were easier to detect. Never-theless, CBPs as a result of a clear distribution across all latitudes, provide better tracers to study Solar corona rotation.
A literature review on CBPs detection and tracking unveiled limitations both in detection accuracy and lacking an automated image processing feature. The purpose of this dissertation was to present an alternative method for detecting CBPs using advanced image processing techniques and provide an automatic recognition software.
The proposed methodology is divided into pre-processing methods, a segmentation section, post processing and a data evaluation approach to increase the CBP detection efficiency. As iden-tified by the study of the available data, pre-processing transformations were needed to ensure each image met certain specifications for future detection. The detection process includes a gra-dient based segmentation algorithm, previously developed for retinal image analysis, which is now successfully applied to this CBP case study. The outcome is the CBP list obtained by the detection algorithm which is then filtered and evaluated to remove false positives.
x
Resumo
Os Coronal Bright Points são uma das muitas manifestações do sol, que fornecem aos cientistas evidências da sua atividade e são habitualmente reconhecidos por serem pequenos pon-tos brilhantes espalhados por toda a extensão do disco solar. Durante muipon-tos anos, os Coronal Bright Points foram negligenciados devido a outro elemento da atividade solar, as manchas
sola-res, que recolheram a atenção dos cientistas principalmente por serem mais fáceis de detetar. No entanto, devido á sua distribuição ao longo de todas as latitudes, fornecem melhores referencias para estudar a rotação da coroa solar.
Uma revisão da literatura sobre a deteção e rastreamento de CBPs revelou limitações tanto na precisão de deteção quanto na falta de um sistema automático de processamento de imagem. O objetivo desta dissertação é apresentar um método alternativo para a deteção de CBPs usando técnicas avançadas de processamento de imagem e fornecer um software de reconhecimento au-tomático que pode não ser sempre exato, mas sim consistente.
xii
onda de 19.3nm obtidas pelo instrumento AIA 193 a bordo do satélite Solar Dynamics Obser-vatory (SDO) durante 3 dias em agosto de 2010, o que permitiu a perceção de como a velocidade
de rotação angular dos CBPs não só depende da latitude heliográfica, mas também de outros fatores, como o tempo.
A partir dos resultados obtidos ficou claro que a metodologia proposta é um método eficaz para detetar e acompanhar os CBPs proporcionando um método consistente de deteção dos mes-mos.
Table of Contents
Acknowledgments... v
Abstract... ix
Resumo... xi
Table of Contents ... xiii
Table of Figures... xv
Table of Tables ... xvii
Acronyms ... xix
1 Introduction... 1
1.1 Scope and Motivation ... 2
1.2 The Sun ... 7
1.3 Research Proble m ... 10
1.4 Dissertation Outline ... 13
2 State -of-the-Art... 15
2.1 Detection Methods ... 16
2.1.1 GPL ...16
2.1.1.1 GPL Process... 18
2.1.2 BP-Finder Algorithm...19
2.1.3 PSO Snake Hybrid Algorithm...21
2.1.3.1 Snake Model Process ... 22
2.2 Tracking Methods... 23
2.2.1 Image Registration ...24
xiv
3 Implementation... 31
3.1 Image Dataset... 31
3.2 Proposed Methodology... 33
3.2.1 Pre-Processing...34
3.2.1.1 Sliding Window... 36
3.2.1.2 Active Regions Mask... 37
3.2.2 Segmentation...39
3.2.3 Post-Processing ...44
3.2.3.1 CBPs Overlay Removal ... 45
4 Results Assessment ... 47
4.1.1 Methods and Equations ...50
4.1.2 Results Analysis...52
5 Conclusion and Future Works ... 59
5.1 Future Works... 61
Table of Figures
Figure 1: The rotation rate inside the Sun inferred from MDI data. ...4
Figure 2: CBP's finder algorithm on a Full-disk image of the Sun. ...5
Figure 3: Sun’s image with different wavelengths...6
Figure 4: Sun’s structure and activity. ...7
Figure 5: Image segmentation methods. ... 12
Figure 7: Final Labelling output image ... 17
Figure 8: Comparison between Watershed T. and GPL. ... 18
Figure 9: GPL process ... 19
Figure 10: CBP's detection using BP-Finder algorithm. ... 20
Figure 11: BP-Finder algorithm CBP detection... 21
Figure 12: Snake model ... 22
Figure 13: Snake model process ... 23
Figure 14: TRN image processing process... 26
Figure 15: Normalization technique. ... 27
Figure 16: Frequency domain correlation ... 28
Figure 17: Interest Operator ... 29
Figure 18: Proposed methodology ... 33
Figure 19: Discarded borders ... 34
Figure 20: Cropped image into two regions ... 35
Figure 21: Cropped image horizontally with overlap ... 36
xvi
Figure 25: Sun disk binarization ... 39
Figure 26: The Solar images obtained in 3 different SDO channels. ... 42
Figure 27: Segmentation process ... 43
Figure 28: Remerge illustration. ... 43
Figure 29: Remerge close-up illustration. ... 44
Figure 30: Section edges solution. ... 45
Figure 31: Overlay filter ... 46
Figure 32: CBP data over 3 days (limb excluded) ... 48
Figure 33: CBP locations on 9th August 2010 (limb excluded). ... 49
Figure 34: Stoneyhurst disks over solar image ... 50
Figure 35: 8 measurements from data collected. ... 52
Figure 36: Relation between the values of angular rotation velocity. ... 53
Table of Tables
Acronyms
AIA - Atmospheric Imaging Assembly
BP - Bright Point
CBP - Coronal Bright Points CME - Coronal Mass Ejections
DIC - Differential Interference Contrast
EIT - Extreme Ultraviolet Imaging Telescope
EUV - Extreme Ultraviolet
FITS - Flexible Image Transport System GPL - Gradient Path Labeling
HAD - Hazard Detection Avoidance
HMI - Helioseismic and Magnetic Imager
IDL - Interactive Data Language JPEG - Joint Photographic Experts
MDI - Michelson Doppler Imager
PNG - Portable Network Graphics
PSO - Particle Swarm Optimization RGB - Red, Green and Blue
RIM - Regional Intensity Maximum
SDO - Solar Dynamics Observatory
SOHO - Solar and Heliospheric Observatory
SOLA - Subtractive Optimally Localized Averages
SWAMIS - The Southwest Automatic Magnetic Identification Suite
1
Introduction
In this chapter the author unveils the motivations behind this dissertation providing an im-portant insight about the object of study, the Sun. It is relevant to define some key notions about the Sun in order to easily understand further discussed topics. Later on, the author outlines some obstacles that needed to be taken into account on image processing related subjects and on avail-able equipment limitations concerning images captured.It is noteworthy to mention that the scientific community does not, necessarily, have a sci-entific name for “our” Sun or “our” Solar System, thus being called by their common and respec-tive names. However, as Jagadheep states (D.Pandian, 2016), stars are categorized by temperature and size which helps understanding Sun’s profile related to other stars. Based on their tempera-ture, they are classified by a set of letters (e.g. O, B, A, F, G, K and M) which “O” corresponds to the hottest temperature, whether the letter M represents the coolest temperature stars. These group of star classifications are also subdivided into 10 classes (e.g. O0, O1…). Regarding size , stars are classified into classes such as Ia, Ib, II, III, IV and V. Therefore, based on this notation, “our” star can be classified as a G2V star (D.Pandian, 2016).
2
(http://www.solarham.net/) which is routinely updated with accurate solar information. The web-site provides real time solar news, as well as data from different sources which is a valuable tool to support researchers.
This dissertation will focus on Coronal Bright Points (CBP) detection and tracking in Solar disk images. Like a few other solar surface manifestations, CBPs have the potential to be remark-able tracers and therefore, provide a good support to researchers in Solar studies. The following chapters will provide in depth knowledge about these structures and the methods to be applied.
1.1
Scope and Motivation
The motivation behind this dissertation lies on the importance of knowing Solar differential rotation which, according to present conceptions, plays a decisive role maintaining Solar mag-netic fields and the whole Sun’s activity (Brajša et al., 2001). The key point is that differential rotation mechanisms, most likely caused by interactions between the convection and the overall rotation are still being subject of studies and not fully understood. In fact, Solar differential rota-tion calcularota-tions need to be performed concerning the different layers of the Sun (explained in the next sub-chapter), where both solar surface and interior rotation still are an open issue for solar physicists (Shahamatnia, Dorotovič, Fonseca, & Ribeiro, 2016a). Therefore, the author aims to apply image processing algorithms to a sequence of images of the Solar disk, to improve the understanding of its differential rotation as a result of identifying and tracing Coronal Bright Points.
Since one of the main objectives is to calculate Solar rotational profile it is important to understand why is that important.
There are several reasons to study the Sun (Thompson, 2004). Firstly, it is the only star that can be observed in detail, providing an important input about stellar structure and evolution. Sec-ondly, the Sun’s influence on Earth, without it, life wouldn’t exist and with it the constant flow of particles and radiation being expelled in every direction affect our planet dynamic and envi-ronment, thus the importance of understanding solar-terrestrial relations. Thirdly, Sun provides a unique laboratory for studying fundamental physical processes in conditions that cannot be rep-licated on Earth. Some of those studies were about manifestations of convective motions and acoustic and gravity waves, which can be found in (Deubner, 1975).
Regarding internal rotation, the term itself, “rotation”, is ubiquitous in astrophysical sys-tems as (Thompson, Christensen-Dalsgaard, Miesch, & Toomre, 2003) states. During a system’s formation as a result of gravitational contraction, its moment of inertia is reduced and therefore, any initial rotation is greatly enhanced. Often the evolution of this rotation is linked with the evolution of the magnetic field, therefore, understanding these processes is essential for a descrip-tion of this type of phenomena’s. Due to the fact that these processes are poorly understood by astrophysics, it increases the difficulty in developing efficient image processing systems that pro-vide the necessary detailed insights. Further, there are consistent surface rotation deductions from spectroscopic observations and from measurements of magnetic features motions such as sun-spots or CBP’s - the tracking Solar feature addressed in this dissertation.
4
Figure 1: The rotation rate inside the Sun inferred from MDI data. The equator is at horizontal axis and
the pole is at the vertical axis. The black shaped form in the figure represents lack of data and should be
discarded from analysis . Image courtesy of (Thompson et al., 2003).
Figure 1 provides an important insight about the internal rotation based on oscillations , which are predominantly standing acoustic waves or surface-gravity waves. In the convection zone the rotation varies principally with latitude and rather little with depth, although with signif-icant subtler details. Amongst these is the near-surface shear layer, where the rotation increases with depth. The radiative interior, on the other hand, rotates at a uniform rate. The transition between these two regimes takes place in a narrow region, called tachocline, where according to (Thompson et al., 2003) is widely believed to be the large-scale magnetic field generation by dynamo action and where is evident a strong radial rotational shear.
The Sun’s profile shown in Figure 1, suggests that the rotation in the convection zone be “constant in cylinders”, as Thomson states, thus, “there must be processes that redistribute angu-lar momentum in the convection zone, resulting in the observed profile”. With this in mind, it is
obvious that different methods provide hints on Solar rotation and the motivation for this disser-tation is propelled by the achievement of contributing to this issue.
More in line with the technologies to be used in this dissertation, the images provided by, for example, Solar Dynamics Observatory (SDO) that carries modules like Atmospheric Imaging Assembly (AIA) and Helioseismic and Magnetic Imager (HMI) ensure their applicability when developing robust and very efficient software to keep up with SDO data streams.
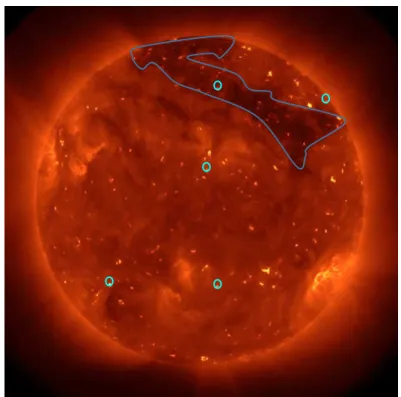
Figure 2: CBP's finder algorithm on a Full-disk image of the Sun. Coronal Bright Points have been
high-lighted from the background and appear similar to round shaped points in the Sun’s disk. This figure was
borrowed from (Martens et al., 2012) and was taken on 29July 2010 at 15:27:56 UT.
It is perceivable in Figure 2 the amount of bright points that could be selected as potential markers, however, not all of them are suitable due to their specific lifetimes. In order to corrobo-rate previous statements on this chapter, the image illustcorrobo-rates some CBP’s locations (highlighted in light blue), across all latitudes and even in coronal holes - highlighted area in dark blue.
The author emphasizes the importance of automated feature recognition not only on astro-physics domain but also in a wide range of daily application scenarios, such as diagnosis of med-ical X-ray images, traffic jam’ monitoring, security surveillance, between others (Acharya, 2005). In fact, not only the understanding of Sun’s activity and its rotational profile motivated this dis-sertation but also the development of image processing algorithms that empower scientists with new tools to answer yet unsolved questions.
6
To help elucidating the struggle about finding and detecting CPB’s, Figure 3 illustrates the complexity of Solar activity.
Figure 3: Sun’s image with different wavelengths . NASA’s SDO can see a wide range of wavelengths –
invisible to the naked eye but converted and colorized into an image human eye can see (Prigg, 2015).
Regarding Figure 3, the golden colored triangle of the Sun is the one which more clearly helps detecting CBP’s, which, again, can be identified by the round shaped bright points. Yet, CBP’s are not easily detected due to their specific nature and occur along with other manifesta-tions or phenomena’s of the Sun. What is also noteworthy, is that NASA’s SDO ability to produce images in a wide range of wavelengths which provides very high accuracy catalogs of solar fea-tures, most desirable assets for solar physicists (Martens et al., 2012). In fact, many studies have been limited by the fragmented nature of solar observations – different observatories, limited image cadence, and different time coverage – the result is that it is harder to find models capable of being applied to different cases, converging every single model to a specific solar manifesta-tion.
2012). For the purpose of this dissertation, as previously stated, the focus will be on CBP’s iden-tification which is believed to offer the best results as a valuable source of information regarding Sun’s differential rotation.
1.2
The Sun
Our Sun is the object of studies due to its immense value as a primary source of energy, therefore, it is important to continuously put effort on studying its properties and activities. In this topic the author’s intention is to provide some definitions needed to properly understand various concepts across this dissertation.
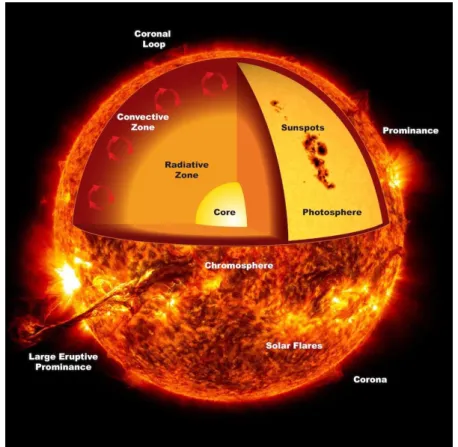
To begin with, Figure 4 illustrates Sun’s structure and a few of its activities. The objective of this image is to allow a broader view of the object of study.
Figure 4: Sun’s structure and activity. Figure borrowed from (ThinkLink, n.d.)
Pho-8
Regarding Sun’s structure and activities should be defined the following concepts:
Photosphere
This layer is known for sunspots observations and it’s the deepest layer observed directly. Its temperature varies between 6500K at the bottom and 4000K at the top and it is most covered by a form of granulation (Zell, 2015).
Chromosphere
This layer has an interesting property that unlike other layers the temperature raises as further way from the Sun’s center. The temperature varies between 4000K to 8000K at the top (Zell, 2015). It is known for solar flares observations.
Corona
Corona is the outmost layer of the Sun and has a temperature of about 500.000K up to a few million K. With no upper limit, this layer cannot be seen with the naked eye except during a total solar eclipse or with a coronagraph (Zell, 2015). This layer is known for Coronal Bright Points observations.
Active Regions
Active Regions in solar atmosphere have intense magnetic fields that emerge from the surface layers to form loops which extend to the corona. Often destabilizations occur due to external forces such as flux emergences and the system stored energy could be suddenly released as ac-celerated particles and an increase in solar eruptions, for example flares and coronal ejections (Moon et al., 2016).
Coronal Bright Points
CBP’s as they are currently known, are small and bright structures observed in extreme ultraviolet (EUV) and in X-ray frequencies of the solar spectrum. These bright points have a typical area of 2 × 10⁸ km2 and mean lifetime around 8 hours (Shahamatnia, Dorotovič, Fonseca, & Ribeiro,
polarity fragments that approach one another and disappear. Another interesting point (Chandrashekhar et al., 2012) refers is the shorter lifetimes for some bipoles seen by X-ray than EUV. Further into Chandrashekhar et al, document, it is found an explanation for this which summarily states that temperature depends strongly on the magnetic energy released and, there-fore, on the bipole magnetic-field strength. It also elucidate that not only coronal emissions rise due to an increase in emission area but also because CBP’s emit more per unit area as the magnetic flux becomes stronger. Yet these effects only occur when CBP’s are on growing or decaying phase, which means for the brightest moment of its lifetime, where there is an increased emission does not accompany by a comparable increase in the magnetic flux. Finally, there are studies that refer that there are different types of CBP’s, ones associated with the ephemeral regions and oth-ers called classical CBP’s, which do not exhibit significant evolution in their magnetic and coro-nal structure.
Sunspots
Sunspots, according to (Shahamatnia, Dorotovič, Mora, Fonseca, & Ribeiro, 2015), are the easiest features to detect from all manifestations of solar activity. Commonly seen as dark areas in Sun’s photosphere, cooler than their surroundings, grown in importance due to their nature, which are associated with strong magnetic fields and through tracking systems provide solar physicists val-uable insight and raw data about solar cycle. One of the advantages of using sunspots is a very long time coverage. On the other hand, there are numerous disadvantages: often complex struc-tures, non-uniform distribution, which do not extend to higher latitudes, and the number of sun-spots is highly variable during the solar cycle (D. Sudar et al., 2015).
Another relevant aspect about sunspots is the how they are classified. The Zurich classification scheme uses nine main classes according to the size of sunspots and their distribution inside a group. The Mount Wilson classification scheme sorts and groups sunspots according to their mag-netic structure into four main classes, that is, on relative locations, size of concentrations and opposite polarity magnetic flux (Moon et al., 2016). For more detailed classification other schemes are being used such as McIntosh classification containing 60 classes.
Solar Cycle
10
and in its maximum there will be several appearances with large diameter and last many weeks. Regarding the studies about the number of sunspots on Sun’s surface, Dr. Helen Popova clarifies there exists a cyclic structure that vary in every 11 years, which is commonly used to represent the average duration of the Solar Cycle.
Coronal Mass Ejections
CMEs are huge explosions of magnetic field and plasma from the Sun’s corona. This ejections are undisputedly important to track and study due to their responsibility for geomagnetic storms and enhanced auroras when impacting with Earth’s magnetosphere. CME’s originate from twisted magnetic field structures, often visualized by their associated filaments or prominences. When this twisted structures erupt from active regions, they are often accompanied by large solar flares, which travel in every direction from the Sun to its surroundings. At present time, the mag-netic field cannot be determined until it is measured as the CME passes through a monitoring satellite, leaving this occurrences to hit Earth’s tiny magnetosphere, which protect our planet’s life from perishing.
Focusing on the purpose of this dissertation which is the calculation of the Solar rotation profile, according to literature, the Sun rotates around its axis once in about 27 days. This rotation was first detected by observing the motion of sunspots but since the Sun is a giant, rotating cloud of gas it does not rotate rigidly like other solid planets. In fact, Sun’s equatorial rotation is faster, approximately 24 days, then Polar Regions, which rotate once in more than 30 days (NASA, n.d.). In order to precisely measure its rotation several studies are currently under research and new methods of providing data to astrophysics being developed.
1.3
Research Problem
Considering a given image of the Sun’s disk is perfectly taken, i.e. with an optimal resolu-tion and well defined CBP’s, the identificaresolu-tion and detecresolu-tion of them would be rather simplified. Therefore, applying an automated algorithm that provides precise CBP’s locations over a se-quence of optimal resolution images will improve efficient calculations of Sun’s differential ro-tation, with a minimum margin of error.
the hardware available because those type of images often require powerful processors and graphic cards to produce results as faster as possible.
Ideally, the research approach for detecting and tracking CBP’s would be accomplished by applying 5 steps:
Detection in which features are identified for each image.
Identification in which the detected features are given unique IDs.
Association in which the detected features in an image are given a secondary ID in order to link the feature with the succeeding images feature. This allows tracking throughout its lifetime.
Selection in which its given additional information about coordinates, center of mass and other relevant details.
Conclusion in which are given the summarized version of the process, optimized and prepared for future uses.
The above approach is based on the model presented by SWAMIS (The Southwest Auto-matic Magnetic Identification Suite) (DeForest & Lamb, 2014).
Each step has its own challenges to overcome, however, the first one is critical for the overall success of the process. Automatic recognition software provides an important tool to re-duce subjectivity, as previously mentioned, coronal bright points appear along with other solar activities, therefore, even amongst experts should be seen some disagreement about its identifi-cation. With this in mind, it does not mean that automatic recognition software is always accurate but at least it should be consistent. The developer should identify a set of features that provide the best possible identification and then, based on those, collect every existent CBP and repeat the process for the upcoming sequence of images.
The first research question addressed in this dissertation is then: why are CBP’s difficult to detect or why is there subjectivity related to their identification?
12
irregular shapes, should be taken into account. Another approach could be about evaluating the location of the center of mass, which would most likely provide better precision, even if a thresh-old needed to be added afterwards. Given a certain Sun disk image it is noticeable the brightness disparities between different features, therefore, other possible approach would be to detect those variations in brightness and applying intensity thresholds, isolating the ones referring to CBP’s. It is not always clear which method hand over the finest result and that’s why it is so important to update the available mechanisms and algorithms to ensure progression.
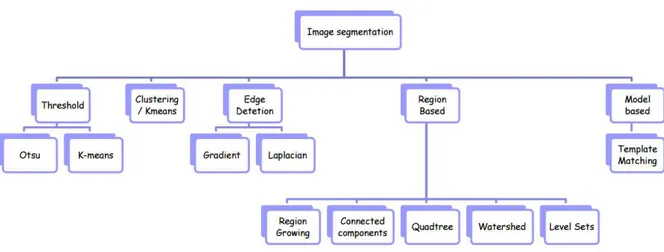
The feature identification process will also undertake image segmentation to fulfill the pur-pose of identifying and tracking CBP’s. Regarding segmentation, it can be defined as the process of partitioning the image into segments, labeling each pixel in order to understand which ones share the same characteristics (Yogamangalam & Karthikeyan, n.d.). The ultimate goal is to de-tect or locate objects and boundaries, which contribute for a clear analysis and in this particular case, of Coronal Bright Points.
Figure 5: Image segmentation methods . Courtesy of Faculty professors André Mora and José Fonseca.
There are several methods for image segmentation, as illustrated in Figure 5, that reduce image information for easier analysis. Naturally, there are advantages and drawbacks for each of them, hence the necessity of performing a background study to identify their potential value in this case study. Superficially, based on previous experiences, the author identifies region based methods likely to be the most promising ones, especially Gradient Path Labeling (GPL) (A. D. Mora et al., 2011), which is a labeling algorithm like connected components, but with similar results as watershed algorithm (A. D. Mora et al., 2015). More about GPL and other segmentation methods will be clarified in the next chapter.
1.4
Dissertation Outline
This dissertation features 5 chapters that provide an in depth knowledge about the work accomplished. Firstly, in this chapter was presented the scope and motivation, followed by Sun’s structure and definition and the research problem. Afterwards, it is presented a set of chapters which are objectively prepared for supporting analysis and introspection. The five chapters’ sum-maries are:
Introduction: Hosts the first impressions of the work developed. In this chapter the author targets the key points that led to pursue this challenge, both motivational aspects and daily basis endeavors of scientists which would benefit from this work. Moreover, it is presented the research problem and ways to tackle the challenge. Finally, the dissertation timeline is depicted
State -of-the-Art: This chapter aims to review some algorithms for detecting and tracking Coronal Bright Points. Should be looked upon as a background research study on existent algo-rithms with emphasis on detection and tracking, highlighting their potential, improvements and drawbacks. At the end of the chapter, the author presents a general conclusions section which targets the key subjects addressed in this chapter.
Implementation: At this stage, it is revealed the methods and techniques used in this dis-sertation. Firstly, a quick review on image formats and some explanations about the dataset used. Secondly, the methodology shaped to successfully tackle all the previously set obstacles is sug-gested and includes pre-processing methods, a segmentation section and a post processing meth-ods to increase the CBP detection efficiency. Finally, a thorough explanation of each step of the methodology is presented.
Results Assessment: This chapter summarizes the results obtained, equations and methods to retrieve the solar rotation profile.
2
State-of-the-Art
Studies of solar rotation profile are either based on tracing specific solar features or by applying Doppler measurements and equations (Davor Sudar et al., 2016). This chapter appeals to the acknowledgement of different algorithms and thought processes behind identifying and tracking solar features. Aforementioned in the previous chapter, there are several features in the Sun, however, only some provide hints on Solar rotation profile. Traditionally, sunspots were the principal object of research to understand Solar rotation and by understanding sunspots lifetime today’s solar cycle is defined by them. In fact, sunspots are the oldest tracers known for that purpose and studies are dated since 1951 according to (Davor Sudar et al., 2016). Nonetheless, this dissertation and many others related with the same subject, shifted their sight to another fea-ture which is believed to produce better results –Coronal Bright Points (CBP’s) – as previously mentioned, their arrangement across the solar disk should be of a greater value as a tracer to understand The Sun rotation profile.16
confirm their value as a tracer, therefore, providing additional intelligence about their size, life-time, number and type. Yet again, the major goal of these methods is the repeatability factor, maintaining a pre-defined criteria to reducing subjectivity.
2.1
Detection Methods
The selected algorithms presented in the following sub-chapters should provide a clear in-sight about advantages and drawbacks about their specific applications. Additionally, it is ex-pected to enlighten about the thought process, aiming to corroborate best practices when detecting features using digital image processing methods.
2.1.1
GPL
Gradient Path Labelling is a promising segmentation algorithm that combines both con-nected components and watershed transform. GPL is commonly used for detecting zones with maximum or minimum intensity and it accomplishes that by using an image gradient as the basis of a pixels’ labelling procedure, like (A. Mora, 2010) states. However, despite GPL algorithm been developed to fulfil a different role due to the nature of the case study presented by (A. Mora, 2010), the author of this dissertation believes GPL could be used to identify CBP’s in an image of the Sun’s disk.
The principle of the Gradient Path Labeling suggests that, alike a mountain climb, one or more paths reach the same maximum intensity. Therefore, the confluence of several significant ascending paths means that it should be present a regional intensity maximum (RIM). Regarding
, it illustrates the previous principle by looking into an image gradient in a velocity plot (also called quiver plot).
What is aimed to be obtained from this is a segmented image, where the features, intended to be detected, stay isolated from each other. Firstly, the algorithm detects RIM and areas of influence, collections of pixels which belong to the feature’s ascending path, Later on, it groups ascending paths from the same RIM and produces a segmented image, seen in b). The output is an image with better segmentation and less complexity making it, overall, an optimized process.
As (A. Mora, 2010) explains, the first stage is Labelling, a procedure that assigns to pixels with similar features a common label. Usually, to evaluate ascending paths, GPL procedure uses the gradient image, which main advantage is the analysis of pixel’s 3×3 neighborhoods that re-move several noise related artefacts. To achieve this operation, the most common methods are edge detection methods, such as Roberts or Sobel filters. Yet again, the output can be seen in Figure 6, being highlighted the maximum and minimum intensity pixels.
Figure 6: Final Labelling output image
It is also noteworthy, according to (A. Mora, 2010), that the complexity and time consump-tion of the algorithms implementaconsump-tion is approximately linear to the image’s size, which is con-sidered an advantage.
Further into the algorithms analysis, often after the first stage, the generated image appears to be over-segmented. Consequently, to overcome this drawback, a second stage is introduced – Labels Merging – which due to the existence of plateaus (flat hills) not all gradient paths end on the same RIM. Despite achieving good results with the solution for plateaus problem from Wa-tershed Transform, a merging algorithm was adopted. (A. Mora, 2010) merging algorithm “is based on the analysis of the paths with higher intensity between the RIM and each of its neighbors.
The merging condition is for the path’s amplitude difference to not exceed a predefined value”. What this allows is an algorithm which can output different images based on a parameter that defines the level of detail of the analysis.
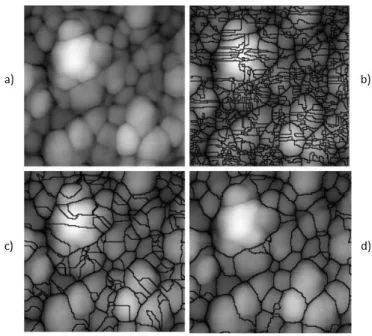
18
Figure 7: Comparison between Watershed T. and GPL. a) Original image, b) Watershed Transform, c)
GPL segmentation without merge, d) GPL segmentation with merge. Courtesy of (A. Mora, 2010)
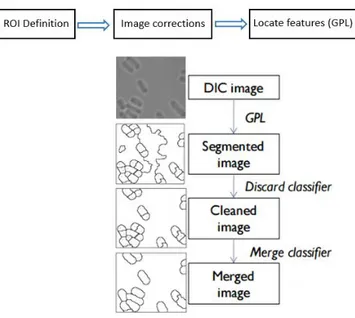
2.1.1.1 GPL Process
Figure 8: GPL process DIC stands for Differential Interference Contrast image. Image taken from FCT-UNL Advanced Topics on Image Processing course, 2016.
The case study presented in the images from Figure 8, is about GPL application in the detection and tracking of bacteria’s and it summarizes and displays the final output of the algo-rithms implementation. The diagram itself is self-explanatory, however, it is essential to empha-size the early, pre-processing, procedures which help “cleaning” the image and also, in the later stages, the merging algorithm to reach the desired output.
As a final point (A. Mora, 2010) also states that GPL algorithm can be applied to other image processing scenarios, including sunspots which was already tested. Therefore, GPL should be considered an important tool for Coronal Bright Points detection.
2.1.2
BP-Finder Algorithm
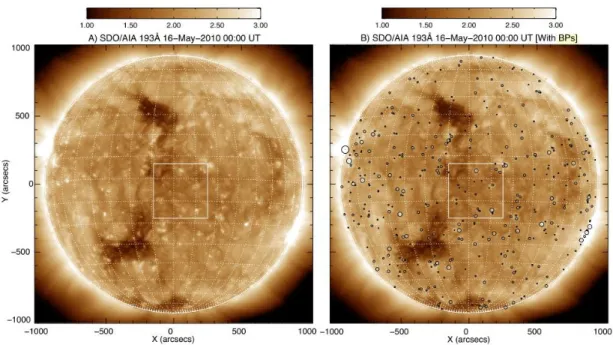
back-20 .
Figure 9: CBP's detection using BP-Finder algorithm. Image from (McIntosh, Wang, Leamon, &
Scherrer, 2014), which highlights with circular shaped forms the CBP’s
Regardless the previous approach, this algorithm as seen several modifications and im-provements from different sources, (D. Sudar et al., 2015) (McIntosh et al., 2014), aiming to enhance precision and better execution times. Figure 9 represents one of those modifications and illustrates the identification of several CBP’s across all altitudes, which is, apparently, a success-ful experiment. The methods used were focused on the pre-processing phase which prepares the image for some detection algorithm to be applied. These methods often hover the background intensity thresholds and most likely mixing images from different wavelength channels.
Figure 10: BP-Finder algorithm CBP detection Figure taken from (D. Sudar et al., 2015)
Despite most of the obstacles met were based on tracking, mostly due to instrumental ca-pabilities, high or low cadence and data density, it is noteworthy to mention that larger errors occurred in active regions positions, where the algorithm demonstrated difficulties in detecting CBP’s over a bright, variable background. Even so, (D. Sudar et al., 2015) conclusions, para-phrasing, “The segmentation algorithm used here proved to be completely adequate for the task” and delivered the necessary information to calculate Solar rotational profile with promising re-sults.
2.1.3
PSO Snake Hybrid Algorithm
An efficient system capable of tracking and measuring solar features automatically was developed following a hybrid approach, which combines specialized image processing, evolu-tionary optimization and soft computing algorithms. The purpose, according to (Shahamatnia et al., 2016a), was to develop a system which provides detection, characterization and tracking.
How-22
optimal solutions in very large spaces. Enthused by the social behavior in a flock of birds, the algorithm consists in relatively simple individuals, called particles, which each one of them rep-resent a potential solution for the optimization problem. For better overall performance, PSO in-stead of searching in the whole space, looks for more promising areas, iteratively improving the candidate solutions until the final result. According to (Shahamatnia et al., 2016a), PSO algorithm outperforms others from the same family providing better efficiency, execution time and smaller number of functions needed to reach convergence.
Secondly and crucial point, a specialized image processing technique was included in the hybrid method. Naturally, image segmentation comes to mind when aiming to detect objects in digital images, consequently, it was added an active contour model known as “snake-model” and the contours are known as “snakes”. The model works with energy functions, basically, every snake has its own energy and the one with lowest energy is considered the best match for repre-senting the object.
2.1.3.1 Snake Model Process
The process starts with setting up the initial contour/curve, as previously mentioned, defin-ing the snake, therefore, movdefin-ing towards the object. The snake movement is overseen by internal and external forces, within the curve and from the image respectively. These forces are responsi-ble for maintaining the snake shape and steer its way into the object. The Figure 11 represents the first step of the process, the snake being the initial contour and the object the target contour which is intended to detect.
Figure 11: Snake model
Figure 12: Snake model process
2.2
Tracking Methods
In this section, the author aims to provide an overall look on the literature about tracking features over a sequence of images. The purpose lies on identifying possible algorithms to be applied on the Sun’s disk image in order to track CBP’s. Considering a two-frame tracking ex-ample, tracking could be accomplished by using correlation-based matching methods, feature-based methods, optical flow techniques, change-feature-based moving object detection methods between others. However, it is also needed to be considered the main difficulties about tracking in a reliable way, which can be caused by image noise, illumination changes, non-rigid motion, non-stable background and so on and so forth. Another important point to refer is that tracking involves two basic problems: Motion and Matching; Motion should predict the limited search region in which the feature to be tracked is likely to be in the next frame and Matching which is the detection methods previously discussed.
Given the fact that might be needed some sort of image evaluation process, image registra-tion is a fundamental task often applied in image processing (Brown, 1992). The relevance of image registration lies on the necessity of comparing and integrate data obtained from different measurements, more precisely, if solar disk images from different wavelengths channels need to be correlated.
fea-24
tracking algorithms coexist in the two purposes, despite the decision making behind choosing the best landing site being irrelevant for this dissertation.
2.2.1
Image Registration
Image Registration is the processed of overlaying images of the same scene but taken at different times. As previously mentioned, these type of processes are often valuable when corre-lating data from different measurements, therefore, introducing news aspects to analyze (Zitová & Flusser, 2003). According to (Zitová & Flusser, 2003) the majority of registration methods consists in the following four steps:
Feature detection
Feature matching
Transform model estimation
Image resampling and transformation
Bearing in mind the previous steps and neglecting the Feature detection due to already been discussed, clearly, some target template is needed to achieve Feature matching, which may or not be an obstacle due to storage or execution time constraints. Relatively to Transform model estimation it’s the so called mapping functions which provide the means to define the types and parameters for aligning the two images. Lastly, Image resampling and transformation it is the transformation itself based on the previous parameters, whereas the resampling technique de-pends on the trade-off between accuracy and computational complexity. Often nearest neighbor or bilinear interpolation will be suitable for the task.
distorted. According to (Zitová & Flusser, 2003) there are some algorithms that use spatial rela-tions, such as graph matching algorithm, clustering techniques and chamfer matching for image registration. On the other side, methods using invariant descriptors allow that correspondence of features may be detected based on specific features. These descriptors should be invariant, unique , should provide stability and be independent. Therefore, the simplest feature description is the image intensity itself, limited to the close neighborhood of the feature. Several descriptors are illustrated in (Zitová & Flusser, 2003) and mostly are based on deformations which are also fre-quently unique. Analyzing further into the same paper, some algorithms come across such as histogram of line-length ratios or histograms of angles differences.
Summarily, area-based methods are more likely to be applied to images that does not have many prominent details and the distinctive information is provided by gray level or color rather than shapes or structures. On the other hand, feature-based methods are typically applied when there is structural information available which are more significant than the image intensity. The common drawback are that feature may be harder to detect or are unstable in time. Therefore, it is crucial to identify its descriptors correctly.
2.2.2
Visual Based Algorithms
This sub-section aims to provide some context of autonomous image-based navigation al-gorithms to space science missions. The potential of these autonomous spacecraft systems is over-whelming, not only reducing costs but also enhancing other systems capabilities and perceptions. In fact, these systems are being developed to offer spacecraft’s an autonomous approach to find suitable landing sites, also benefiting on-board systems with information about velocity and po-sition relatively to a landing site (Johnson, Montgomery, & Matthies, n.d.). However, why is this important for detecting and tracking CBP’s? The answer lies on the real-time detection and track-ing of features durtrack-ing the descent of the spacecraft. Therefore, basically these systems and the one this dissertation aims to obtain settle in the same principles: detection of features, tracking them over a sequence of images and have a robust yet quick algorithm to fulfil its purpose.
26
In order to understand the following sequence of steps, Figure 13 will provide assistance based on the labels on it. Mainly, it will be discussed a Coarse Matching Method and Precision Matching Method.
Firstly, to contextualize the spacecraft is entering the planet (seen in label 1) and we have an overall view of the surface, generated a-priori using orbital data, which is a digital elevation map co-registered with an intensity brightness image (label2). From there, the image is normal-ized (label 3) to eliminate lower frequencies and enhance contrast for better matching. As the spacecraft is descending it takes several of images (label 4), but for the sake of the explanation lets only consider the first one. The next phase (label 5) is ignored due to not being relevant for this dissertation. Following the steps, the warped image is normalized (label 6) using the previous technique and it should be selected coarse features (label7) for matching against the normalized map (seen in label 3). As seen in Figure 13, under selected features square, there is a correlation template which will be submitted to a frequency based or Fast Fourier transformed-based corre-lation (label 8) in order to understand where that correcorre-lation matches the normalized map. The matching place will be a peak in correlation between the two datasets and therefore, use this information with the co-registered digital elevation map and create 3D points on the surface.
Figure 13: TRN image processing process . Courtesy of (Johnson, 2014)
2014) states that a simple and efficient approach is to compute mean and standard deviations of intensity or brightness in a local neighborhood around a pixel and subtract the mean and divide by the standard deviation an then applying it to the normalized map, shown in Figure 14.
𝑝̅ = ∑ pi , σp = √∑(𝑝 − 𝑝𝑖)2
𝑝′= (𝑝 − 𝑝̅) 𝜎𝑝
(2.2.1)
Figure 14: Normalization technique. Courtesy of (Johnson, 2014)
As seen in Figure 14, the purpose is to flat out everything and highlight the scene content, improving the overall processed while eliminating differences in brightness for example.
28
Figure 15: Frequency domain correlation Courtesy of (Johnson, 2014)
Figure 16: Interest Operator
Finally, by using both of Coarse Matching Method and Precision Matching Method and the correlation between the images and data from the two, the system is able to safely and accu-rately find the best possible landing spot in about 10 secs time, which an impressive time.
2.3
General Conclusions
The chapter covered some of the detection and tracking methods published, not only in the solar images case study but rather in a broader view related to advanced image techniques applied to different studies. It was also stated some of the obstacles faced by these methods in order to provide the reader and also the author with favorable insight about what should focused on while developing the software for this dissertation case study. More specifically, increasing CBPs de-tection accuracy towards other manifestations that might superimpose the tracers, or even taking into account the limb of the solar disk which deforms CBP appearance.
Based on the literature review about detection and tracking methods, Gradient Path Label-ing algorithm should produce the best results for detectLabel-ing CBPs. There is limited evidence that this algorithm will perform as accurately as it did in Druses or bacteria’s due to never have been tested in solar images. Nevertheless, the promising results obtained by the algorithm might reflect bright results when applied to different case studies, such as solar features detection.
30
Another approach to tracking would be by securing an accurate detection, export all the CBP data to a process/database software and analyze the tracking through there. What is perfectly feasible because it should have all the parameters needed to characterize, select and track a given CBP.
3
Implementation
This chapter aims to describe implementation procedures, thought processes, challenges and solutions to overcome those challenges. Being the core of this dissertation, it scopes every aspect in detail, providing illustrations for quicker and more reliable understanding and introduc-ing the reader to a further scientific and technical approach to the research problem.3.1
Image Dataset
Image dataset is introduced as a subchapter under Implementation section due to its rele-vant significance acknowledged throughout the implementation phase. To begin with, a quick review on a few image formats is presented:
JPEG
32 PNG
Stands “Portable Network Graphics and it is often used on the Web. This file format uses a lossless compression and provides 256 levels of transparency that distinguishes it from any other formats. Despite its many benefits it requires more disk space than JPEG, therefore, it is not suitable for every scenario being mostly used by web developers and graphic artists.
FITS
Stands for “Flexible Image Transport System” and it is the standard data format used in astronomy. It is used for transport, analysis, and archival storage of scientific data sets. FITS is known for its multi-dimensional arrays: 1D spectra, 2D images, 3D+ data cubes; tables containing rows and columns of information and header keywords for descriptive information about the data. Like other standards, FITS usage in astronomy predates JPEG and PNG and has some desirable qualities that are often crucial for scientific data:
stores more bits per pixel and also floating values;
Storage arbitrary number of data channels;
Lossless compression;
Storage unlimited metadata in the header.
It is therefore clear that FITS format co-evolved with astronomical data processing. FITS file compression is achieved using GZIP utilities.
Regarding the data it is imperative to talk about the star and the satellite responsible to supply that data. The Sun is often more interesting to be observed at Extreme Ultra-Violet (EUV) wavelengths, rather than visible wavelengths. This is particularly important when the object of study are Coronal Bright Points which appear bright in these wavelengths. NASA’s Solar Dy-namics Observatory (SDO) was launched aboard an Atlas V rocket on Feb. 11, 2010 with the mission to study the Sun’s Energy and influence on space weather. Equipped with an Atmospheric Image Assembly (AIA) module it supports researchers through images in EUV wavelengths suit-able to study Sun manifestations.
order to be opened in the developed application. FITS image header provided additional infor-mation such as: Sun radius (R⊙), which is about ≈1578 pixels, the Sun is centered in the image and even the Sun distance from Earth which was 149,597,870,691.0 meters for the first image on the 9th of August, 2010.
Despite the use of full-disk images, data points near the limb (> 0.962 R⊙) were not
con-sidered to avoid possible inaccuracies in position for this points.
3.2
Proposed Methodology
The following figure summarizes the proposed methodology which is divided into pre-processing methods, segmentation algorithm, post pre-processing and a data evaluation approach to increase the CBP detection efficiency.
34
3.2.1
Pre-Processing
Due to the available high resolution images of the Solar disk (16 megapixels) and the seg-mentation algorithm complexity being proportional to the images resolution, the author chose to split the image into several smaller regions and apply the segmentation in each one of them. Fun-damentally, this approach enables quicker processing when applied to a large dataset. However, there are a couple of particularities that need to be addressed, in order to, ensure no CBP is ne-glected.
First and foremost, the images available in the dataset used are 4096 × 4096 pixels and the Solar disk is centered, therefore, one of the first steps implemented was to discard unwanted re-gions like the borders of the image. In Figure 18, the original image was cropped in width and height around 440 pixels, which significantly reduces the number of pixels to be further pro-cessed. The selected region would therefore start in (x,y)=(440,440) pixel coordinates and finish-ing by the coordinate (x,y)=(3656,3656).
Secondly, the remaining image still had to be cropped into regions as previously stated. For that reason, let us consider the following image, Figure 19.
Figure 19: Cropped image into two regions (Not in scale)
Figure 19 is an image from SDO 193 channel which was used for testing and to illustrate one of the challenges that led to a sliding window approach.
36
Figure 20: Cropped image horizontally with overlap(Not in scale).
Figure 21: Cropped image vertically with overlap (Not in scale).
3.2.1.1 Sliding Window
After cropping borders the image sized reduced from 4096 × 4096 to 3216 × 3216, which is a 38.3% reduction. The reduced image had to be split into regions of the same size, taking also into account the overlapping area. For that reason, the reduction was actually about 15.73%.
The sliding window configuration began by understanding the pixel area of the CBP’s (from 50 to 1000 pixels), to estimate how much overlapping area was required. Through visual inspection most CBP’s would range from 30 pixels to 150 pixels, thus, regions would be over-lapped in no less than 181 pixels, about 19%. The window size was also a factor, due to 181 pixels overlap and the requirements of being under 1024 × 1024 pixels, resulted in a window size of 940 × 940 pixels, as illustrated in Figure 22 which shows the calculations performed in both width and height. With this type of arrangement, the 3216 × 3216 pixels image is divided into 16 regions of 940 × 940 pixels.
Figure 22: Overlap calculations
3.2.1.2 Active Regions Mask
38
Initially, the first approach was to apply the segmentation algorithm and assess if the CBPs detection was accurate despite other bright manifestations. Truthfully, even after applying filters based on size, the algorithm outcome would exhibit CBPs inside active regions, which can be explained by existing inside these regions contours very similar to CBPs structures.
Figure 23: Solar images with and without Sobel filter applied. (a,c) Solar images before applying Sobel
Filter. (b) CBP contours visible (on the left side near the limb) after Sobel filter application and an active
region on the top right corner. (d) Active region represented after Sobel filter been applied.Both left
im-ages (a) and (c) are cropped imim-ages (not in the same resolution) from the original image that suffered a Sobel transformation resulting in the right side images (b) and (d). The issue focused on these illustrations lie on the visual structures seen in an active region, shown in d), which
re-semble the CBP structures shown in image b) (near the limb on the left side).
Figure 24: Sun disk binarization
Figure 24 illustrates the result image after binarization and morphological operations, namely erosion and dilation. More in detail, it was performed over a 2x2 mask an erosion and dilatation afterwards in the binary image. It could also have been used a greater mask, for instance 3x3. This mask would then be used to discard the CBPs selected inside the white regions, as follows: if the centroid of the CBP is located in a white pixel, then it should be invalid and, therefore, discarded.
Both morphological image processing operations used are useful to remove CBPs from the binarized image and thus accidentally rejected. These two transformations often used for image enhancement are used to decrease low amplitude noise and to remove smaller bright structures (CBPs) from the image.
The limb of the Sun image is a region where CBPs will appear stretched or with uncharac-teristic structures, hence, potentially increasing detection inaccuracy. In order to minimize this issue and, again, following other authors, limb regions are neglected.
3.2.2
Segmentation
In 2.1.1 it is presented the segmentation algorithm used in this dissertation. Gradient Path Labeling algorithm was previously applied for detecting Druses in the human eye (A. D. Mora et al., 2011), to detect bacteria in a sample (A. D. Mora et al., 2015) and now to detect CBPs.
40
parameters are location (offset X and Y), centroid location, pixel area, max, min, mean and accu-mulated amplitudes, gray and RGB mean and max amplitudes, validation criteria and label ID.
First and foremost, GPL configuration manager provides the user the option to do some image-preprocessing such as choosing from the source image one of RGB channels or its inten-sity. It also provides the option to apply negative, mean filter (3 × 3), gradient, use black as mask between other options. Secondly, after deciding which preprocessing need to be applied, the fol-lowing options are related with the GPL configuration itself and the options available include 3×3 mean gradient or 5×5 gradient, flooding, merging amplitude percentage and merging min ampli-tude range. Thirdly, the options available are for results selection and are a set of filters that pro-vide assistance for enhancing GPL results. This section includes min and max number of pixels that an object can have, min gradient amplitude, minimum ratio between gradient and pixel num-ber, mean amplitude and even filter generated by decision trees.
The output of the GPL algorithm is, as previously mentioned, a collection of objects that represent the intended features for the detection. The GPL manager also provides visualization tools to better perceive the results, as well as saving options like exporting the data to an excel file.
Configuring the options available to obtain the most accurate CBP was key topic of this dissertation. Therefore, the configuration used was as follows:
Default values:
Flooding = false;
Flooding Stop Condition = 4;
Lower Complete = false;
Gradient 5×5 = false;
Merge = true;
Maximum Selection = false;
Minimum Pixels = 0;
Maximum Pixels = 0;
Minimum Gradient Amplitude = 0;
Minimum Amplitude = 0;
Background = 85;
Sectioning Threshold = 10;
Amplitude Percentage = 5;
Negative = false;
Channel type =0;
Mean filter = true;
Outside Margin = 10;
Use Black as Mask= false;
Sort Max info = false;
Watershed Marks = false;
Watershed Immersion = false; Changes for 19.3 nm channel:
Negative = true;
Gradient = true;
Maximum Selection = true;
Maximum Pixels = 50000;
Altogether it was assessed that the ideal configuration for GPL would somehow to select only small area objects with relatively high amplitude and ignore the remaining ones. Subse-quently and regarding all the other amplitudes, they should be considered as in the same level, or the same plateau, which, therefore, created a big object that represents the background. The reason behind the change to 50000 pixels was to be able to detect the background instead of the CBPs, the outcome would be a massive object with gaps in it. Those gaps would, therefore, be possible CBPs. Essentially, after applying this change, each one of these gaps were validated on the exist-ence of CBPs.
Regarding negative it is used to enhance white or gray details in dark regions. An Image gradient is a directional change in the intensity, which is aimed to detect the CBP contour, hence improving GPL results. In fact, the gradient analysis provide independence from illumination by searching for intensity changes and not just its amplitude, also allowing a significant reduction of noise artifacts.
42
Figure 25: The Solar images obtained in 3 different SDO channels.
The primary focus of this post-processing is to gather the most important parameters that would allow to validate CBP detection and tracking through multiple sources, for instance, dif-ferent wavelengths. If similar results were to be obtained would demonstrate the robustness of the algorithm and enhance the accuracy and precision of the detection. Another essential point is that for each wavelength some features are highlighted more than others, hence by extracting different information from all and fusion that data it is expected to improve the conditions to detect CBPs or even perceive events not acknowledged by individual inspection.
Figure 26: Segmentation process
Running the GPL detection with the first configuration set, it outputs an over segmented image that needs remerging to represent clear CBP structures, as illustrated in Figure 27. To achieve this, the amplitude percentage is changed to a greater value (e.g. 1000) in order to clear some unwanted objects.
44
prominences that were mistakenly selected by the algorithm. While in this case most of these unwanted objects would have been filtered by the binary mask, if any would have prevailed, this solution, yet not being perfect, would have helped in this matter. Additionally, as demonstrated by image b) (where no binary mask was applied) in the active region, that there are still some CBP size objects that prevailed, which would have been effectively discarded by the binary mask. Figure 28 is another evidence of the remerged solution and illustrates in detail an object being remerged. Despite the validation for this object, the solution avoids the same entity being partitioned, which would increase inaccuracy.
Figure 28: Remerge close-up illustration. (a) Before merge, (b) after remerge;
Although these factors contribute to significantly improve the algorithm results, the cost is doubling its execution time. In conclusion, merge operation adds complexity and its execution time depends on the number of objects found initially, but it is a major factor for the algorithm successful output.
3.2.3
Post-Processing
Image Fusion is a methodology concerned with the integration of multiple images into a single image, usually more complex but suitable for human visual perception or specific compu-ting processing tasks.