R E S E A R C H A R T I C L E
Open Access
Fostered and left behind alleles in peanut:
interspecific QTL mapping reveals footprints of
domestication and useful natural variation for
breeding
Daniel Fonceka
1, Hodo-Abalo Tossim
2, Ronan Rivallan
1, Hélène Vignes
1, Issa Faye
2, Ousmane Ndoye
2,
Márcio C Moretzsohn
3, David J Bertioli
4, Jean-Christophe Glaszmann
1, Brigitte Courtois
1and Jean-François Rami
1*Abstract
Background:Polyploidy can result in genetic bottlenecks, especially for species of monophyletic origin. Cultivated peanut is an allotetraploid harbouring limited genetic diversity, likely resulting from the combined effects of its single origin and domestication. Peanut wild relatives represent an important source of novel alleles that could be used to broaden the genetic basis of the cultigen. Using an advanced backcross population developed with a synthetic amphidiploid as donor of wild alleles, under two water regimes, we conducted a detailed QTL study for several traits involved in peanut productivity and adaptation as well as domestication.
Results:A total of 95 QTLs were mapped in the two water treatments. About half of the QTL positive effects were associated with alleles of the wild parent and several QTLs involved in yield components were specific to the water-limited treatment. QTLs detected for the same trait mapped to non-homeologous genomic regions, suggesting differential control in subgenomes as a consequence of polyploidization. The noteworthy clustering of QTLs for traits involved in seed and pod size and in plant and pod morphology suggests, as in many crops, that a small number of loci have contributed to peanut domestication.
Conclusion:In our study, we have identified QTLs that differentiated cultivated peanut from its wild relatives as well as wild alleles that contributed positive variation to several traits involved in peanut productivity and adaptation. These findings offer novel opportunities for peanut improvement using wild relatives.
Background
Polyploidy means that two or more complete sets of chromosomes of the same (autopolyploid) or different (allopolyploid) genomes are present in the same nucleus. It is a prominent and significant process in plant evolu-tion [1,2]. Polyploidy has been considered important in conferring adaptive value to some cultivated species by increasing the allelic diversity, maintaining genome-wide heterozygosity and allowing the emergence of novel phenotypic variation [3-6]. The stages of polyploid for-mation usually include reproductive isolation from the progenitors, resulting in severe genetic bottlenecks.
However, as most polyploid species have been formed recurrently from their wild progenitors [7], a moderate level of polymorphism has been kept in polyploid plants.
Peanut (Arachis hypogaeaL.) is an allotetraploid (2n =
4x = 40) native from South America with an AB gen-ome. In contrast to the recurrent formation of several polyploid species, the allopolyploid structure of culti-vated peanut is likely derived from a single hybridization between two wild diploid species followed by chromo-some doubling [8]. Consequently, its monophyletic ori-gin and domestication effects have greatly narrowed the genetic basis of the cultigen.
The peanut primary gene pool comprises elite
breed-ing lines and landraces of the cultivated speciesA.
hypo-gaea andA. monticola, a closely related wild tetraploid species of cultivated peanut [9]. Although a large
* Correspondence: [email protected]
1
Cirad, UMR AGAP, TA A108/3, Avenue Agropolis, Montpellier F-34398, France
Full list of author information is available at the end of the article
amount of phenotypic variation is conspicuous in this gene pool, only a limited level of DNA polymorphism between genotypes has been observed [10-14]. With the increase of the number of molecular markers, efforts have been invested for developing genetic maps [15,16]. QTLs for physiological parameters and yield component traits linked with drought tolerance have recently been reported [17]. However, there has still been little pro-gress on the integration of molecular markers in intras-pecific peanut breeding programmes despite the challenge to obtain new varieties with resistance to dis-eases and tolerance to abiotic stresses.
The secondary gene pool of cultivated peanut mainly comprises wild diploid species (2n = 2x = 20) and repre-sents an important source of novel alleles that can be used to improve the cultigen. Extensive work has been done to characterize genetic relationships between spe-cies of this gene pool and cultivated peanut using mole-cular markers [18-23] and cytogenetics [24-26]. Several wild diploid species have been hypothesized as the pos-sible ancestors of the cultivated species. Recent studies
have proposedA. duranensis(A genome) andA.
ipaen-sis (B genome) as the most probable wild progenitors
[24,27,28]. Favero et al. [29] produced a synthetic
amphidiploid resulting from a cross betweenA. ipaensis
and A. duranensis and doubling of the chromosome number. This amphidiploid has produced fertile hybrids
when crossed with each of the botanical varieties of A.
hypogaea. Furthermore, resistances to several diseases have been identified in wild species [30-33] and QTLs for disease resistance were recently mapped in a cross involving wild diploid species [34]. Introgression of
dis-ease resistance genes from the wild diploid speciesA.
cardenasii into an elite peanut variety has also been reported [35,36]. However, the effective transfer of genes from peanut wild species to cultivated species was reported to be labor intensive [37] and the introgression of genes involved in the variation of complex traits such as yield has to our knowledge never been reported. Hence, genetic variation existing in wild species remains largely underexploited.
Wild relatives represent an important source of genes that has been successfully tapped to improve
productiv-ity and adaptation in various crops [38-40]. Tanksleyet
al. [41] have proposed an efficient advanced
backcross-QTL (AB-backcross-QTL) approach to detect and map valuable QTLs and to simultaneously transfer them from wild to cultivated species. This approach has been widely adopted for mapping and introgressing QTLs involved in complex traits in several species [42].
QTL mapping in crosses between crops and their wild progenitors is also a powerful means for identifying genomic regions involved in morphological and physio-logical changes that distinguish crops from their wild
relatives [43]. These morphological and physiological differences that have resulted from plant evolution under anthropogenic influences have been included in a
generic term known as the “domestication syndrome”
[44,45]. Features of the domestication syndrome have been shared in almost all agronomically important domesticated species. The targets of domestication include the loss of mechanisms for seed dispersal and dormancy, changes in plant growth habits and increases in the size of harvested plant parts [46-48]. Although pod dehiscence is absent in peanut, the long peg and isthmus observed solely in wild species have been identi-fied as a potential mechanism for seed dispersal [49]. In cultivated peanut pods, the isthmus is virtually nonexis-tent and has given way to a more or less deep pod con-striction that may represent a vestige of the isthmus. Cultivated peanut also displays a more compact growth habit compared to wild species. However a large range of variation still exists in cultivated species. Varieties
belonging to subspeciesfastigiata are characterized by
an erect growth habit accompanied by traits such as loss of pod constriction and of seed dormancy. Prostrate growth habits are generally accompanied by small fruits with marked constriction and seeds demonstrating dor-mancy. These characters, which could be considered pri-mitive, are mainly found in varieties belonging to the
hypogaeasubspecies [50].
Notwithstanding the identification of the two most probable wild progenitors of cultivated peanut, little is known about peanut evolution under domestication, and the genomic regions associated with domestication have never been reported. We recently published an SSR-based genetic map constructed using a BC1F1 population derived from a cross between the
amphidi-ploid (A. ipaensis ×A. duranensis)x4 and a cultivated
peanut variety, and an analysis of the genome-wide
introgression of wild DNA fragments in the BC2F1
gen-eration [51]. As a follow-up to this study, we have pro-duced an AB-QTL population that represents a great opportunity to map QTLs involved in peanut domestica-tion and to explore the reservoir of agronomically inter-esting alleles remaining in the wild species. As peanut is mainly grown under rainfed conditions in the arid and semi-arid tropics, it often faces moderate to severe drought conditions [52,53]. An important breeding objective is thus to develop varieties that can produce suitable yields under water-limited conditions.
process and we compare the distribution of QTLs in the subgenomes.
Methods
Population development
A population of 142 plants (87 BC3F1 and 55 BC2F2)
was produced using 44 BC2F1 plants derived from the
cross between the cultivated Fleur11 variety, used as
recurrent parent, and the amphidiploid AiAd (A.
ipaen-sis KG30076 × A.duranensis V14167)x4 [29], used as
donor parent. Fleur11, a local peanut variety grown in Senegal, is a Spanish type with an erect growth habit, low to moderate pod constriction, short cycle (90 days), high yielding, and tolerance to drought. The population was produced in greenhouse conditions at the Centre
d’Etude Regional pour l’Amélioration de l’Adaptation à
la Sécheresse (CERAAS), Thiès, Senegal. The breeding
scheme for producing BC2F1 individuals has been
described previously [51]. Each of the 44 BC2F1
indivi-duals used as female parent was: i) backcrossed with Fleur11 and ii) allowed to self-pollinate. A total of 565 seeds were harvested and sown individually in large deep pots in the greenhouse. DNA was extracted from
young seedlings and BC3F1 individuals were
differen-tiated from BC2F2 individuals using 115 SSR markers
that produced a total of 147 mapped loci. These loci were chosen to offer regular coverage of the genetic
map produced previously [51]. All BC3F1 and BC2F2
individuals were allowed to self-pollinate to produce
BC3F2 and BC2F3 families that were then used for the
phenotyping experiment. The choice of the 142
indivi-duals (i.e. 87 BC3F1 and 55 BC2F2) retained as the final
population was based on two criteria: i) maximization of donor allele frequencies in heterozygous or homozygous situations at each of the 147 loci, and (ii) the number of
seeds produced per BC3F1and BC2F2 individual, which
can be a strongly limiting factor in peanut.
Field preparation
The experiment was conducted in the field from Sep-tember to December 2009 at the Centre National de Recherche Agronomique (CNRA) in Bambey (14.42° N and 16.28W°), Senegal. In this research station, the soil is ferruginous, with 90% sand content, and low clay con-tent (3-6%). Forty-five days before sowing, the field was plowed to eliminate weeds. One hundred and fifty kg/ha of organic fertilizer and 1 t/ha of mineral fertilizer (6-20-10) were added 4 weeks and 3 days before sowing, respectively. The field was kept manually weed-free before sowing and throughout the experiment.
Experimental design
The 142 backcross families (BC3F2 and BC2F3) and the
Fleur11 parent were tested under two water regimes:
well-watered and water-limited. For each water regime, an alpha-lattice experimental design was used with two replications and nine blocks per replication. The blocks contained 16 rows, 3 m each. The individuals were arranged in rows of 10 plants. The spacing was 30 cm between plants and 50 cm between rows. Due to the limited number of seeds per BC family, one seed per hill was sown at 4 cm depth. Before sowing, the seeds were treated with Granox (captafol 10%, benomyl 10%, carbo-furan 20%) to protect them from insects and diseases.
Water management
In the geographical area of the Bambey research station, the rainy season lasts about 3 months, from early July to
late September. The experiment was sown on 16th
Sep-tember 2009. In both treatments (well-watered, water-limited), the total amount of water (rainfall + additional irrigation) received from the sowing date to 43 days after sowing (DAS) was 184 mm. After this date, corre-sponding to the pod filling stage, stress was applied in the water-limited treatment by withholding irrigation until 84 DAS, representing a total stress duration of 40 days. Irrigation was restarted from 84 DAS to harvest (95 DAS) and 21 mm of water was added. The total amount of water received in the water-limited treatment was 205 mm. In the well-watered treatment, irrigation was continued throughout the experiment until harvest, with 315 mm of water applied overall.
Soil moisture status
The soil volumetric water content was measured every 4 days to a depth of 1 m at 10 cm intervals, from the sow-ing date to the end of the stress (84 DAS) in both treat-ments using a Diviner 2000 capacitance profile probe (Sentek Environmental Technologies, Stepney, Austra-lia). In each treatment, the measurements of 12 access tubes were averaged. The access tubes were randomly scattered in the treatment plots. Variations in the soil water availability at each depth from 10 cm to 1 m was expressed as a fraction of transpirable soil water (FTSW) using the following formula:
FTSW(%) = (SWCERD− SWCPWP)/(SWCFC− SWCPWP)
where SWCERD, SWCPWPand SWCFC correspond to
the soil water content at effective rooting depth, perma-nent wilting point, and field capacity, respectively [54]. The field capacity value was obtained from a previous study carried out in Bambey [55].
Trait evaluation
after sowing and exposed to ambient temperature (30-35°C) for 1 month to allow complete drying of haulms and pods. A total of 27 traits (Table 1) were evaluated
in BC3F2 and BC2F3 families under one or two water
regimes. The phenotypic value of each trait for each
BC3F1 and BC2F2 individual was obtained by averaging
the values of the corresponding BC3F2 and BC2F3
families. The trait values were then expressed on a per plant basis. As indicated above, due to the limitation in the seed number, one seed per hill was sown. The traits were thus evaluated on a minimum of 3 to a maximum of 10 plants (mean 8.5 plants) per family and per repli-cation. Details on the trait measurements are given below.
Days to flowering
The number of days from sowing to flowering (DFL)
was evaluated on the basis of the first flower appearance date.
Plant architecture
The plant growth habit (GH) and main stem height
(PH) were recorded in the well-watered conditions at
the podding stage and 60 days after sowing, respectively. The plant growth habit was recorded on a 1-6 scale using the descriptors for groundnut [56] where, 1 = pro-cumbent 1, 2 = propro-cumbent 2, 3 = depro-cumbent 1, 4 = decumbent 2, 5 = decumbent 3, and 6 = erect. The main stem height was measured from the cotyledonary axil up to the terminal bud.
Pod morphology
Pod beak (PB), constriction (PC), length (PL) and width
(PWI) were evaluated on 30 pods. All traits were
mea-sured in the two water regimes, except for pod constric-tion, which was measured in the well-watered condition only. Pod beak and constriction were recorded on a 0-9 scale according to the descriptors for groundnut. Pod length and width were measured using a caliper with a digital display.
Seed morphology
Seed length (SL) and width (SWI) were evaluated on 30
seeds in the two water regimes using a caliper with a digital display.
Yield components
The yield components were determined in the two water regimes based on the pod, haulm and seed dry mass. The total biomass was first weighed to determine
the total biomass per plant (TB). The pods were
removed and weighed to determine the total pod weight
per plant (PW). The haulm weight per plant (HW) was
calculated as the difference between the total biomass and the total pod weight. The total number of pods per
plant (PN) was determined and 100 pods were
ran-domly sampled and weighed (HPW). The 100 pods
were shelled and mature pods with a dark internal
peri-carp color were counted (PMAT). All seeds contained
in the 100 pods were weighed and mature seeds were separated from immature seeds and counted. The
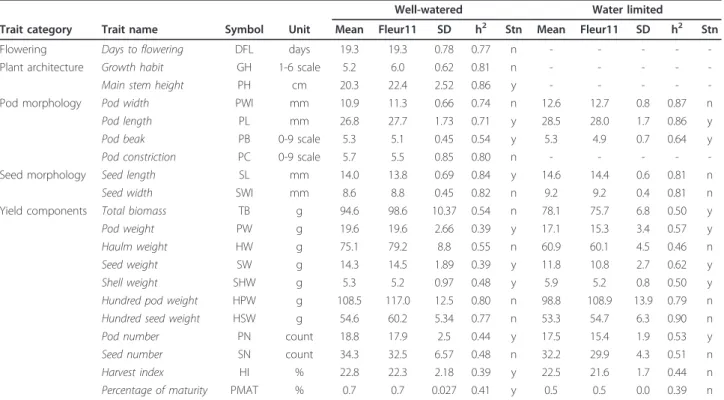
Table 1 List of traits and descriptive statistics in well-watered and water limited treatments
Well-watered Water limited
Trait category Trait name Symbol Unit Mean Fleur11 SD h2 Stn Mean Fleur11 SD h2 Stn
Flowering Days to flowering DFL days 19.3 19.3 0.78 0.77 n - - - -
-Plant architecture Growth habit GH 1-6 scale 5.2 6.0 0.62 0.81 n - - - -
-Main stem height PH cm 20.3 22.4 2.52 0.86 y - - - -
-Pod morphology Pod width PWI mm 10.9 11.3 0.66 0.74 n 12.6 12.7 0.8 0.87 n
Pod length PL mm 26.8 27.7 1.73 0.71 y 28.5 28.0 1.7 0.86 y
Pod beak PB 0-9 scale 5.3 5.1 0.45 0.54 y 5.3 4.9 0.7 0.64 y
Pod constriction PC 0-9 scale 5.7 5.5 0.85 0.80 n - - - -
-Seed morphology Seed length SL mm 14.0 13.8 0.69 0.84 y 14.6 14.4 0.6 0.81 n
Seed width SWI mm 8.6 8.8 0.45 0.82 n 9.2 9.2 0.4 0.81 n
Yield components Total biomass TB g 94.6 98.6 10.37 0.54 n 78.1 75.7 6.8 0.50 y
Pod weight PW g 19.6 19.6 2.66 0.39 y 17.1 15.3 3.4 0.57 y
Haulm weight HW g 75.1 79.2 8.8 0.55 n 60.9 60.1 4.5 0.46 n
Seed weight SW g 14.3 14.5 1.89 0.39 y 11.8 10.8 2.7 0.62 y
Shell weight SHW g 5.3 5.2 0.97 0.48 y 5.9 5.2 0.8 0.50 y
Hundred pod weight HPW g 108.5 117.0 12.5 0.80 n 98.8 108.9 13.9 0.79 n Hundred seed weight HSW g 54.6 60.2 5.34 0.77 n 53.3 54.7 6.3 0.90 n
Pod number PN count 18.8 17.9 2.5 0.44 y 17.5 15.4 1.9 0.53 y
Seed number SN count 34.3 32.5 6.57 0.48 n 32.2 29.9 4.3 0.51 n
Harvest index HI % 22.8 22.3 2.18 0.39 y 22.5 21.6 1.7 0.44 n
Percentage of maturity PMAT % 0.7 0.7 0.027 0.41 y 0.5 0.5 0.0 0.39 n
weight of 100 seeds (HSW) was calculated as the weight
of mature seeds divided by the number of mature seeds
multiplied by 100. The total seed weight per plant (SW)
and the total number of mature seeds per plant (SN)
were estimated based on the total number of pods (PN), the number of mature seeds in 100 pods (NMSH) and the weight of seeds in 100 pods (SWH):
SW=SWH/100
∗PNandSN=NMSH/100
∗PN.
The shell weight (SHW) was computed as the
differ-ence between the 100 pod weight and the 100 seed weight relative to the total number of pods per plant:
SHW=(HPW−HSW)/100
∗PN
The harvest index (HI) was calculated as a percentage
of the pod weight to the total biomass.
Stress tolerance indices (STI) were calculated for the
pod number (STI-PN), seed number (STI-SN), 100 pod
weight (STI-HPW), 100 seed weight (STI-HSW), pod
weight (STI-PW), seed weight (STI-SW), haulm weight
(STI-HW) and total biomass (STI-TB) using the
follow-ing formula:
STI= (Yis∗Yiw)/(Ym˜ )2
with Yis = phenotype value of individual (i) for a given trait in the stressed condition, Yiw = phenotype value individual (i) for a given trait in the well-watered
condi-tion and Ỹm = trait mean of all genotypes in the
well-watered condition [57].
Statistical analysis
Qualitative data such as the plant growth habit (GH), pod constriction (PC) and beak (PB) were first trans-formed to quantitative data using the ratio of the fre-quency of a phenotypic class by the total number of observations. All statistical analyses were performed using the R statistical programming language [58]. Basic statistical analyses (mean and standard deviation) were calculated for each trait. The data normality was checked with the Shapiro test for normality. An analysis of variance (ANOVA) was performed to estimate the genetic and replication effects on each trait under each water treatment. This was done following a standard lin-ear model with genotype, replication, block and interac-tion effects, as
Yijk=µ+Gi+ rj+ bjk+ eijk
with Yijk = observed value for a given trait,μ= mean
of the population, Gi= genotype effect, rj= replication
effect, bjk = block within replication effect and eijk =
residual error. In addition, a combined analysis of var-iance for the two water regimes was performed
following a standard procedure of a fixed model with genotype, water regime, replication, and block and inter-action effects, as
Yijkl=µ + Gi+ Wj+ rjk+ bjkl+ Gi*Wj+ eijkl
with Yijkl = observed value for a given trait,μ= mean
of the population, Gi = genotype effect, Wj = water
regime effect, rjk = replication within water regime
effect, bjkl= block within replication and water regime
effect, Gi*Wj= genotype × water regime interaction and
eijkl= residual error.
Estimates of broad-sense heritability were calculated as
h2b= σ2G/σ2G+σ2Ewithσ2G= (MSG−MSE)/r andσ2E= MSE
wheres2 Gis the genotypic variation,s2Ethe residual
variation, MSG and MSE the genetic and residual mean
squares and r the number of replications.
Data for each water regime were analysed using a lin-ear mixed model fitted with the R/lme4 software pack-age. In the model, we considered replications and blocks within replications as fixed effects and genotypes as ran-dom effects. Best linear unbiased predictors (BLUP) were extracted from this model for each genotype and trait and used for the QTL analyses.
Molecular analysis and QTL identification
A genetic map that had been previously produced [51] was used for the QTL analysis. A framework map of 147 loci covering all LG with one locus every 12 cM was derived from this map. These markers were used to genotype the 142 individuals of the population. Interspe-cific advanced backcross populations (BC2F2, BC3F1) carry the risk of a low frequency of the wild donor allele at some loci. To overcome this situation, we checked the genotypic composition of the population at each marker and assessed the number of individuals in each genotypic class (i.e. homozygous for the recurrent ent, heterozygous and homozygous for the donor par-ent). For some loci, the number of individuals homozygous for the donor parent was below 5. Geno-types at these markers were replaced by missing data. For the QTL identification, standard interval mapping (SIM) was performed with the Haley-Knott regression method using the R/qtl package [59]. Because of the specific family structure of our advanced backcross
population, individuals in generation BC3F1 and BC2F2
were considered separately to calculate the genotypic probabilities at each 1 cM interval using the MDM and GRAFGEN softwares [60], taking the generation and the genotype observed at the flanking markers into accounts. The genotypic probabilities of both genera-tions were then combined and the resulting file was
imported into R/qtl. QTL detection for each trait and treatment, was performed using the following model:
y =µ +βx +αz1+δz2+ε
where, y is the observed phenotype,μthe mean of the
population,aandδthe additive and dominance effects
of the putative QTL, respectively, z1 and z2 are the
probabilities for QTL genotypes conditional to the
flanking marker genotypes, bx the BC2F1family
covari-ate effect (44 levels), andεthe residual error.
A two-dimensional two-QTL genome scan method was also used to test for the presence of two QTLs in the same linkage group. This was applied in some parti-cular cases when the LOD curve of the single QTL gen-ome scan method displayed two distinct LOD peaks for a given linkage group. A LOD threshold value to indi-cate a significant QTL effect was determined for each trait using 1000 permutations with a genome-wise
sig-nificance level ofa = 5% [61]. The confidence interval
estimates of the QTL location were obtained using the 1.5-LOD support interval method [62]. The proportion
of phenotypic variance (R2) explained by each QTL was
obtained by fitting a model including the QTL and the
BC2F1 family covariate. The proportion of phenotypic
variance (R2) explained by all detected QTLs for a given
trait was obtained by fitting a model including all
detected QTLs and the BC2F1 family covariate.
Chi-square tests were used to assess whether the QTL num-ber between subgenomes and distribution between homeologous LG fitted a 1:1 ratio. The graphical repre-sentation of the QTLs was obtained using Spidermap software (Rami, unpublished).
Results
Soil moisture status and stress intensity
The soil moisture measurement results showed that the calculated FTSW values were maintained between 0.80 and 0.50 in the well-watered treatment (Additional file 1, Figure S1). This range of FTSW is generally consid-ered sufficient to keep plants out of stress [63]. In the water-limited treatment the FTSW values decreased gra-dually from 0.8 at 43 DAS to 0.15 at 84 DAS. We have divided this period in three different stress intensity levels -low, moderate and severe- (indicated in Addi-tional file 1, Figure S1) corresponding to peanut repro-ductive stages R5-R6, R6-R7 and R7-R8 respectively, as described by Boote [64]. Moderate stress occurred from the end of seed formation to the beginning of pod maturity (R6-R7) and severe stress occurred from the beginning of pod maturity to harvest maturity (R7-R8). These intensity levels were characterized by the wilting of plants in the afternoon for the moderate stress
conditions, and at mid-morning for the severe stress conditions.
Trait variability and heritability
The phenotypic values were normally distributed for most of traits in both conditions (Additional file 2, Fig-ure S2). The population mean for each trait in each condition tended to be skewed towards the phenotypic value of the recurrent Fleur11 parent (Table 1). A small range of variation (4 days) was observed for DFL, with values ranging from 18 to 21 days after sowing. Conver-sely, a high level of variability was observed for the mor-phological traits. The plant growth habit (GH) showed a wide range of morphologies, ranging from completely prostrate to totally erect. A similar range of variation was observed for PB and PC, i.e. from inexistent to very prominent and from inexistent to very deep, respec-tively. A wide range of variation was also observed for the yield component traits (Table 1). In general, geno-types that out-performed the recurrent parent in terms of pod and seed number had smaller pods and seeds. However, we observed some genotypes that had a better performance than the cultivated parent in terms of number of pods, while keeping a similar 100-seed weight. Transgressive segregation was not observed for HSW, for which the best genotypes were similar to the recurrent parent.
The comparison between the two water treatments showed that water stress had a negative impact on the R6-R8 developmental stages, corresponding to grain fill-ing and pod maturity. SW and PMAT were conse-quently the most affected traits, with a population average reduction of 21.0% and 18.9%, respectively. Water stress also negatively affected TB, PW and HW, with reductions of 17.4%, 12.8% and 17.2%, respectively, and to a lesser extent HPW, HSW, PN and SN, with reductions of 8.9%, 2.4%, 6.8% and 6.0%, respectively. The harvest index values were similar in the two conditions.
The analyses of variance showed significant differences
(P≤ 0.001) between genotypes for each trait in the two
treatment interaction (P ≤0.05) for a few traits, includ-ing PW, SN, SHW and PMAT (data not shown).
Correlation between traits
The phenotypic correlations between traits in the well-watered and water-limited treatments are shown in Table 2. The same trend was observed in the two water treatments. The highest values (up to 0.80) were obtained between TB and HW, between PW, PN, SN and SHW, and between HSW and HPW. HI was nega-tively correlated with HW but posinega-tively correlated with PW, PN, SW, SN and PMAT. The phenotypic correla-tions between pod and seed morphology related traits, and HSW and HPW ranged from 0.23 to 0.95. The highest correlations were obtained between SWI, HSW and HPW (Table 2). The main stem height (PH) was positively correlated with almost all traits.
QTL identification
A summary of QTLs detected in the two water regimes is provided in Table 3. At least one QTL was detected for each of the 27 traits analyzed, with a total of 95 QTLs mapped in the two environments (Figure 1).
Days to flowering
One QTL for DFL detected on LG b07, explained 9.3% of the phenotypic variance (Figure 1). Interestingly, the flowering precocity was associated with the allele of the wild amphidiploid parent.
Plant architecture
A total of 11 QTLs, explaining individually 9.8% to 26.0% of the phenotypic variance, were involved in the variation of the plant architecture (Table 3). Five QTLs located on LGs a04, a07, b04, b08 and b10 were detected for PH. Fleur 11 alleles at QTLs on LGs b04, a07, b08 and b10 tended to increase the PH, but on LG a04 the PH increase was associated with the amphidi-ploid allele. The five QTLs together explained 40.9% of the phenotypic variance. Interestingly, two QTLs were located on homeologous regions on LGs a04 and b04 but the parental origin of the associated allele at these two QTLs differed (Figure 1). Six QTLs located on LGs a03, a07, b04, b05, b06, and b10 were detected for GH. At the QTLs for GH, all alleles conferring an erect growth habit phenotype were from Fleur11. Overall, they explained 46.1% of the phenotypic variance. We found a colocalization of QTLs for PH and GH in three regions on LGs b04, a07 and b10.
Pod morphology
A total of 31 QTLs were detected for traits related to pod morphology when considering the two water treat-ments. These QTLs individually explained 8.5% to 23.9% of the phenotypic variance (Table 3). Among the 10 QTLs detected for PB, six QTLs located on LG a02, b06 and a07 were detected in the two conditions, three on LGs a08, a09 and b11 were specific to the well-watered treatment and one on LG b02 was specific to the
water-Table 2 Phenotypic correlations between traits in well-watered (bottom left half) and water limited (upper right half) TB PW HW PN SW HSW HPW SN SHW PWI PL PB PC SWI SL HI GH PH PMAT DFL
TB 0.56 0.74 0.92 0.66 0.69 0.24 0.33 0.65 0.79 0.20 0.28 0.18 - 0.16 ns ns - - ns
-PW 0.70 0.48 0.42 0.87 0.99 0.24 0.44 0.87 0.90 0.12 0.12 ns - 0.16 ns 0.61 - - 0.24
-HW 0.95 0.45 0.58 0.39 0.37 0.19 0.19 0.39 0.56 0.20 0.31 0.19 - 0.12 ns -0.42 - - -0.15
-PN 0.58 0.88 0.36 0.53 0.87 -0.15 ns 0.88 0.75 -0.19 ns ns - -0.17 -0.16 0.53 - - 0.22
-SW 0.67 0.97 0.43 0.87 0.53 0.19 0.44 0.87 0.82 ns ns ns - 0.12 ns 0.64 - - 0.34
-HSW 0.23 0.21 0.20 -0.17 0.18 0.83 0.72 ns 0.36 0.66 0.51 ns - 0.77 0.61 ns - - -0.16
-HPW 0.35 0.40 0.26 ns 0.38 0.80 0.75 0.20 0.44 0.54 0.35 ns - 0.58 0.37 0.27 - - 0.24
-SN 0.59 0.84 0.37 0.89 0.84 -0.16 ns 0.46 0.75 ns ns ns - ns -0.14 0.52 - - ns
-SHW 0.69 0.91 0.47 0.77 0.82 0.27 0.41 0.73 0.46 0.31 0.29 0.13 - 0.26 0.18 0.40 - - ns
-PWI 0.19 0.16 0.17 ns ns 0.58 0.55 ns 0.27 0.77 0.26 ns - 0.72 0.29 ns - - -0.32
-PL 0.22 0.15 0.21 ns 0.12 0.43 0.41 ns 0.26 0.23 0.76 ns - 0.25 0.67 -0.13 - - -0.18
-PB ns ns ns ns ns -0.13 -0.15 ns ns -0.20 0.20 0.60 - ns ns ns - - ns
-PC ns ns 0.13 ns ns ns ns ns ns -0.12 0.37 0.39 - - -
-SWI 0.15 0.15 0.13 -0.20 ns 0.79 0.72 -0.12 0.26 0.69 0.31 -0.14 ns 0.81 0.46 ns - - -0.18
-SL 0.16 ns 0.17 -0.18 ns 0.58 0.47 -0.16 0.24 0.29 0.64 0.23 0.42 0.52 0.82 ns - - -0.12
-HI -0.22 0.51 -0.49 0.49 0.52 ns 0.15 0.43 0.39 ns ns -0.12 -0.17 ns -0.12 0.42 - - 0.38
-GH ns -0.23 ns -0.31 -0.20 ns ns -0.28 -0.24 ns ns ns 0.12 ns ns -0.23 - - -
-PH 0.46 0.35 0.42 0.23 0.33 0.17 0.29 0.25 0.34 0.17 0.18 ns 0.14 0.14 ns ns 0.42 - -
-PMAT ns 0.15 ns 0.15 0.20 ns ns -0.14 ns -0.25 -0.21 ns ns -0.17 -0.20 0.27 0.12 0.12 0.28
-DFL ns ns ns ns ns ns ns ns ns ns ns ns ns ns ns ns ns -0.15 ns
Table 3 Characteristics of the QTLs detected for all traits in the two water treatments.
Well-watered Water-limited
Trait Category Trait Symbol
L. G.
Closest Marker
Pos. Conf. Int.
Lod Add. R2 Closest
Marker
Pos. Conf. Int.
Lod Add. R2
Flowering DFL b07 Seq15C10_B 38 21-79 3.01 -0.74 9.3 . . . .
Plant architecture GH a03 Seq19H03_A1 7.9 2-15 4.29 -1.19 14.1 . . . .
a07 TC9H08_A 50 33-58 5.56 -0.16 17.3 . . . .
b04 gi-0832_B 77.2 66.2-77.2 4.61 -0.71 14.1 . . . .
b05 TC19D09_B 0 0-7 5.27 -0.25 16.2 . . . .
b06 TC3H07_B 19 7-34 4.64 -0.46 13.9 . . . .
b10 TC22G05_B 0 0-9 4.17 -0.48 9.8 . . . .
PH a04 TC9E08_A1 93 44-108 2.97 2.15 9.3 . . . .
a07 TC9H08_A 53 35-63 9.37 -0.94 26.7 . . . .
b04 gi-0832_B 77.2 61.6-77.2 4.82 -2.97 14.7 . . . .
b08 AC2C12_B 17.1 12-22.8 4.41 -2.56 13.8 . . . .
b10 TC22G05_B 0 0-16 4.2 -0.66 10.0 . . . .
Pod morphology PB a02 RM2H10_A 62 43-68 3.93 0.22 8.5 seq11H01_A 15 1-65 4.33 0.28 12.6
a07 TC38F01_A 99 82-107.1 6.14 0.16 17.4 TC6G09_A 102 2-107 5.38 0.42 15.4
a08 RM5G08_A 44.7 29.7-62.7 5.05 0.34 13.1 . . . .
a09 RN25B01_A 67.5 55.5-88.5 4.14 0.35 11.6 . . . .
b06 TC19F05_B 50 14-80 4.35 -0.08 13.5 TC3H07_B 21.7 13-87 4.28 -0.56 12.5
b11 TC2A02_B 9 0-13 4.16 0.45 12.7 . . . .
b02 . . . TC1B02_B 5.9 0-32.9 4.04 0.30 11.8
PC a02 RM2H10_A 64 43-68 8.31 1.05 23.9 . . . .
a07 RN13D04_A 0 0-107.1 3.2 -0.69 10.0 . . . .
a07 TC38F01_A 98 88-106 3.2 0.72 9.8 . . . .
a08 TC1E05_A 93.7 81.7-96.1 6.39 0.61 19.0 . . . .
a09 RN25B01_A 70.5 64.5-86.5 8.19 1.10 23.6 . . . .
a10 AC2B03_A 25.6 21-81.3 4.9 -0.75 14.9 . . . .
b11 TC2A02_B 8.2 3-12 4.49 0.85 13.7 . . . .
PL a07 RN13D04_A 0 0-7 2.97 -1.25 8.0 . . . .
a08 . . . TC1E05_A 90.3 81.7-96.1 4.34 1.29 12.0
a09 . . . TC9B07_A 17.5 9.5-71.5 6.16 2.09 16.5
PWI a07 seq2E06_A 7 2-107.1 4.16 -0.57 12.2 seq2E06_A 6 2-12 7.39 -0.86 21.1
a08 RM5G08_A 43.7 30.7-62.7 4.63 -0.77 14.4 . . . .
a10 TC11B04_A2 52 37-67 3.13 0.48 8.1 TC11B04_A2 50 40-63 5.12 0.41 15.1
b02 TC1B02_B 0 0-8.9 7.35 -0.65 20.1 TC1B02_B 0 0-8.9 7.07 -0.78 20.3
b05 TC19D09_B 8 0-43 4.39 -0.56 13.3 PM050_B 10 1-39 5.02 -0.89 14.9
b06 TC19F05_B 52 16-83 4.49 0.35 12.8 TC19F05_B 52 22-64 7.86 0.55 22.3
Seed morphology SL a07 RN13D04_A 0 0-5 4.47 -0.13 12.5 RN13D04_A 0 0-9 3.85 -0.27 11.1
a08 TC1E05_A 85.7 23.7-96.1 3.7 0.53 10.5 . . . .
a09 RN25B01_A 65.5 9.5-71.5 5.97 0.83 16.3 . . . .
SWI a07 seq2E06_A 5 2-10 8.62 -0.51 23.7 seq2E06_A 5 2-11 7.56 -0.46 20.7
a07 TC38F01_A 95 88-106 4.5 -0.46 8.7 TC38F01_A 95 88-106 5.1 -0.09 10.1
b02 TC1B02_B 0 0-7.9 4.88 -0.35 14.2 TC1B02_B 0 0-9.9 4.59 -0.37 13.1
b05 TC19D09_B 7 0-47.5 3.18 -0.32 9.5 seq19D06_B 35 4-46 3.81 -0.41 11.0
b06 . . . TC3H07_B 27 8-62 3.91 0.29 11.3
Yield components HI a02 RI2A06_A 75 67-76.1 4.18 -1.07 11.0 RI2A06_A 76.1 73-76.1 6.18 -1.77 18.1
HPW b02 TC1B02_B 0 0-10.9 5.5 -9.65 20.6 TC1B02_B 0 0-8.9 6.06 -12.38 17.0
b05 TC19D09_B 8 0-50 4.63 -14.90 15.1 PM050_B 7 0-52 5.27 -18.94 15.0
HSW a07 seq2E06_A 3.7 0-10 5.53 -4.11 15.7 seq2E06_A 6 0-12 4.42 -4.86 12.4
b02 TC1B02_B 0 0-7.9 5.72 -4.21 16.3 TC1B02_B 0 0-10.9 5.37 -5.64 14.9
limited treatment (Figure 1). Amphidiploid alleles at QTLs on LGs a02, a07, a08, a09, b02 and b11 tended to confer a prominent beak, while on LG b06 the increase in beak prominence was associated with the allele of Fleur11. Overall, QTLs for PB explained 42.8% and 38.2% of the phenotypic variance in the well-watered and water-limited treatments, respectively. Seven QTLs located on LGs a02, a07, a08, a09, a10 and b11 were detected for PC. Amphidiploid alleles at QTLs on LGs a02, a08, a09 and b11 were associated with the constric-tion depth. On LG a10 the constricted pod phenotype was associated with the Fleur11 allele. The two QTLs on LG a07 were in repulsion. Overall, QTLs involved in constriction depth explained 50.2% of the phenotypic variance. Among the 11 QTLs detected for PWI, 10 QTLs located on LGs a07, a10, b02, b05 and b06 were detected in the two water treatments and one on LG a08 was specific to the well-watered treatment (Figure 1). All QTLs explained 49.2% and 58.5% of the variation of this trait in the well-watered and water-limited treat-ments, respectively. Fleur11 alleles at QTLs on LGs a07, a08, b02, b05 were associated with the increase in pod width while on LGs a10 and b06 the pod width increase was associated with the amphidiploid alleles. Three QTLs were detected for PL. The Fleur11 allele at the QTL on LG a07, detected in the well-watered treatment
only, was associated with the increase in pod length. Amphidiploid alleles at QTLs on LG a08 and a09, detected in the water-limited treatment only, were responsible for the pod length increase.
Seed morphology
A total of 13 QTLs were detected for traits related to seed morphology when considering the two water treat-ments. These QTLs individually explained 8.7% to 23.0% of the phenotypic variance (Table 3). Among the nine QTLs detected for SWI, eight were detected in the two treatments, with four QTLs located on LG a07, two on LG b02 and two on LG b05. The QTL detected on LG b06 was specific to the water-limited treatment (Figure 1). Overall, these QTLs explained 38.6% and 55.5% of the phenotypic variation in the well-watered and water-limited treatments, respectively. Surprisingly, about half of the QTLs detected for SWI were distributed on LG a07, with two QTLs at a proximal position near the seq2E06_A locus and two at a distal position near the TC38F01_A locus. For QTLs on LGs a07, b02 and b05, the allele of Fleur11 conferred superior seed width in the two water treatments. The seed width increase at the QTL on LG b06 was associated with the amphidi-ploid allele. Four QTLs were detected for SL. Two QTLs located on LG a07 were detected in the two water treatments with the favourable alleles coming
Table 3 Characteristics of the QTLs detected for all traits in the two water treatments.(Continued)
a05 . . . gi-0385_A 21 0-32 5.94 4.72 17.5
b06 . . . Seq18G01_B 104 93-104.4 3.18 3.76 9.7
PMAT b03 PM003_B 28.1 27-48.6 3.44 0.01 9.3 . . . .
PN a01 TC2E05_A 4 0-26 3.03 1.96 9.3 TC19F05_B 44.9 27-92 4.11 -0.01 12.6
a05 gi-0385_A 17 1-34 4.88 2.00 14.2 TC2A02_B 11 2-15 3.1 0.02 9.6
PW a01 TC2E05_A 0 1-10 3.82 2.60 11.7 . . . .
SHW a01 TC2E05_A 0 0-9 3.87 0.92 12.6 . . . .
SN a05 gi-0385_A 15 0-30 4.8 7.88 14.5 . . . .
SW b05 TC19E01_B 49 6-57.9 3.58 -1.91 11.0 . . . .
TB a05 gi-0385_A 8 0-26 4.42 11.79 13.2 gi-0385_A 18 0-31 5.63 7.00 16.6
b06 . . . Seq18G01_B 104.4 93-104.4 3.39 5.64 11.0
Stress tolerance indices
STI-HPW b02 . . . TC1B02_B 0 1-8.9 6 -0.16 16.8
b05 . . . TC19D09_B 7 0-51 4.86 -0.27 13.9
STI-HSW a07 . . . seq2E06_A 5 0-11 5.64 -0.15 15.5
b02 . . . TC1B02_B 0 0-8.9 5.9 -0.16 16.2
STI-HW a02 . . . RI2A06_A 76 73-76.1 5.57 0.07 16.4
a05 . . . gi-0385_A 15 0-27 5.85 0.17 17.1
STI-PN a05 . . . gi-0385_A 22 4.6-33 6.6 0.19 19.4
a07 . . . RN13D04_A 0 0-13 3.38 0.16 10.4
STI-PW a05 . . . gi-0385_A 18 0-33 4.14 0.16 12.3
STI-SN a07 . . . RN13D04_A 0 0-21 3.57 0.22 11.0
STI-SW a05 . . . gi-0385_A 19 0-34 3.78 0.13 11.5
STI-TB a05 . . . gi-0385_A 15 0-27 7 0.17 20.1
!" # ! ! " ! # # $ ! $ " ! # $" $ $%" " !" ! $%" # " ! ! # !" $%" ! ! $%" $%" $%" !" !" ! # !" $ ! " %% &'() %%% &'() %%% &'() $%& &'() $%% &'() %%& &'() %%% &'() %& &'() %% &'() %% &'() $% &'() #%% &'() %% &'() %%& &'() %% &'() %% &'() $% &'() $ &'() $ % &'() $% &'() $ &'() %& &'() %% &'() %%& &'() %%% &'() %%& &'() %%% &'() %& &'() %$%& &'() %$%% &'() $ % &'() $% &'() %$%& &'() %$%% &'() ! %% &'() #%% &'() %% &'() #%% &'() %%& &'() %%% &'() %$%& &'() %$%% &'() $ % &'() %%% &'() %$%& &'() %$%% &'() ! # $%" $ ! # ! # ! # & " $ ! $ ! & $ ! $ ! ! $ ! ! ! $%" % $%" &* # " " # ! " #%% &'() %%& &'() %%% &'() %& &'() %% &'() %% &'() %% &'() %% &'() &%% &'() %$%& &'() %$%% &'() &%& &'() &%% &'() $% &'() $ &'() $ &'() %$%& &'() %$%& &'() %$%% &'() %$%% &'() %% &'() %% &'() &%& &'() %$%% &'() &%% &'() %% &'() %% &'() &%& &'() &%% &'() %% &'() %$%& &'() %$%% &'() #%% &'() %%& &'() %& &'() %% &'() ! %& &'() %$%& &'() %$%% &'() $ &'() %$%& &'() %& &'() "& &'() %% &'() #%% &'() %% &'() %% &'() %% &'() ! %& &'()
from Fleur11, while two QTLs located on LG a08 and a09 were specific to the well-watered treatment with the favourable alleles coming from the amphidiploid.
Yield components
A total of 26 QTLs explaining 9.2% to 20.6% of the phe-notypic variance were detected for the 11 yield compo-nent traits in the two water treatments (Table 3). The number of QTLs per yield component trait ranged from one to five. Among the three QTLs significant for TB, two QTLs located on LG a05 were detected in both water treatments and one on LG b06 was specific to the water-limited treatment (Figure 1). At all these QTLs, the TB increase was associated with the amphidiploid alleles. One QTL for PW and one for SW were detected on LGs a01 and b05, respectively, in the well-watered condition. The wild allele at the QTL for PW conferred an increase in pod weight of 2.6 g per plant. For SW, the positive effect was associated with the allele of Fleur11. Four QTLs were detected for HW: two on LG a02 which were consistent across water treatments, and two on LGs a05 and b06, which were specific to the water-limited treatment. At all these QTLs, the HW increase was associated with the amphidiploid alleles. Interestingly, QTLs for HW on LGs a05 and b06 were located in the same genomic regions as those for TB, suggesting that the increase in TB could be explained by the increase in HW. QTLs for HI detected on LG a02 were detected in the two water treatments and were associated with the alleles of Fleur 11. Two QTLs located on LGs a01 and a05 for PN and one on LG a05 for SN were specific to the well-watered treatment. On LG a01, a QTL for PN colocalized with the one for PW, and on LG a05 a QTL for SN colocalized with the one for PN (Figure 1). Wild alleles at QTLs for PN and SN were responsible for an increase in pod and seed num-ber per plant, respectively. Four QTLs were detected for HSW and four for HPW. QTLs for HSW on LGs a07 and b02 and those for HPW on LGs b02 and b05 were consistent across water treatments. QTLs for HSW and for HPW explained about 35.6% and 42.3% of phenoty-pic variance, respectively, in both conditions, and the positive effects were associated with the allele of Fleur11. One QTL was detected for SHW and coloca-lized with QTLs for PW and SN on LG a01. The amphi-diploid allele at this QTL was associated with the increase in SHW. The three QTLs that conferred an increase in the percentage of pod maturity (PMAT) were detected on LG b03 in the well-watered treatment, and on LGs b06 and b11 in the water-limited treatment. The positive effects at QTLs on LGs b03 and b11 were associated with the amphidiploid alleles, while the posi-tive effect at the QTL on LG b06 was associated with the Fleur11 allele.
QTLs related to stress tolerance indices
A total of 13 QTLs were significant for the stress toler-ance indices (STI): two for total biomass (STI-TB) on LGs b06 and a05, one for pod weight (STI-PW) on LG a05, one for seed weight (STI-SW) on LG a05, two for haulm weight (STI-HW) on LGs a02 and a05, two for 100 pod weight (STI-HPW) on LGs b02 and b05, two for 100 seed weight (STI-HSW) on LGs a07 and b02, two for pod number (STI-PN) on LG a05 and a07 and one for seed number (STI-SN) on LG a07. These QTLs individually explained 10.4% to 20.1% of the phenotypic variance (Table 3). In most cases, the STI related QTLs colocalized with the trait for which they were calculated. Some exceptions included QTLs for STI-PW, STI-PN and STI-SN on LG a05 and LG a07, respectively, where no QTLs for PW, PN and SN were apparently detected (Figure 1). The positive effects for QTLs for STI-HPW and STI-HSW were associated with Fleur11 alleles. For the other STI related QTLs, the positive effects were associated with the amphidiploid alleles.
Subgenomic distribution of QTLs
When taking the two water regimes into account, the number of QTLs per trait and per LG varied from 1 to 11 and from 0 to 20, respectively. We did not detect QTLs on LG a06, b01 and b09. A total of 55 QTLs were mapped on LGs belonging to the A genome, with a maximum of 20 QTLs on LG a07. For LGs belonging to the B genome, a total of 40 QTLs were detected with a maximum of 11 QTLs on LGs b02 and b06. The number of QTLs detected per trait category and per genome is shown in Figure 2. The number of QTLs mapped on subgenomes (40 for the B genome versus 55 for the A genome) was not signifi-cantly different (P = 0.12). We found a subgenome specific QTL contribution for some traits, including PL and SL for which QTLs were detected only on the A genome (LGs a07, a08 and a09), and DFL, PMAT and HPW for which QTLs were detected only on the B genome (b02, b03, b05, b06, b07, b11). We found a significant difference in QTL distribution (P > 0.001) between homeologous LG. The most compelling examples were the difference in QTL number between homeologous LGs a06 and b06 (0 versus 11), and between homeologous LGs a07 and b07 (20 ver-sus 1)(Figure 1). Furthermore, apart from QTLs for PB and PH that mapped to homeologous regions on LGs a02/ b02 and a04/b04, all other QTLs for a given trait mapped to different homeologous LGs, thus indicating a marked inconsistency in QTL locations between homeologous LGs.
Discussion
the amphidiploid betweenA. ipaensisand A. duranensis, which represent the most probable wild progenitors of allotetraploid cultivated species [24,27-29]. This material enabled us to map several QTLs for important agrono-mical traits under two water regimes, to explore the reservoir of useful alleles from the wild species, analyze the subgenome contribution to the quantitative trait var-iation and identify chromosomal regions associated with domestication.
Peanut wild relatives represent a reservoir of useful alleles for peanut improvement
Peanut wild relatives have long been used as an impor-tant reservoir of disease resistance genes. Introgression of disease resistance genes into cultivated species using direct wild diploid × cultivated or via wild amphidiploid × cultivated crosses has been successfully used in peanut improvement [65-67]. However, the use of peanut wild relatives to dissect the molecular basis of more complex traits such as yield under both normal and water limited conditions has been impeded by the lack of molecular and mapping population resources.
In our study, we used an AB-QTL mapping approach to evaluate the genetic potential of wild species to enhance important agronomical traits in cultivated pea-nut. We detected 95 QTLs under the two water regimes. About half of the QTL positive effects were associated with amphidiploid alleles. These QTLs, which explained a large part of the phenotypic variance, contributed
positively to valuable agronomic traits such as flowering precocity (9.0%), pod weight per plant (11.7%), pod number per plant (9.0% to 14.2%), seed number per plant (14.4%), pod size (8.0% to 22.0%), seed size (11.3%), pod maturity (9.5%) and biomass production (9.0% to 17.0%). Several QTLs involved in the increase in pod and seed size, pod maturity and biomass produc-tion were specific to the water-limited treatment.
We observed high consistency of QTLs across water treatments. For example, among the 25 QTLs for pod and seed sizes and yield components, 17 QTLs (68.0%) were consistent in terms of genomic location across water treatments. The stability of QTLs across the water treatments may be explained by the late occurrence of severe stress during the experiment, which led to low G × E and thus QTL × E interactions. However, the term-inal stress in our experiment is representative of the most common drought events in the Sahel [54,68].
We used stress tolerance indices (STI) for yield com-ponents to decipher the molecular basis of yield perfor-mance under well-watered and water-stress conditions since these indices have been considered as good criteria for identifying genotypes that combine high yield and stress tolerance potential [57]. In addition, a positive correlation between STI for yield and yield under drought has been reported in peanut [53,69]. Thirteen QTLs were mapped for STI-related traits. Positive effects noted at nine QTLs were from the amphidiploid. Most QTLs mapped for STI related traits co-localized
0 5 10 15 20 25
STI Plant morph. Pod morph. Seed size Yield comp. Flowering
A Genome
B Genome
with the QTL of the trait for which they were calcu-lated. This indicated a positive relationship between per-formances under the well-watered and water-limited treatments, as stressed above. Of special interest were STI-PN and STI-SN QTLs on LG a07, which mapped on a genomic region where no QTLs for PN and SN were mapped. Moreover, they co-localized with STI-HSW QTLs and several other QTLs involved in the increase in seed size under both well-watered and water-limited treatments. Favourable alleles at QTLs for STI-PN and STI-SN were from the amphidiploid while in this region positive alleles at all detected QTLs were from Fleur11. This suggests that this is a key region that could be involved in the trade-off between maintaining large sized seed and producing more seeds under water stress. In a cultivated allelic configuration, the produc-tion of large sized seeds could be favoured, while in a wild configuration it would be the seed number.
These results show that peanut wild relatives are valu-able sources for improving important agronomical traits under both well-watered and water-limited conditions.
QTLs for the same traits are mainly found in non-homeologous regions
In our study, the most striking results were the huge differences in QTL distribution on homeologous LGs and the lack of QTL consistency between homeologous LGs, while good colinearity has been reported between peanut A and B genomes [51,70,71]. QTLs for the same traits were mapped in 96% of cases in non-homeologous regions. Non-homeologous QTL locations could result from the lack of segregating alleles in one genome ver-sus the other or by natural and/or human driven selec-tion of different genes in the two subgenomes that contribute to the variation in the same trait. These results could also be explained by the differential control of gene expression in subgenomes and/or by movement of genes resulting in disruption of colinearity, as a
con-sequence of interspecific hybridization and/or
allotetraploidization.
Movement of genes resulting in disruption of colinear-ity has been reported in polyploid wheat [72] by homeo-logous BAC sequence comparison. Changes in gene expression, including genome specific gene silencing, unequal expression of homeologous genes, neofunctio-nalization or subfunctioneofunctio-nalization of genes, have been extensively studied in various allopolyploids including wheat, cotton and brassica [73]. In cotton, high variation in the expression of the A and D subgenomes have been
reported [74-76]. In addition, Rong et al.[77] reported
that A and D subgenomes of the tetraploid cotton con-tributed QTLs for lint fiber development at largely non-homeologous locations. However, in hexaploid wheat, several authors have described the location of QTLs for
the same trait on homeologous LG [78-80]. This sug-gests that variations in subgenome contributions to QTLs may depend on polyploid lineages.
Clustering of key morphological trait QTLs: footprints of domestication
The marked phenotypic differences distinguishing crops from their wild progenitors are referred to as the domestication syndrome.
In our study, we considered that seed and pod size (SWI, SL, PWI and PL), 100 seed and pod weights (HSW, HPW), pod constriction (PC), and plant growth habit (GH) were traits that could be mostly involved in the peanut domestication syndrome. These traits were characterized by a high heritability ranging from 0.71 to 0.90. A total of 53 QTLs were detected for these traits. More than half of them clustered in three genomic regions on LGs a07 (11 QTLs), b02 (10 QTLs), b05 (8 QTLs). All QTLs with major effects for HSW and HPW, most of those for PWI, SWI, SL, and one for PC and GH were mapped in these three genomic regions. These QTLs individually explained 10.0% to 26.0% of the phenotypic variance and the favorable alleles were always from cultivated species. Other QTLs involved in PC and GH variations are found alone or in clusters with QTLs with lower effects for PWI, SWI, PL and SL on 10 different LGs. The high correlation between traits involved in pod size, seed size, HSW, HPW and the clustering of their associated QTLs suggests that one gene with pleiotropic effects or a limited number of linked genes are responsible for these trait variations in each region.
could be responsible for the morphological differences observed between peanut subspecies. Our findings on a limited number of domestication related QTLs and their clustering on specific areas of the peanut genome are in line with what has been reported for a wide range of crops, including tomato [81], maize [82], rice [83], wheat [84], and bean [46]. Our results could be further confirmed using a population with larger size, since at least in the case of sunflower many QTLs with small effects were mapped for domestication related traits [47].
Comparative QTL analysis is a powerful tool for unra-veling the genetic basis of domestication in plant families. In cereals, particularly in maize, sorghum and rice, a small number of QTLs located in syntenic regions control some domestication traits [85]. In
Sola-naceae, Doganlar et al. [86] reported that 40% of the
loci involved in eggplant fruit weight, shape and color have putative orthologous counterparts in tomato, potato and/or pepper. However, in legumes, Weeden [87] argued that although a similar number of genes have been modified during pea and common bean domestication, these genes were different. Nevertheless, these authors suggested that genes responsible for seed weight, photoperiod sensitivity and seed dormancy may involve homologous or orthologous sequences. Seed weight is one of the most important traits in legume domestication [48]. Comparative QTL analysis across legume species showed that QTLs for seed weight were
located in orthologous regions of LotusLG 2, soybean
LG b1, pea LG I, and chickpea LG 8 [88]. Recent studies
on legume synteny showed thatLotus LG2 shared
com-mon regions withArachisLG 7 and LG 5 [89,90]. These
two Arachis LGs were also collinear with LG a07 and b05 that carried the seed size QTL regions in our study. These results suggested that orthologous regions could be involved in genetic control of seed weight in peanut and several legume species. This could be further inves-tigated by refining the syntenic relationships between these legumes species, and fine mapping and cloning gene(s) underlying the seed size QTLs.
Conclusions
This manuscript reports a detailed QTL analysis of sev-eral traits involved in peanut productivity and domesti-cation using a wild × cultivated advanced backcross population. We mapped a total of 95 QTLs in two water-treatments. Wild alleles contributed positive varia-tion to many valuables agronomic traits such as flower-ing precocity, seeds and pods number, length and size as well as pods maturity. We also mapped peanut domestication related QTLs and proposed a temporal sequence of fixation of key traits during the domestica-tion process that could explain morphological
differences between peanut subspecies. In our study, we also showed that peanut A and B subgenomes contribu-ted QTLs at largely non-homeologous regions as a prob-able consequence of the polyploidization. Our findings on the positive contribution of wild species to peanut improvement are in agreement with what has been reported for many other crops and offer novel opportu-nities for exploiting the reservoir of useful alleles remaining in peanut wild species.
Additional material
Additional file 1: Figure S1. FTSW variation during population evaluation in well-watered and water-limited treatments. R5 to R8 correspond to peanut reproductive stages. I to III correspond to stress intensity levels.
Additional file 2: Figure S2. Distribution of the traits measured in the population. The black arrow represents the value of the cultivated parent Fleur11.
Acknowledgements
The authors gratefully acknowledge Angelique D’Hont and David Pot for the critical review of the manuscript as well as Delphine Luquet for her assistance in analysis of soil water data. This study was funded by the Cirad and the Generation Challenge Programme.
Author details
1Cirad, UMR AGAP, TA A108/3, Avenue Agropolis, Montpellier F-34398,
France.2ISRA/Ceraas, Route de Khombole, BP 3320, Thiès Escale, Senegal. 3Embrapa Recursos Genéticos e Biotecnologia, C.P. 02372, CEP 70.770-900
Brasilia, DF, Brazil.4Universidade de Brasília, Campus Universitário, CEP 70.910-900 Brasília, DF, Brazil.
Authors’contributions
DF designed and coordinated the study, was involved in population development, field evaluation, genotyping data production, carried out data analyses and drafted the manuscript, HAT was involved in population development and field evaluation of the population, IF and ON were involved in field evaluation of the population, RR and HV were involved in genotyping data production, MCM contributed to the development of SSR markers used in this study, DJB and JCG were involved in the design of the study, BC contributed to editing of the manuscript and helped in data analyses. JFR conceived, designed and coordinated the study, was involved in data analyses, and editing of the manuscript. All authors have read and approved the final manuscript.
Received: 6 September 2011 Accepted: 17 February 2012 Published: 17 February 2012
References
1. Wendel JF:Genome evolution in polyploids.Plant Mol Biol2000,
42:225-249.
2. Adams KL, Wendel JF:Polyploidy and genome evolution in plants.Curr Opin Plant Biol2005,8:135-141.
3. Soltis DE, Soltis PS:Polyploidy: recurrent formation and genome evolution.Trends Ecol Evol1999,14:348-352.
4. Paterson AH:Polyploidy, evolutionary opportunity, and crop adaptation. Genetica2005,123:191-196.
5. Udall JA, Wendel JF:Polyploidy and crop improvement.Crop Sci2006,46: S-3-14.
7. Soltis DE, Albert VA, Leebens-Mack J, Bell CD, Paterson AH, Zheng C, Sankoff D, dePamphilis CW, Wall PK, Soltis PS:Polyploidy and angiosperm diversification.Am J Bot2009,96:336-348.
8. Kochert G, Stalker HT, Gimenes MA, Galgaro ML, Lopes CR, Moore K:RFLP and cytogenetic evidence on the origin and evolution of allotetraploid domesticated peanut,Arachis hypogaea(Leguminosae).Am J Bot1996,
83:1282-1291.
9. Dwivedi SL, Bertioli D, Crouch JH, Valls JFM, Upadhyaya HD, Favero AP, Moretzsohn MC, Paterson AH:Peanut.InGenome Mapping and Molecular Breeding in Plants. Volume 2.Edited by: Kole C. Springer-Verlag. Berlin, Heidelberg; 2007:115-151.
10. He G, Prakash CS:Identification of polymorphic DNA markers in cultivated peanut (Arachis hypogaeaL.).Euphytica1997,97:143-149. 11. Hopkins MS, Casa AM, Wang T, Mitchell SE, Dean RE, Kochert GD,
Kresovich S:Discovery and characterization of polymorphic simple sequence repeats (SSRs) in peanut.Crop Sci1999,39:1243-1247. 12. Gimenes M, Hoshino A, Barbosa A, Palmieri D, Lopes C:Characterization
and transferability of microsatellite markers of the cultivated peanut (Arachis hypogaea).BMC Plant Biol2007,7:9.
13. Cuc L, Mace E, Crouch J, Quang V, Long T, Varshney R:Isolation and characterization of novel microsatellite markers and their application for diversity assessment in cultivated groundnut (Arachis hypogaea).BMC Plant Biol2008,8:55.
14. Liang X, Chen X, Hong Y, Liu H, Zhou G, Li S, Guo B:Utility of EST-derived SSR in cultivated peanut (Arachis hypogaeaL.) andArachiswild species. BMC Plant Biol2009,9:35.
15. Varshney R, Bertioli D, Moretzsohn M, Vadez V, Krishnamurthy L, Aruna R, Nigam S, Moss B, Seetha K, Ravi K, He G, Knapp S, Hoisington D:The first SSR-based genetic linkage map for cultivated groundnut (Arachis hypogaeaL.).Theor Appl Genet2008,118:729-739.
16. Hong Y, Chen X, Liang X, Liu H, Zhou G, Li S, Wen S, Holbrook CC, Guo B:
A SSR-based composite genetic linkage map for the cultivated peanut (Arachis hypogaeaL.) genome.BMC Plant Biol2010,10:17.
17. Ravi K, Vadez V, Isobe S, Mir RR, Guo Y, Nigam SN, Gowda MVC, Radhakrishnan T, Bertioli DJ, Knapp SJ, Varshney RK:Identification of several small main-effect QTLs and a large number of epistatic QTLs for drought tolerance related traits in groundnut (Arachis hypogaeaL.). Theor Appl Genet2010,122:1119-1132.
18. Lu J, Pickersgill B:Isozyme variation and species relationships in peanut and its wild relatives (ArachisL.-Leguminosae).Theor Appl Genet1993,
85:550-560.
19. Raina SN, Rani V, Kojima T, Ogihara Y, Singh KP, Devarumath RM:RAPD and ISSR fingerprints as useful genetic markers for analysis of genetic diversity, varietal identification, and phylogenetic relationships in peanut (Arachis hypogaea) cultivars and wild species.Genome2001,44:763-72. 20. Gimenes MA, Lopes CR, Galgaro ML, Valls JFM, Kochert G:RFLP analysis of
genetic variation in species of sectionArachis, genusArachis
(Leguminosae).Euphytica2002,123:421-429.
21. Moretzsohn M, Hopkins M, Mitchell S, Kresovich S, Valls J, Ferreira M:
Genetic diversity of peanut (Arachis hypogaeaL.) and its wild relatives based on the analysis of hypervariable regions of the genome.BMC Plant Biol2004,4:11.
22. Tallury SP, Hilu KW, Milla SR, Friend SA, Alsaghir M, Stalker HT, Quandt D:
Genomic affinities inArachissectionArachis(Fabaceae): molecular and cytogenetic evidence.Theor Appl Genet2005,111:1229-1237.
23. Singh KP, Singh A, Raina SN, Singh AK, Ogihara Y:Ribosomal DNA repeat unit polymorphism and heritability in peanut (Arachis hypogaeaL.) accessions and related wild species.Euphytica2002,123:211-220. 24. Seijo G, Lavia GI, Fernandez A, Krapovickas A, Ducasse DA, Bertioli DJ,
Moscone EA:Genomic relationships between the cultivated peanut (Arachis hypogaea, Leguminosae) and its close relatives revealed by double GISH.Am J Bot2007,94:1963-1971.
25. Robledo G, Lavia G, Seijo G:Species relations among wildArachisspecies with the A genome as revealed by FISH mapping of rDNA loci and heterochromatin detection.Theor Appl Genet2009,118:1295-1307. 26. Robledo G, Seijo G:Species relationships among the wild B genome of
Arachisspecies (sectionArachis) based on FISH mapping of rDNA loci and heterochromatin detection: a new proposal for genome arrangement.Theor Appl Genet2010,121:1033-1046.
27. Milla SR, Isleib TG, Stalker HT:Taxonomic relationships amongArachis
sect.Arachisspecies as revealed by AFLP markers.Genome2005,48:1-11.
28. Burow MD, Simpson CE, Faries MW, Starr JL, Paterson AH:Molecular biogeographic study of recently described B- and A-genomeArachis
species, also providing new insights into the origins of cultivated peanut.Genome2009,52:107-119.
29. Favero AP, Simpson CE, Valls JFM, Vello NA:Study of the evolution of cultivated peanut through crossability studies amongArachis ipaensis, A.
duranensis, and A.hypogaea.Crop Sci2006,46:1546-1552.
30. Reddy AS, Reddy LJ, Mallikarjuna N, Abdurahman MD, Reddy YV, Bramel PJ, Reddy DVR:Identification of resistance to peanut bud necrosis virus (PBNV) in wildArachisgermplasm.Ann Appl Biol2000,137:135-139. 31. Sharma SB, Ansari MA, Varaprasad KS, Singh AK, Reddy LJ:Resistance to
Meloidogyne javanicain wildArachisspecies*.Genet Resour Crop Ev1999,
46:557-568.
32. Pande S, Rao JN:Resistance of wildArachisspecies to late leaf spot and rust in greenhouse trials.Plant Dis2001,85:851-855.
33. Dwivedi SL, Pande S, Rao JN, Nigam SN:Components of resistance to late leaf spot and rust among interspecific derivatives and their significance in a foliar disease resistance breeding in groundnut (Arachis hypogaea
L.).Euphytica2002,125:81-88.
34. Leal-Bertioli S, Jose AC, Alves-Freitas D, Moretzsohn M, Guimaraes P, Nielen S, Vidigal B, Pereira R, Pike J, Favero A, Parniske M, Varshney R, Bertioli D:Identification of candidate genome regions controlling disease resistance inArachis.BMC Plant Biol2009,9:112.
35. Simpson CE, Starr JL:Registration of“COAN”Peanut.Crop Sci2001,41:918. 36. Simpson CE, Starr JL, Church GT, Burow MD, Paterson AH:Registration of
“NemaTAM”Peanut.Crop Sci2003,43:1561.
37. Garcia GM, Tallury SP, Stalker HT, Kochert G:Molecular analysis ofArachis
interspecific hybrids.Theor Appl Genet2006,112:1342-1348.
38. Tanksley SD, McCouch SR:Seed banks and molecular maps: Unlocking genetic potential from the wild.Science1997,277:1063-1066. 39. Gur A, Zamir D:Unused natural variation can lift yield barriers in plant
breeding.PLoS Biol2004,2:e245.
40. Hajjar Hodgkin:The use of wild relatives in crop improvement: a survey of developments over the last 20 years.Euphytica2007,156:1-13. 41. Tanksley SD, Grandillo S, Fulton TM, Zamir D, Eshed Y, Petiard V, Lopez J,
Beck-Bunn T:Advanced backcross QTL analysis in a cross between an elite processing line of tomato and its wild relative L.pimpinellifolium. Theor Appl Genet1996,92:213-224.
42. Swamy BPM, Sarla N:Yield-enhancing quantitative trait loci (QTLs) from wild species.Biotechnol Adv2008,26:106-120.
43. Paterson AH:What has QTL mapping taught us about plant domestication?New Phytol2002,154:591-608.
44. Hammer K:Das domestikationssyndrom.Die Kulturpflanze1984,32:11-34. 45. Harlan JR:Origins and processes of domestication.Grass evolution and
domesticationG.P. Chapman. Cambridge University Press; 1992, 159-175. 46. Koinange EMK, Singh SP, Gepts PL:Genetic control of the domestication
syndrome in common bean.Crop Sci1996,36:1037-1045.
47. Burke JM, Tang S, Knapp SJ, Rieseberg LH:Genetic analysis of sunflower domestication.Genetics2002,161:1257.
48. Gepts P:Crop domestication as a long-term selection experiment.Plant Breed Rev2004,24:1-44.
49. Pickersgill B:Domestication of plants in the Americas: Insights from mendelian and molecular genetics.Ann Bot2007,100:925-940. 50. Krapovickas A, Gregory W:Taxonomía del géneroArachis(Leguminosae).
Bonplandia1994,8:1-186.
51. Foncéka D, Hodo-Abalo T, Rivallan R, Faye I, Sall MN, Ndoye O, Fávero AP, Bertioli DJ, Glaszmann J-C, Courtois B, Rami J-F:Genetic mapping of wild introgressions into cultivated peanut: a way toward enlarging the genetic basis of a recent allotetraploid.BMC Plant Biol2009,9:103. 52. Reddy TY, Reddy VR, Anbumozhi V:Physiological responses of groundnut
(Arachis hypogeaL.) to drought stress and its amelioration: a critical review.Plant Growth Regul2003,41:75-88.
53. Clavel D, Drame NK, Roy-Macauley H, Braconnier S, Laffray D:Analysis of early responses to drought associated with field drought adaptation in four Sahelian groundnut (Arachis hypogaeaL.) cultivars.Environ Exper Bot 2005,54:219-230.
54. Clavel D, Sarr B, Marone E, Ortiz R:Potential agronomic and physiological traits of Spanish groundnut varieties (Arachis hypogaeaL.) as selection criteria under end-of-cycle drought conditions.Agronomie2004,