www.scielo.br/rbg
REPRESENTATIVE ELEMENTARY VOLUME OF A REGION OF INTEREST OF
A HETEROGENEOUS CARBONATE ROCK USING X-RAY COMPUTED MICROTOMOGRAPHY
AND NUMERICAL SIMULATION
William Godoy de Azevedo Lopes de Silva
1, Edmilson Helton Rios
1, Fernanda Oliveira Hoerlle
1,
Elizabeth May Braga Dulley Pontedeiro
1, Leonardo Borghi
2,
José Luis Drummond Alves
1and Paulo Couto
1ABSTRACT.Characterization of carbonate rocks presents several challenges regarding the acquisition of petrophysical parameters and the understanding of fluid flow dynamics in their pore system. To face these challenges, techniques such as X-ray microtomography, three-dimensional digital model reconstruction and fluid flow numerical simulations have been continuously developed and improved. This study analyzes the representative elementary volume (REV) of a region of interest (ROI) of a highly heterogeneous stromatolite sample. Porosity and permeability are estimated for different subvolumes of the sample based on digital petrophysics. All necessary steps for reconstruction and segmentation of the complex pore system of the sample, as well as numerical simulations of fluid flow, are presented and discussed. The workflow is promising for reservoir evaluation because it can be applied to any type of carbonate rock.
Keywords: stromatolite,µCT, segmentation, REV, digital petrophysics.
RESUMO.A caracterização de rochas carbonáticas apresenta diversos desafios quanto à determinação de seus parâmetros petrofísicos e o entendimento da dinâmica de escoamento de fluidos em seus sistemas porosos. Técnicas como a microtomografia de raios X, a modelagem digital tridimensional e a simulação numérica do escoamento de fluidos têm sido continuamente desenvolvidas e aprimoradas para superar esses desafios. Este estudo analisa o volume elementar representativo (REV) em uma região de interesse (ROI) de uma amostra de estromatólito altamente heterogênea. A porosidade e a permeabilidade são estimadas em diferentes subvolumes da amostra através da petrofísica digital. São apresentadas e discutidas todas as etapas necessárias para a reconstrução e segmentação do sistema poroso e a simulação numérica do escoamento de fluidos. A metodologia é promissora para avalição de reservatórios visto que o fluxo de trabalho pode ser aplicado a qualquer tipo de rocha carbonática.
Palavras-chave: estromatólitos,µCT, segmentação, REV, petrofísica digital.
1Universidade Federal do Rio de Janeiro/COPPE, Rua Moniz Aragão, 360, Bloco 4 (CT2/LTEP), Cidade Universitária, 21941-972, Rio de Janeiro, RJ,
Brazil - E-mails: [email protected], [email protected], [email protected], [email protected], [email protected], [email protected]
2Universidade Federal do Rio de Janeiro/Instituto de Geociências/Laboratório de Geologia Sedimentar, Av. Athos da Silveira Ramos, 274, Cidade Universitária,
techniques for studying carbonate rocks and their petrophysical properties. Kaczmarczyk et al. (2010, 2011) compared porosity and permeability values estimated based on µCT images
obtained with standard experimental procedures. Youssef et al. (2007) validated their 3D pore system models created from
µCT data as a function of porosity and permeability estimates.
Machado et al. (2015) and Corbett et al. (2015) used microbialite rocks, similar to the one used in this work, to characterize the mineralogy and porosity distribution of complex carbonate rocks. However, none of these studies analyzed the representativeness of the digital poroperm results.
A representative elementary volume (REV) is defined as the volume of a sample able to capture a representative quantity of its heterogeneity (Bear, 1972). The REV is the volume at which macroscopic properties, such as porosity and permeability, are insensitive to small changes in the volume of the analyzed sample (Fig. 1). An REV should also be insensitive to the region of interest (ROI) within the analyzed sample (Corbett et al., 2015). It may differ in size according to the petrophysical property to be measured so that a suitable representative scale may depend directly upon the evaluated property (Vik et al., 2013).
This study determines the REV based on two different parameters from digital petrophysics: porosity and permeability. Both parameters are estimated for a region of interest of a stromatolite sample that was imaged in a computed X-ray microtomographer. The reconstructed three-dimensional pore system was processed, followed by numerical simulations of single-phase fluid flow. For the numerical simulations, we considered the works of Fourie et al. (2007), Narsilio et al. (2009) and Kaczmarczyk et al. (2011), who showed the possibility of upscaling the Navier-Stokes equations, which regulate fluid flow at the microscale, to obtain parameters associated with fluid flow at the mesoscale and macroscale (e.g., the permeability).
Corbett et al., 2015):
1. A basal layer or cellar associated with the stage at which the lagoon was open to the sea. This layer shows significant siliciclastic sedimentation, carbonate cementation and pores that are laterally connected or oriented;
2. An intermediate layer displaying a large number of pores derived by both intense bioactivity and dissolution (vugs). This layer represents a more restricted phase of the lagoon, with less siliciclastic sedimentation and more carbonate dissolution;
3. A top layer displaying fewer pores than other layers and showing microbial laminations that are laterally continuous, associated with the closed phase of the lagoon. This layer also shows a small number of pore interconnectivities.
Imaging and segmentation
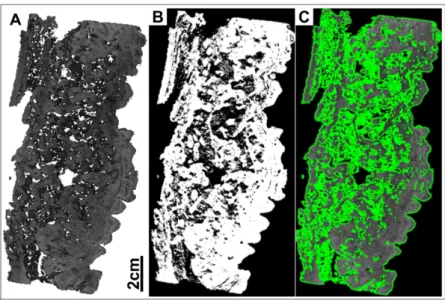
The entire stromatolite sample (Fig. 2C) was imaged with a voxel size of 106.55 µm (Fig. 3A) using an X-ray computed
microtomographer, the phoenix v|tome|x m model, from Baker Hughes (BH), a General Electric (GE) company. TheµCT was
equipped with a DRX-250 detector, and calibrated with a voltage of 150 kV and a current of 700µA. We used a copper filter of 0.1
mm for the image acquisition process in order to reduce noise. The softwares Fiji/ImageJ and Simpleware ScanIP 6.0 were used for digital reconstruction of the sample and its pore system.
Voxel size characterizes the image resolution and its capacity to detect smaller pores. It is worth remembering that although the term resolution is used to denote the size of the voxel, or also to represent the number of pixels and voxels in an image, its definition is linked to the modulation transfer function (MTF) associated with the measured resolution of an
Figure 1 – Petrophysical property as a function of sample volume for two different regions of interest of a rock sample
(shown here in 2D for simplicity). The REV is achieved when the petrophysical property converges to a single and constant value.
imaged system (Cnudde & Boone, 2013). Smaller voxel sizes were not needed for this work because macro- and mega-pores were dominant in the pore system of the stromatolite sample.
An extremely important part of this study was the required segmentation of the images and definition of the threshold value. Segmentation can be understood as a process of converting a grayscale, or even a color image, to a binary image. This process is possible by identifying two populations present in the image based on the intensity of their values obtained during data acquisition (Al-Raoush & Willson, 2005). In studies involving the analysis of rocks and their pore systems, for example, these two populations refer to the pore and solid phases. These stages are obtained due to different absorption properties of the materials, related to different local attenuation coefficients, thus generating different intensity values in the obtained images (Wildenschild et al., 2002).
Three methodologies were used in this study to define the threshold value: the Otsu (1979) method (Fig. 3B), the histogram-shape-based method (Kaczmarczyk et al., 2010) and the active-contours-without-borders method (Chan & Vese, 2001) (Fig. 3C). These three methods converged to the same threshold value. It is important to mention that the Otsu and histogram-shape-based methods assume that the histogram is not bimodal, but must present at least three distinctive peaks in order to identify the threshold value. The method from Chan & Vese (2001) uses the minimization of energy, from the segmentation procedure of Mumford & Shah (1989), as its key element to define the threshold value. The threshold value was obtained using the Fityk 0.9.8 and Matlab 2012b softwares,
as well as free computational codes. For our study we used segmentation methods selected from several available methods in the literature (Sezgin & Sankur, 2004; Hoerlle et al., 2017).
Subsampling scheme
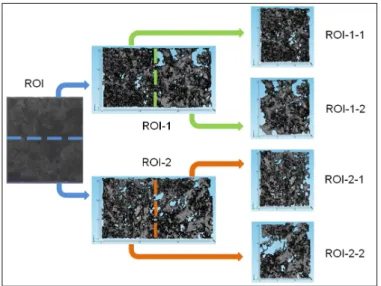
We selected a ROI from the basal layer of the stromatolite (Fig. 2C) for analysis of the REV. The ROI had dimensions of 3.2 cm in length, 2.9 cm in width and 1.0 cm in height (Fig. 4). This corresponds to a volume of 9.3 cm3which is the approximate
volume of a standard petrophysical plug of 1 inch diameter per 1 inch length. Because the stromatolite sample was friable, no plugs were extracted, while subsampling was performed digitally. The ROI was subdivided into equal halves, further referred to as ROI-1 and ROI-2 (Fig. 4), having a volume of 4.6 cm3, a
length of 1.6 cm, a width of 2.8 cm, and a height of 1.0 cm. Each of the two halves was divided again, with the subunits referred to as ROI-1-1 and ROI-1-2 for unit ROI-1, and ROI-2-1 and ROI-2-2 for unit ROI-2. The approximate dimension of each of these subunits was 1.6 cm in length, 1.4 cm in width, and 1.0 cm in height, with an approximate volume of 2.3 cm3. This
process was repeated, resulting in eight subvolumes of 1.15 cm3,
then in sixteen subvolumes of 0.575 cm3and finally in thirty-two
subvolumes of 0.288 cm3(not further represented in Fig. 4 for
simplicity).
Poroperm modeling
The geometry of the pore system in each subvolume was modeled using representative meshes generated with the software Simpleware ScanIP 6.0 + FE 6.0. As an example, Figure 4
pore network has constant temperature and density, single-phase flow is simulated with liquid water as the saturating fluid during stationary laminar flow (i.e., Stokes flow or creeping
Representation of the volumes on a semi-logarithmic scale produced a triangle shape-like pattern for both ROI’s. The distribution of porosity for the studied stromatolite subsample
Figure 2 – A) Northern coast of Rio de Janeiro state, Brazil, showing B) the Lagoa Salgada location, and C) the stromatolite sample with indication of its top, intermediate
and basal layers.
Figure 3 – A)µCT image section of the studied stromatolite sample, B) an image segmented using the Otsu (1979) method, and C) an image segmented using the Chan & Vese (2001) method.
Figure 4 – Subsampling scheme of the ROI of the basal layer of the stromatolite sample.
Figure 5 – 3D model of the pore system of ROI-1. The gray components refer to the solid
part of the rock, while the void parts between the solid represent the pore system. Scale in mm.
Figure 9 – REV for the subvolume ROI-1 considering a maximum deviation of
10% on the digital porosity estimates.
Figure 10 – REV for the subvolume ROI-1 considering a maximum deviation of
20% on the digital permeability estimates.
converged to a single and constant value as expected previously from Figure 1.
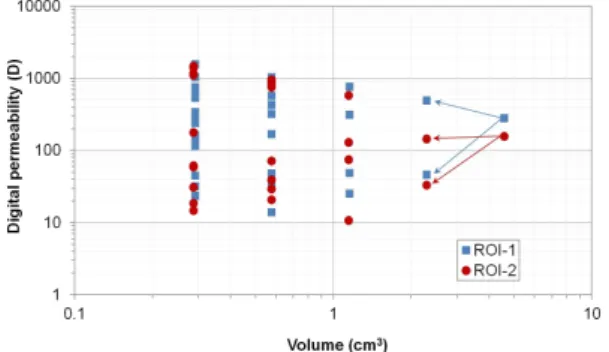
Figure 8 similarly shows digital permeability estimates of ROI-1 and ROI-2, and all of their respective subvolumes, from right to left. The distribution of permeability did not have the same well-behaved triangle shape-like pattern as the porosity distribution. This is because permeability is influenced by its measured volume in a much more complex way (compare the arrows in Figs. 7 and 8). We also note that the digital permeability estimates had very high values, tens to hundreds of Darcy, which indicates that the macro- and mega-pores, predominantly present in the sample, are very well connected in different scales of the sample.
The REV values for each analyzed petrophysical property were obtained considering a maximum deviation of 10% in the porosity estimates and 20% in the permeability estimates (Corbett et al., 2015). The subvolumes in the porosity and permeability plots of Figures 9 and 10, respectively, are now presented in a linear scale. Even using different deviations between the porosity and permeability estimates, a large variation
in the REV value is evident when these two petrophysical properties are compared. The REV obtained from analysis of digital porosity was much lower (2.3 cm3) than the REV
value for the digital permeability (4.6 cm3). Considering digital
permeability as the best option for the REV in this case, it is necessary to have a volume twice as large as that required in conventional approaches which only the digital porosity is considered. However, we emphasize that the obtained results are not absolute REV values for the entire stromatolite sample but only for the ROI of its basal layer. To obtain an absolute REV for such a sample, an enormous computational effort would be needed. Sophisticated hardware for this was also not available in this project.
CONCLUSIONS
Digital petrophysics is a valuable non-invasive tool for reservoir rock characterization. In this work we evaluated the REV of a ROI of a heterogeneous carbonate rock based on porosity and permeability estimates. The lacustrine stromatolite rock sample used in our study was located on the surface, with little or
no compaction, which may explain the high values found for the permeability estimates. A bigger REV was obtained when permeability is used instead of conventional porosity. Additional studies using subsurface carbonate core samples, supported with routine core analysis data, are being performed currently to validate this methodology. However, the results were satisfactory for the purposes of testing and evaluating the REV. We think the adopted workflow is promising for upscaling studies for other types of carbonate rocks.
ACKNOWLEDGMENTS
This research was carried out in association with the ongoing R&D projects registered as ANP 19027-2, “Desenvolvimento de infraestrutura para pesquisa e desenvolvimento em recuperação avançada de óleo – EOR no Brasil” (UFRJ/Shell Brasil/ANP) setting-up a advanced EOR Lab facility for R&D in Brasil, and ANP 20163-2, “Análise experimental da recuperação de petróleo para as rochas carbonáticas do pré-sal brasileiro através da injeção alternada de CO2e água”, both sponsored by Shell Brasil
under the ANP R&D levy as “Compromisso de Investimentos com Pesquisa e Desenvolvimento”. This research was also carried out with the support of project ANP 18029-9 ”Projeto de correlação petrofísica poço x perfil” sponsored by Petrobras under the ANP R&D levy as “Compromisso de Investimentos com Pesquisa e Desenvolvimento”. This study was financed in part by the Coordenação de Aperfeiçoamento de Pessoal de Nível Superior – Brazil (CAPES) – Finance Code 001, and carried out with the support of Conselho Nacional de Desenvolvimento Científico e Tecnológico - Brazil CNPq). The authors acknowledge Professor Ricardo Tadeu from UFRJ, Alessandra Machado and Átila de Paiva Teles from the Nuclear Instrumentation Laboratory (LIN/COPPE/UFRJ) for the use of theµCT equipment and the
technical support with the image acquisition.
REFERENCES
AL-RAOUSH R & WILLSON C. 2005. A pore-scale investigation of a multiphase porous media system. Journal of Contaminant Hydrology, 77(1-2): 67-89. doi: 10.1016/j.jconhyd.2004.12.001. URL http://adsabs.harvard.edu/abs/2005JCHyd..77...67A.
BEAR J. 1972. Dynamics of Fluids in Porous Media. Dover Publications. Inc. New York. 764 pp.
CHAN TF & VESE LA. 2001. Active contours without edges. IEEE Transactions on Image Processing, 10(2): 266-277. doi: 10.1109/83. 902291.
CNUDDE V & BOONE M. 2013. High-resolution X-ray computed tomography in geosciences: A review of the current technology and applications. Earth-Science Reviews, 123: 1–17. doi: 10.1016/j. earscirev.2013.04.003.
CORBETT P, HAYASHI FY, ALVES MS, JIANG Z, WANG H, DEMYANOV V, MACHADO A, BORGHI L & SRIVASTAVA N. 2015. Microbial carbonates: a sampling and measurement challenge for petrophysics addressed by capturing the bioarchitectural components. Geological Society, London, Special Publications, 418(1): 69–85. doi: 10.1144/SP418.9. URL http: //sp.lyellcollection.org/content/418/1/69.
FOURIE W, SAID R, YOUNG P & BARNES D. 2007. The Simulation of Pore Scale Fluid Flow with Real World Geometries obtained from X-ray Computed Tomography. In: COMSOL Conference, Boston, MA, U.S.A. HOERLLE FO, SILVA WGAL, RIOS EH, SILVEIRA T, COUTO P, ALVES JLD, LIMA M, BORGHI L & CORBETT P. 2017. Evaluation of segmentation procedures using X-ray computed microtomography images of coquinas from Morro do Chaves Formation - NE Brazil. In: XXXVIII Iberian-Latin American Congress on Computational Methods in Engineering. Florianópolis, Santa Catarina, Brazil. doi: 10.20906/CPS/ CILAMCE2017-0573.
IESPA AAC, IESPA CMD & BORGHI L. 2012. Evolução Paleoambiental da Lagoa Salgada utilizando Microbialitos, com ênfase em Microfácies Carbonáticas. Geociências (São Paulo), 31(3): 371–380.
KACZMARCZYK J, DOHNALIK M & ZALEWSKA J. 2010.
Three-Dimensional Pore Scale Fluid Flow Simulation based on Computed microtomography carbonate rocks’ images. In: V European Conference on Computational Fluid Dynamics - ECCOMAS 2010. Lisbon, Portugal.
KACZMARCZYK J, DOHNALIK M & ZALEWSKA J. 2011. Evaluation of Carbonate Rock Permeability, with the Use of X-ray Computed Microtomography. NAFTA-GAZ, 64(4): 233–239.
LEIDERMAN R, PEREIRA AMB, BENAVIDES FMJ, SILVEIRA CS, ALMEIDA RMS & BAGUEIRA RA. 2017. Personal Computer-Based Digital Petrophysics. Brazilian Journal of Geophysics, 35(2): 95–107. doi: 10.22564/rbgf.v35i2.891.
MACHADO AS, DAL BÓ PFF, LIMA I, BORGHI L & LOPES R. 2015. X-ray microtomography characterization of carbonate microbialites from a hypersaline coastal lagoon in the Rio de Janeiro State-Brazil. Nuclear Instruments and Methods in Physics Research Section A: Accelerators, Spectrometers, Detectors and Associated Equipment, 784: 574–580. MUMFORD D & SHAH J. 1989. Optimal approximations by piecewise smooth functions and associated variational problems. Communications on Pure and Applied Mathematics, 42(5): 577–685. doi: 10.1002/cpa. 3160420503.
NARSILIO G, BUZZI O, FITYUS S, YUN T & W SMITH D. 2009. Upscaling of Navier–Stokes equations in porous media: Theoretical, numerical and
RODRIGUES M, CARVALHO M & DIAS G. 1981. Interpretação paleoambiental das lagoas Salgadas e das Ostras (RJ) Brasil, com base em foraminíferos. In: Congresso Latino-Americano de Palenotologia. Porto Alegre, RS, Brazil – UFRGS. Volume 2, p. 893–906.
SEZGIN M & SANKUR B. 2004. Survey over image thresholding techniques and quantitative performance evaluation. Journal of Electronic Imaging, 13(1): 146-168. doi: 10.1117/1.1631315.
hydrology: Systems, resolutions, and limitations. Journal of Hydrology, 267(3-4): 285–297. doi: 10.1016/S0022-1694(02)00157-9.
YOUSSEF S, ROSENBERG E, GLAND N, KENTER J, SKALINSKI M & VIZIKA O. 2007. High Resolution CT and Pore-Network Models to Assess Petrophysical Properties of Homogeneous and Heterogeneous Carbonates. In: SPE/EAGE Reservoir Characterization and Simulation Conference, Abu Dhabi, UAE. SPE-111427-MS. doi: 10.2118/111427-MS.
Recebido em 25 setembro, 2018 / Aceito em 29 novembro, 2018 Received on September 25, 2018 / Accepted on November 29, 2018