www.scielo.br/rbg
PROPOSAL OF CHANGE DETECTION IN LAND COVER FOR PIPELINE MONITORING
FROM RAPIDEYE AND IKONOS IMAGES
Paulina Setti Riedel, Mara L´ucia Marques, Mateus Vidotti Ferreira and Marcelo Elias Delaneze
ABSTRACT.The goal of this study was to improve and evaluate the applicability of a methodological procedure of pipeline monitoring to reveal indicators of third party activities that may interfere with the structural preservation of pipes and environmental damages. The procedure was developed from the technique of change detection through object-based classification of land cover, using high resolution satellite images applied to a section of the Guararema-Mau´a – S˜ao Paulo pipeline, Brazil. In the seven-month monitoring period performed with RapidEye imaging, an area of 2.024 km2was identified as area of change, corresponding to 3.30% of the total area analyzed. For the monitoring performed with Ikonos imaging during a four-month period, changes were detected in an area of 0.187 km2, which corresponded to 1.92% of the total area analyzed. The main changes in land cover were from Bare Soil to Grassland, due to changes related to the different stages of agricultural activity and reforestation areas, as well as the natural regeneration of vegetation over the pipeline and solid waste landfill. The results of the change detection of land cover from object-based classification were close to the technique reference limit for areas with great complexity and diversity of space occupation.
Keywords: structural preservation of pipes, object-based classification, high resolution satellite images.
RESUMO.Este estudo teve por objetivo avaliar a aplicabilidade de um procedimento metodol´ogico de monitoramento de faixas de dutos que revelem indicativos de atividades de terceiros que podem interferir na integridade estrutural dos dutos e provocar danos ambientais. O procedimento foi desenvolvido a partir da t´ecnica de detecc¸˜ao de mudanc¸as na cobertura da terra pela classificac¸˜ao baseada no objeto, com utilizac¸˜ao de imagens orbitais de alta resoluc¸˜ao. Este procedimento foi empregado em um trecho da faixa de dutos Guararema-Mau´a – SP, no monitoramento realizado por meio de imagens RapidEye. Em um per´ıodo de sete meses, foram identificados 2,024 km2como ´area de mudanc¸a, que corresponde a 3,30% do total da ´area analisada. Para o monitoramento realizado a partir da imagem Ikonos, com per´ıodo de quatro meses, foi identificada como mudanc¸a uma ´area de 0,187 km2, correspondendo a 1,92% do total da ´area analisada. As principais mudanc¸as ocorridas foram entre Solo Exposto e Vegetac¸˜ao Rasteira, devido `as alterac¸˜oes ocorridas nos est´agios de cultivo agr´ıcola e ´areas de reflorestamento, como tamb´em, est˜ao associadas `as ´areas de regenerac¸˜ao da vegetac¸˜ao da faixa de dutos e aterro sanit´ario. Os resultados da detecc¸˜ao de mudanc¸as da cobertura da terra pela classificac¸˜ao baseada no objeto atingiram acertos pr´oximos ao limite de para esta t´ecnica, em ´areas com grande complexidade e diversidade de ocupac¸˜ao do espac¸o.
Palavras-chave: integridade estrutural dos dutos, classificac¸˜ao baseada no objeto, imagens orbitais de alta resoluc¸˜ao.
Department of Applied Geology, UNESP – Universidade Estadual Paulista, 1515 24A Ave., 13506-900 Rio Claro, SP, Brazil. Phone: +55(19) 3526-9306; Fax: +55(19) 3524-9644 – E-mails: psriedel@rc.unesp.br; maralucia.marques@hotmail.com; mateusvidotti@yahoo.com.br; mdelaneze@yahoo.com.br
i i
“main” — 2015/6/2 — 11:56 — page 656 — #2
i i
656
PROPOSAL OF CHANGE DETECTION IN LAND COVER FOR PIPELINE MONITORING FROM RAPIDEYE AND IKONOS IMAGESINTRODUCTION
The installation and operation of a petrochemical industry brings many benefits to the region and the area of influence where it is installed, generating income, jobs and improvements to produc-tive and road infrastructures. However, the environmental issue tends to be relegated to a secondary position behind economic ef-ficiency, which seeks the optimization of refining facilities. There-fore, such facilities end up being concentrated in large complexes, generating a variety of social and environmental issues (Lora, 2002). The diagnosis of those issues must take into considera-tion the conflicts and potential changes associated with the land cover vegetation, water availability and demand, land use, envi-ronmental risks and the land occupation in the areas surrounding refineries and oil transportation facilities (Suarez, 1986).
New techniques have been employed to develop computa-tional systems to analyze the risks to pipelines and their mainte-nance needs. The most utilized methods for monitoring pipelines include foot patrolling along the pipelines and aerial surveillance with small aircraft and helicopters (Zirnig et al., 2002). These in-spections check for construction activity near the pipelines and maintenance of the service areas. The frequency of such inspec-tions is determined by the intensity of human activity over the in-fluence area of the pipeline (Roper & Dutta, 2005).
According to Hausamann et al. (2005), the changes in built-up, vegetation and bare soil areas were considered as indicators of third parties activities that may compromise the pipeline struc-tural preservation. These indexes were the matter to be applied in the present study to improve the methodological procedure of pipeline monitoring developed from the technique of land cover change detection by using high spatial resolution satellite images. Previous study (Marques et al., 2013) developed this pro-cedure to the monitoring of ORBEL pipeline section from Rio de Janeiro to Belo Horizonte (Brazil). For the present research, this aforementioned procedure was improved and applied to the GASPAL/OSVAT pipeline for Guararema-Mau´a section, in the State of S˜ao Paulo, Brazil. According to the Environmental Impact Report of the S˜ao Paulo State Secretary of the Environment, in the installation period the pipelines in S˜ao Paulo Metropolitan Area crossed areas of low building density. Currently unplanned land occupation near the pipeline service areas due to population growth, has resulted an increasing anthropic pressure on them (SEMA-SP, 2007).
Remote sensing (RS) products and techniques have proven to be fundamental in the diagnosis and monitoring of the occupation of space. The images serve as an important source of informa-tion regarding phenomena occurring on the land surface and are
essential for understanding and modeling the dynamics of changes in land use and cover, which helps to identify the ele-ments that may constitute risks to the pipeline. The use of RS, as well as the geographic information systems (GIS), improves the capability to detect changes by enabling more frequent and sys-tematic collection of information, and integration and analysis of spatial data (Roper & Dutta, 2005).
From literature, conceptually, change detection can be de-scribed as a process of identifying and quantifying changes in objects or phenomena based on multi-temporal observations (Singh, 1989; Coppin & Bauer, 1994; Seto et al., 2002; Lu et al., 2004). Despite it is not a general requirement to change detec-tion analysis, the applicadetec-tion of RS products in change detecdetec-tion must satisfy, if possible, the selection of images with the same spatial and spectral resolution, which makes it possible to iden-tify features for comparison between images (Lu et al., 2004). High resolution satellite imagery is a rapidly evolving technol-ogy that provides spatial and temporal information regarding the different objects on the surface, with increasingly detailed and fre-quent resolutions, improving the efficiency for classification of specific features and identification of dynamic processes, as land use (Im et al., 2008). To evaluate the contribution of high spatial resolution sensors to the monitoring of pipelines, this manuscript used RapidEye images (acquired in Sep/2011 and Apr/2012) and Ikonos images (acquired in Nov/2011 and Mar/2012).
For Zirnig et al. (2001), change detection techniques can be useful tools for detecting changes in the area surrounding the pipeline, considering that in change detection, the data from one image are compared to corresponding data of the preceding im-age, based on each pixel of the images. Changes in the landscape are reflected in differences in the corresponding pixels. However, comparisons using this method can lead to problems due to nat-ural changes in the vegetation, light, and surface conditions, such as snow or rain, which result in radiometric changes in the pixels. Thus, important corrections are necessary to reduce the high pro-portion of false changes generated by automatic detection based on RS images. According to Lu et al. (2004), the technique of comparing multi-temporal images using an array of changes after classification reduces atmospheric interference, and radiometric correction is not required.
The technique of change detection for digital images classi-fication is based on the distinction and identiclassi-fication of different classes that have different spectral responses assigned, which al-low their automated application to large areas. To the adoption of this technique, classification algorithms are applied to extract the features of interest from a multidimensional space, usually
repre-sented by the different bands, creating an unique level of thematic information: the classes (Lu et al., 2004).
The digital land use and land cover classification from those images is challenging, due to the spectral mixing of objects in the image, caused by the complexity of the elements found on the terrestrial surface (Eikvil et al., 2009; Pu & Landry, 2012).
Thus, the object-based image analysis is an approach in-creasingly used in classifying high spatial resolution remote sens-ing images (Liu et al., 2008). The first step for object-based age classification is the image segmentation into objects or im-age segments, and then classifies these objects based on their attributes and spatial relations, generating segments that are ho-mogeneous in the spectral, geometric, texture and positional characteristics of the image elements (Ryherd & Woodcock, 1996; Shackelford & Davis, 2003).
The multiresolution segmentation algorithm approach uses the growth of regions in which adjacent regions are grouped ac-cording to the similarity criterion which considers the internal heterogeneity of the regions. In the definition of similarity, it is necessary to provide parameters of scale, form, tone, compact-ness, smoothness and spectral bands which also allow the use of a Thematic Layer (Baatz & Sch¨ape, 2000).
The classification of land use and land cover from object-based analysis requires a hierarchical network elaboration in the class structure, which is based on the semantic network and the physical characteristics of the objects that compose a given class. The semantic network represents a logical structure relating the objects or classes to their meanings and relationships (Antunes, 2003), and may be classified in three kinds of hierarchical net-works: inheritance hierarchies; group hierarchies and structured groups (Hofmann, 2001).
In object-based approach, the classification algorithms em-ploy attributes to describe spectral properties, geometric charac-teristics and texture of the image objects. These attributes can be grouped into: (a) Spectral attributes (mean, standard-deviation, Gaussian distribution asymmetry, brightness, HSI transformation, algebra between bands, NDVI) – spectral bands set making up the image or the result of operations between bands, which discrimi-nate objects by their tonality or statistical description; b) Geometry attributes – describe objects as size, shape, width, length, area, and their relationships; (c) Position attributes – locate an object image relative to the entire scene, especially to geographically referenced data; (d) Texture attributes – estimate the texture of image objects. The texture is estimated by the Gray Level Co-occurrence Matrix (GLCM) or by Spatial Dependence Matrix. In Dependence Matrix is calculated spatial separation of one pixel
against another reference pixel (Definiens, 2009). The GLCM es-timates the texture from the tabulation of the different combination of gray level in a scene. The calculation depends upon the feature angle: 0◦, 45◦, 90◦, 135◦for all pixels direction of an image ob-ject (Haralick et al., 1973; Haralick, 1979).
STUDY AREA
This study analyzed a section of the GASPAL/OSVAT pipeline between the Guararema Terminal and Mau´a (RECAP). This seg-ment crosses areas of the municipalities of Guararema, Mogi das Cruzes, Suzano, Ferraz de Vasconcelos, S˜ao Paulo and Mau´a, in the State of S˜ao Paulo, Brazil. The Guararema-Mau´a pipeline is represented in Figure 1.
For the test using the RapidEye image, covered area was 61.74 km2, Figure 1(a). For the Ikonos image test, total area cov-ered was 9.75 km2, Figure 1(b). The RapidEye and Ikonos images had different buffers sizes, which were previously defined accord-ing to spatial resolution and costs for image scene.
MATERIALS AND METHOD
The REIS (RapidEye Earth Imaging System) sensor system col-lects images in five spectral bands: Blue (0.44-0.51µm), Green (0.52-0.59µm), Red (0.63-0.685µm), Red-Edge (0.69-0.73µm), which is sensitive to changes in the chlorophyll content in plants, and Near Infrared (0.76-0.85µm), with an imaging area of 77.25 km. The satellite revisit time is 24 hours (off-nadir) and 5.5 days (nadir). The spatial resolution offered by this sensor is 6.5 m and 5 m for orthoimages and a 12-bit radiometric resolution (RapidEye, 2007).
The Red Edge band, which corresponds to the transition band between the Red and Near Infrared (NIR) bands, covers part of the spectrum where the vegetation reflectivity increases drastically from the Red band to the NIR band. The Red band is one of the areas where chlorophyll absorbs light, and the NIR band is where the leaf cell structure produces a strong reflection. Thus, varia-tions in both the chlorophyll content and the structure of the leaf provide additional information contributing to the identification of plant types, nutrition and health, plant cover characteristics and abundance, among other resources (Weichelt et al., 2012).
The Ikonos (Advanced Earth Observing Satellite) satellite sensor is a high resolution satellite, encoded in 11-bit, with four multispectral bands: Blue (0.44-0.51µm), Green (0.52-0.59µm), Red (0.63-0.69µm), Infrared (0.76-0.90µm), 4 m resolution and one panchromatic band (0.45-0.90µm), 1 m resolution. The ap-plication of Ikonos images is important for studies such as more
i i
“main” — 2015/6/2 — 11:56 — page 658 — #4
i i
658
PROPOSAL OF CHANGE DETECTION IN LAND COVER FOR PIPELINE MONITORING FROM RAPIDEYE AND IKONOS IMAGESFigure 1 – Guararema-Mau´a pipeline and area studied through RapidEye and Ikonos images.
detailed mappings of land cover and use, change detection, car-tographic updating and monitoring environmental risks (Kalpoma & Kudoh, 2007). The acquisition parameters of RapidEye and Ikonos are described in Table 1. The use of the images was sup-ported by a fellowship between IGCE/UNESP – Rio Claro and CENPES/PETROBRAS.
Pipeline Monitoring Procedures
The procedures for pipeline monitoring were developed through land cover classification for change detection from high spatial resolution images (Ikonos and RapidEye). These procedures were performed using ENVI, eCogniton and ArcGis softwares, following the methodological steps described below.
Table 1 – Description of acquisition parameters of RapidEye and Ikonos images.
Image Date Imaging
Elevation Angle Imaging Azimuth Solar Elevation Angle Solar Azimuth RapidEye September 2011 09/09/2011 86.63 2.79 84.12 2.47 09/09/2011 86.63 2.79 84.13 2.51 09/09/2011 86.63 2.78 84.13 2.43 April 2012 04/19/2012 88.80 2.80 84.72 2.20 04/12/2012 88.10 9.70 84.38 1,77 04/05/2012 86.75 9.81 84.22 2.37 Ikonos November 2011 11/25/2011 86.28 115.05 68.39 87.25 11/25/2011 83.68 38.87 68.44 87.31 11/25/2011 72.89 19.09 68.46 87.41 March 2012 03/14/2012 73.39 320.05 56.35 54.73
Image Pre-processing
Pre-processing of the Ikonos images acquired on November 2011 and March 2012 was done according to the following procedures: (a) Geometric correction – The orthorectification was executed using RPC’s (Rational Polynomial Coefficient), Digital Elevation Model (scale 1:2000) and control points obtained from digital aerial photographs (0.2 m resolution); (b) Image fusion – the multispectral bands (4 m) were fused with the panchromatic band (1 m), resulting in bands of 1 m resolution.
In this manuscript there were no radiometric correction, since according to Lu et al. (2004), the technique of change detection comparing multi-temporal images using an array of changes after classification, reduces atmospheric interference.
The RapidEye images required no further pre-processing procedure, since it was already orthorectified when acquired with a correction level A3 (RapidEye, 2007).
Elaboration of the Thematic Map T1
Land cover classes, presented in Table 2, were defined according to the identification of activities that may compromise the structure of the pipeline. From this definition, the classes were determined based on the spectral characteristics of the objects.
The object-based approach classification must be initiated with image segmentation. Segments were generated using a Mul-tiresolution Segmentation algorithm that enables the identifica-tion of the image contents with different levels of detail (Baatz
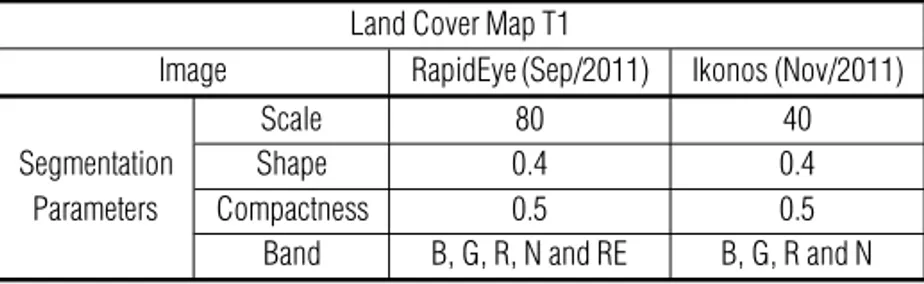
& Sch¨ape, 2000). The parameters applied to images segmenta-tion, considering RapidEye (Sep/2011) and Ikonos (Nov/2011), are showed in Table 3.
The classification of land cover was based on the spectral behavior, geometric characteristics and texture of the objects. Following the hierarchical class structure, training samples were obtained for each class of land cover. These samples are needed to describe the classes and the context in which they are in-serted, making it possible the analysis of the histograms of at-tributes generated by the Sample Editor, to select the atat-tributes for classification.
The maps of the initial land cover (T1) were drawn from the RapidEye images acquired on September 2011 and Ikonos images acquired on November 2011 through the classification algorithm Assign Class (Definiens, 2009). The parameters were described in hierarchical networks, illustrated in Figures 2 and 3. After that, classes were edited by visual interpretation.
Change Detection Procedure
The change detection process was carried on using eCogni-tion software (Definiens, 2009), according to the steps described below.
Segmentation
In the searching for the best segmentation, tests were performed to obtain the parameters of scale, shape and compactness,
Table 2 – Land Cover Class Description. Land Cover Class Description
Shadow Shadow of natural and built-up elements Asphalt Roads and streets paved with asphalt cover Bare Soil Areas without buildings or vegetation land cover Arboreal Cover Medium and tall trees in forested and urban areas
Grasslands Areas covered by grasses and shrubs
Cover Concrete, ceramic and asbestos roofs and concrete paved areas
Swimming Pools Swimming pools
Flooded Area Areas temporarily covered by water Rivers/Reservoirs Water streams, lakes and reservoirs
Table 3 – Segmentation process parameters for maps of the initial land cover (T1). Land Cover Map T1
Image RapidEye (Sep/2011) Ikonos (Nov/2011) Segmentation
Parameters
Scale 80 40
Shape 0.4 0.4
Compactness 0.5 0.5
i i
“main” — 2015/6/2 — 11:56 — page 660 — #6
i i
660
PROPOSAL OF CHANGE DETECTION IN LAND COVER FOR PIPELINE MONITORING FROM RAPIDEYE AND IKONOS IMAGESFigure 2 – Hierarchical network used in classification – RapidEye, Sep/2011 (T1).
seeking the best values of the parameters to extract the objects in the image, according to the classes of interest. After several trials three levels of segmentation were established, which parameters are described in Table 4.
Table 4 – Segmentation Process Parameters.
RapidEye Images: Sep/2011 and Apr/2012
T1 Bands T2 Bands Parameters Level III
B T1 B T2 Scale 80 G T1 G T2 Shape 0.4 R T1 R T2 Color 0.6 RE T1 RE T2 Compactness 0.5 N T1 N T2 Smoothness 0.5 Thematic Map T1 — —
Ikonos Images: Nov/2011 and Mar/2012
T1 Bands T2 Bands Parameters Level III
B T1 B T2 Scale 40
G T1 G T2 Shape 0.4
RE T1 RE T2 Color 0.6
N T1 N T2 Compactness 0.5 Thematic Map T1 Smoothness 0.5
Identification of Change Areas (Change Map – CM)
Multi-temporal algebraic bands were applied to identify change areas, as proposed by Foresti (1986). Red bands ([R T2]-[R T1]) for both sensors (Ikonos and RapidEye) were used to evidence distinct spectral response assigned for different materials in the study areas. These bands allow better characterization of land cover changes in vegetated areas, as well as built-up areas (Jensen, 1983; Forster, 1985).
Table 5 – Thresholds used to determine change and no change areas.
RapidEye Ikonos
Class Sep-Apr Class Nov-Mar
No Change –2620≤NC≤126 No Change –350≤NC≤–80 Red Change RC>126 Red Change RC>20 Blue Change BC<–2620 Blue Change BC<–350
The output images were analyzed taking into account three change statements: No Change (NC), areas that remain un-changed; Red Change (RC), when the objects have lower spec-tral response in the T1 image than T2 image; Blue Change (BC), when the objects have higher spectral response in T1 image than in T2 image. From these statements, the thresholds were defined to determine change areas in the RapidEye and Ikonos images (Table 5).
Change map classification (Land Cover Map – LCM)
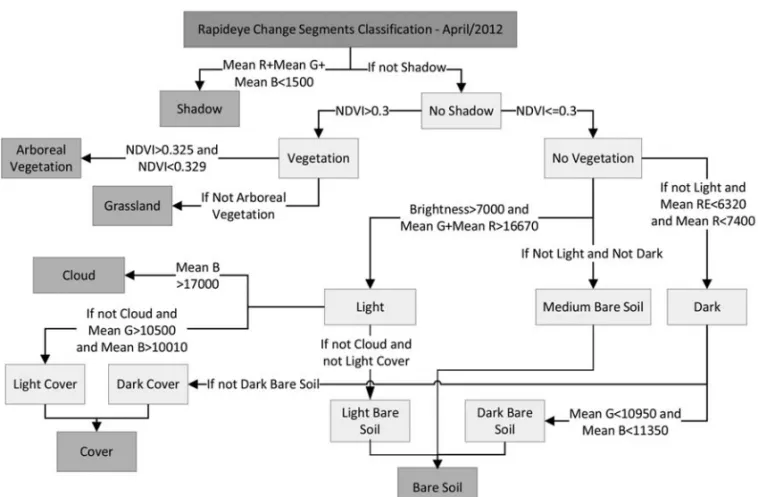
The areas identified as Red Change (RC) and Blue Change (BC) were grouped and labeled as Change Areas (CA). These CAs were classified according to the object-based approach. For the classi-fication of land cover was employed the Assign Class algorithm, implemented in eCognition (Definiens, 2009). The attributes for classification were selected from training samples, which were obtained for each class of land cover. From these samples were generated histograms of the selected attributes used for classifi-cation of change areas in both RapidEye and Ikonos images. The parameters were described in hierarchical networks, as illustrated in Figures 4 and 5.
In the analysis and quantification of the land cover change areas, for each monitoring (RapidEye and Ikonos), classes with the same land use characteristics were grouped; thus, the Light, Medium, and Dark Bare Soil classes were grouped together to form the Bare Soil class, and the Light, Medium and Dark Cover classes were grouped together to create the land cover class.
Adjusted Land Cover Map – ALCM
The study identified Change and No Change areas with the pur-pose of analyzing activities that may interfere in pipelines oper-ations. Although the four-month period used for the Ikonos im-ages may be considered a short time to detect some changes, it is nevertheless adequate for the monitoring of the service as well as the influence areas of the pipeline, due to the need to prevent accidents and control third party activities. Considering that the frequency of observations should be proportional to the density of occupation along the pipeline influence area, some areas will be visited weekly, and even daily.
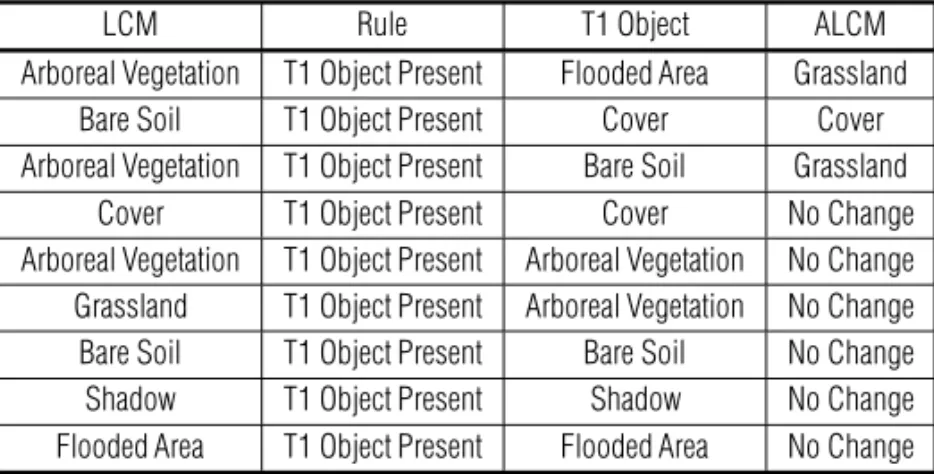
Therefore, to adjust for and control possible changes, some premises were considered. The first premise is related to the impossibility of arboreal development in such a short period. The second premise considers the land cover classes Rivers/ Reservoirs, Asphalt and Swimming Pools to be constant. Lastly, the third premise determines that no change will occur for the Shadow class. Thus, after the automatic classification of the land cover classes of the areas defined as Change, some rules were applied in the classification process to limit the identification and classification of false changes (Table 6).
Generation of Thematic Map T2
After adjustments were done to obtain the ALCM, the land cover maps were updated with the changes identified in the period from September 2011 to April 2012 (RapidEye image) and from
i i
“main” — 2015/6/2 — 11:56 — page 662 — #8
i i
662
PROPOSAL OF CHANGE DETECTION IN LAND COVER FOR PIPELINE MONITORING FROM RAPIDEYE AND IKONOS IMAGESFigure 4 – Hierarchical network used in the classification – RapidEye.
Table 6 – Rules applied to the classification process to limit the identification of false changes.
LCM Rule T1 Object ALCM
Arboreal Vegetation T1 Object Present Flooded Area Grassland Bare Soil T1 Object Present Cover Cover Arboreal Vegetation T1 Object Present Bare Soil Grassland
Cover T1 Object Present Cover No Change Arboreal Vegetation T1 Object Present Arboreal Vegetation No Change Grassland T1 Object Present Arboreal Vegetation No Change Bare Soil T1 Object Present Bare Soil No Change Shadow T1 Object Present Shadow No Change Flooded Area T1 Object Present Flooded Area No Change
November 2011 to March 2012 (Ikonos image). The new infor-mation was superimposed to the Thematic Maps T1 to generate the Thematic Maps T2.
Validation of the classification
The study used error matrices and the Kappa coefficient of agree-ment to determine the statistical accuracy of the results in Change and No Change areas, before and after the adjustment to limit false changes. The results obtained in the classification of changes in the land cover classes were also evaluated. The error matrix represents the mapping accuracy through analysis of the agree-ment between reference samples and the product of the classifica-tion (Congalton & Green, 2009). The stratified random sampling method was used to select validation samples. The reference sam-ples were acquired based on visual interpretation of Rapid Eye and Ikonos images. This procedure was supported considering the features of the classes and the high resolution of the images, likewise adopted in Campos et al. (2005), Gamanya et al. (2007), and Platt & Rapoza (2008). One hundred samples of each image were acquired of each class of Change and No Change to evaluate the change areas. To validate the classification of the land cover classes, 50 samples of each land cover class were obtained in the segments defined as change areas, a number considered suffi-cient to determine the accuracy of change detection, according to Congalton & Green (2009). The exception was the class Arboreal Vegetation, where 18 samples were acquired of the RapidEye im-age but no sample from the Ikonos imim-age was acquired, as there was no change detected in this class.
RESULTS AND DISCUSSION
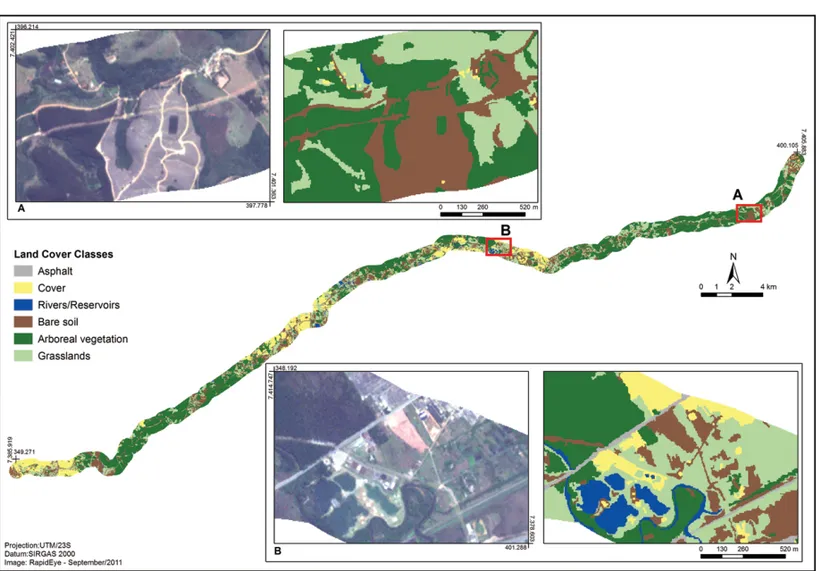
The Figures 6 and 7 show the maps of the initial land cover (T1) outcome, respectively, from RapidEye and Ikonos images classi-fication.
The results obtained from change detection using the Rapid-Eye images and those results obtained after adjustments to con-strain false changes are showed in error matrices (Table 7). The percentage of correct values was 88 and 83%, and agreement Kappa coefficient was 0.76 and 0.66, respectively. The quality of classification is considered by the reference ranges values pro-posed by Landis & Koch (1977). The aforementioned coefficients for change areas classifications observed in the present study are qualified as a good agreement.
The change detection results from Ikonos images showed a percentage of 65% for correct values and 66% for the results ob-served after adjustments to constrain false changes. Both proce-dures showed an agreement Kappa coefficient of 0.31 and 0.32, respectively (Table 8), indicating a reasonable accuracy to the identification of the change areas.
Although the study area is located in a metropolitan region of accelerated socioeconomic dynamics, it showed few areas of change in the analyzed period. The monitoring done through RapidEye image during a seven-month period, identified a change area of 2.024 km2, corresponding to 3.30% of the total area analyzed (61.29 km2). For the monitoring realized through the Ikonos image over a four-month period, the areas identified as change areas totaled 0.187 km2, corresponding to 1.92% of the area analyzed (9.75 km2).
The main changes occurred between Bare Soil and Grass-land, which are to a great extent explained by the different stages of agricultural activity and reforestation areas. Changes to Bare Soil are also associated with areas of vegetation regeneration over the pipeline and in the waste landfill. The analysis of these changes indicates that this area presents some limitations to the process of urban expansion, despite the proximity to the nucleus of the metropolitan region (Figs. 8 and 9).
As we can see in Tables 9 and 10, agreement Kappa coefficient for the land cover classification was 0.65 and the overall accuracy
i i
“main” — 2015/6/2 — 11:56 — page 664 — #10
i i
664
PROPOSAL OF CHANGE DETECTION IN LAND COVER FOR PIPELINE MONITORING FROM RAPIDEYE AND IKONOS IMAGESFigure 6 – Initial Land Cover Map (T1), elaborated from RapidEye image.
Table 7 – Change Areas Error Matrices in the RapidEye Monitoring.
Change Areas Error Matrix Adjusted Change Areas Error Matrix
Reference Data Reference Data
Classified Data
Change No Change Total Classified Data Change No Change Total
Change 79 3 82 Change 67 1 68
No Change 21 97 118 No Change 33 99 132
Total 100 100 200 Total 100 100 200
Overall Accuracy 88% Overall Accuracy 83%
Kappa 0.76 Kappa 0.66
Table 8 – Change Areas Error Matrices in the Ikonos Monitoring.
Change Areas Error Matrix Adjusted Change Areas Error Matrix
Reference Data Reference Data
Classified Data
Change No Change Total Classified Data Change No Change Total
Change 33 2 35 Change 32 0 32
No Change 67 98 165 No Change 68 100 100
Total 100 100 200 Total 100 100 200
Overall Accuracy 65% Overall Accuracy 66%
Figure 7 – Initial Land Cover Map (T1) elaborated from Ikonos image.
Table 9 – Land Cover Classification Error Matrix – RapidEye image. Reference Data
Classified Data
Cover Bare Soil Arboreal
Vegetation Grassland Total
Cover 37 8 0 0 45 Bare Soil 13 37 0 0 50 Arboreal Vegetation 0 0 3 0 3 Grassland 0 5 15 50 70 Total 50 50 18 50 168 Overall Accuracy= 76% Kappa= 0.65
Table 10 – Land Cover Classes Change Areas and Conditional Kappa – RapidEye image. Land Cover Class Change Areas (km2) User’s accuracy (%) User’s Kappa Producer’s accuracy (%) Producer’s Kappa Cover 0.1563 82 0.74 74 0.64 Bare Soil 0.9875 74 0.62 74 0.62 Arboreal Vegetation 0.0018 100 1.0 17 0.57 Grassland 0.8787 71 0.59 100 0.79
i i
“main” — 2015/6/2 — 11:56 — page 666 — #12
i i
666
PROPOSAL OF CHANGE DETECTION IN LAND COVER FOR PIPELINE MONITORING FROM RAPIDEYE AND IKONOS IMAGESFigure 8 – Change Areas Classification – RapidEye monitoring.
was 76%, denoting a substantial agreement. This good perfor-mance of the classification can be verified in the change areas classified as Grassland, Cover, and Bare Soil. The exception was the Arboreal Vegetation class, which showed a low performance in the classification, obtaining a producer’s conditional Kappa of 0.17%. This must be considered in order to avoid an incorrect interpretation of the vegetation growth.
The best performing class in the classification was Cover, with an overall of 82% and user’s conditional Kappa of 0.74. Analyz-ing the performance of each class, we observed that the error of including the Arboreal Vegetation class in the Grassland class caused a lower user conditional Kappa (0.59).
The change detection process through the RapidEye images monitoring achieved a high level of agreement. According to the Z test, and considering a 95% confidence interval, the result of the RapidEye monitoring classification was better than random, since theZ value achieved (14.47) is higher than 1.96 (Table 11). The results allowed identifying and quantifying land cover of the change areas in each monitoring, as shown in Table 10. In the study area with RapidEye monitoring, the classes that showed greater change were Bare Soil (0.9875 km2) and
Grass-lands (0.8787 km2), demonstrating that the changes in the seven-month period were not of great significance when compared to the total area analyzed.
Table 11 – Analysis of the individual Kappa in the RapidEye Moni-toring Classification Error Matrix.
Error Matrix Kappa Variation Z Test RapidEye Classification 0.65 0.0020 14.47
The analysis of the results obtained in the study indicates that the procedure used for pipeline monitoring with RapidEye images was adequate. However, when Ikonos images were used, the results obtained had an overall accuracy of 56% and a Kappa coefficient of 0.34, which indicate a reasonable agreement coeffi-cient (Tables 12 and 13).
The results obtained by the study indicate that for Grasslands the overall accuracy was 100% and the user’s conditional Kappa for was 1.0.
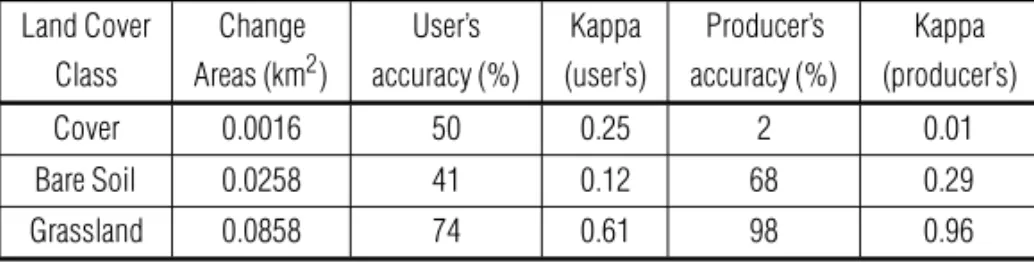
The analysis of the Ikonos monitoring indicates that there were few changes in the four-month period analyzed, with small changes being detected in the classes Cover (0.0913 km2) and Grasslands (0.0858 km2).
Figure 9 – Change Areas Classification – Ikonos monitoring.
Table 12 – Land Cover Classification Error Matrix – Ikonos image. Reference Data
Classified Data
Cover Bare Soil Grassland Total
Cover 1 1 0 2 Bare Soil 47 34 1 82 Grassland 2 15 49 66 Total 50 50 50 150 Overall Accuracy= 56% Kappa= 0.34
Table 13 – Land Cover Classes Change Areas and Conditional Kappa – Ikonos image. Land Cover Class Change Areas (km2) User’s accuracy (%) Kappa (user’s) Producer’s accuracy (%) Kappa (producer’s) Cover 0.0016 50 0.25 2 0.01 Bare Soil 0.0258 41 0.12 68 0.29 Grassland 0.0858 74 0.61 98 0.96
i i
“main” — 2015/6/2 — 11:56 — page 668 — #14
i i
668
PROPOSAL OF CHANGE DETECTION IN LAND COVER FOR PIPELINE MONITORING FROM RAPIDEYE AND IKONOS IMAGES According to theZ test, and considering a 95% confidenceinterval, the classification results of the Ikonos monitoring was better than random, since theZ value achieved (7.37) is higher than 1.96 (Table 14).
Table 14 – Analysis of the individual Kappa in the Ikonos Monitoring Classification Error Matrix.
Error Matrix Kappa Variation Z Test Ikonos Classification 0.34 0.0021 7.37
The results reached in the RapidEye images were adequate to the monitoring of the influence area of the pipeline allowing the identification of the main types of land cover in larger areas and also the understanding of the diversity into a geographic context. For Eikvil et al. (2009), the manual classification is tough on high resolution images due the ambiguity among the objects. This fact shows that the resolution is near to the limit for small objects detection, like small buildings. Thus, the automated classification results show a performing nearby to visual interpretation and ratify the applicability of automated classification techniques.
In remote sensing, the scenes can be differently perceived or observed as spatial resolution image change, as a result of two interrelated problems: the scale and the zooning, which lead to different inference of the scene, simply because it could ag-gregated areal units physically and thus perceptually changed (Powers et al., 2012).
The Ikonos images were better suited for a more detailed monitoring of the pipeline, due to their higher spatial resolution (1 m). Thus, they allow for a better identification of objects in the classification process of change areas. However, it should be noted that the variation in the periods analyzed (September 2011 to April 2012 for RapidEye monitoring and November 2011 to March 2012 for Ikonos) causes differences in the detection of changes, especially in agricultural and reforestation areas, due to management and stages of cultivation.
The analysis of applicability of the pipeline monitoring through land cover changes detection procedures using Rapid-Eye and Ikonos images also considered a quantitative evaluation realized from the estimated monitoring process execution time for each sensor employed (Table 15).
For a pipeline monitoring using optical images, it is necessary to observe the image acquisition characteristics covering the area to be analyzed. This is due to the possibility of the images being captured at different dates, which cause differences in the spectral response of the objects. In the test performed in the Guararema-Mau´a/SP pipeline, it was possible to identify such spectral vari-ation, especially in areas with vegetation cover. As we can see in Figure 10, the vegetated areas present a higher spectral response
in the visible bands (Blue, Green, Red and Red Edge) of the image shown on the left of Figure 10 (captured on 04/19/2012), while in the image on the right of Figure 10 (captured on 04/05/2012) the vegetated areas show a lower spectral response. We can also see that this variation generates differences in the values of the Normalized Difference Vegetation Index (NDVI) obtained from different dates. Thus, it is advisable not to make an image mosaic for pipeline monitoring for lengths requiring more than one image to be covered. In this way, the spectral characteristics produced by the different image acquisitions will be respected, facilitating the definition and estimation of attributes and thresholds of the classification process.
CONCLUSIONS
The methodological procedure of change detection and classifica-tion was adequate for monitoring the pipeline. Through the analy-sis of the results, it was possible to consider that in the segments analyzed no anthropic activities were detected that could compro-mise the pipeline structure or interfere with the maintenance of the service strip.
The accuracy to change detection analysis was 83% and 63% for RapidEye and Ikonos imagery, respectively. The mon-itoring with RapidEye images showed 3.3% of changes in the area, mostly occurred between Bare Soil and Grassland, which could be explained by the different stages of agricultural activ-ity and reforestation areas. For the monitoring by Ikonos images, the changes of 1.92% of the area, detecting alteration between Cover and Grassland classes, while few changes were detected in built areas.
Regarding the use of object-based classification with high spatial resolution images for pipeline monitoring, we highlight the recommendation of not creating an image mosaic when the images are captured on different dates, once high resolution im-agery increased the difficult to find attributes and thresholds to identify similar features into the area.
Levels of correctly classified land cover using the object-based method achieved are considered to be close to the limit of application of this technique with multi-temporal data of high complexity and diversity of space occupation. Higher overall lev-els could only be achieved by applying the manual edition to some segments that present classification errors. This limitation was also noted in literature, corroborating the need for develop-ment of specific rules and integration of user knowledge in the process to increase the precision of the change detection.
This study has presented the problem of aggregation of ho-mogeneous units due to the variation of resolution. Despite using
Table 15 – Pipeline Monitoring Process.
Pipeline Monitoring Stages Execution Time RapidEye Ikonos Pre-processing Orthorectification Orthorectified product 4h/scene
Fusion — 1h/scene
Elaboration of Thematic Map T1
Supervised Classification 4h/scene 4h/scene Visual Edition 1h/km2 10h/km2 Change Detection Segmentation, Change Detection
and Classification of Change Areas 6h/scene 8h/scene
Figure 10 – Spectral response of vegetated areas in the RapidEye images captured in different dates.
high spatial resolution, differences have occurred in the number and size of the segments generated in Ikonos (1 m) and RapidEye (5 m) images. This requires caution in the selection of parame-ters and attributes to be used for image classification, they must be adequate to the spatial resolution of the specific image used in monitoring procedures.
ACKNOWLEDGEMENTS
The authors acknowledge the financial support granted by Cen-pes/Petrobras and CAPES Foundation.
REFERENCES
ANTUNES AFB. 2003. Classificac¸˜ao de ambiente ciliar baseada em orientac¸˜ao a objeto em imagens de alta resoluc¸˜ao espacial Curitiba. Doc-torate thesis on Geodesic Science, Post-graduate Program on Geodesic Science. Universidade Federal do Paran´a, Brazil, 2003, 147 pp. BAATZ M & SCH¨APE A. 2000. Multiresolution segmentation: an opti-mization approach for high quality multiscale image segmentation. Ange-wandte Geographische Informationsverarbeitung, 12: 12–23.
CAMPOS VO, FEITOSA RQ, MOTA GLA, PACHECO MAC & COUTINHO HLC. 2005. Um m´etodo para modelagem do conhecimento
multitem-i i
“main” — 2015/6/2 — 11:56 — page 670 — #16
i i
670
PROPOSAL OF CHANGE DETECTION IN LAND COVER FOR PIPELINE MONITORING FROM RAPIDEYE AND IKONOS IMAGESporal no processo de classificac¸˜ao autom´atica de imagens de sensores remotos. RBC Rev. Bras. Cartografia, 57(1): 28–35.
CONGALTON RG & GREEN K. 2009. Assessing the accuracy of remotely sensed data: principles and practices. New York: Lewis Publishers, 183 pp.
COPPIN PR & BAUER ME. 1994. Processing of multitemporal Landsat TM imagery to optimize extraction of forest cover change features. IEEE T. Geosci. Remote, 32(4): 918–927.
DEFINIENS. 2009. eCognition 8.0. Munich, Germany. Available on: <http://www.ecognition.com/>. Access on: October 12, 2009. EIKVIL L, AURDAL L & KOREN H. 2009. Classification-based vehicle detection in high-resolution satellite images. ISPRS J. Photogramm., 64: 65–72.
FORESTI C. 1986. Avaliac¸˜ao e monitoramento ambiental da expans˜ao urbana do setor oeste da ´area metropolitana de S˜ao Paulo: an´alise de dados e t´ecnicas de sensoriamento remoto. Doctorate thesis on Physi-cal Geography, Post-graduate Program on PhysiPhysi-cal Geography, Univer-sidade de S˜ao Paulo, Brazil, 1986, 340 pp.
FORSTER BC. 1985. An examination of some problems and solutions in monitoring urban areas from satellite platforms. Int. J. Remote Sensing, 6(1): 139–151.
GAMANYA R, DE MAEYER P & DE DAPPER M. 2007. An automated satellite image classification design using object-oriented segmentation algorithms: a move towards standardization. Expert. Syst. Appl., 32: 616–624.
HARALICK RM. 1979. Statistical and structural approaches to texture. IEEE T. Syst. Man. Cyb., 67(5): 786–804.
HARALICK RM, SHANMUGAM K & DINSTEIN I. 1973. Texture features for image classification. IEEE T. Syst. Man. Cyb., 3(6): 610–621. HAUSAMANN D, ZIRNIG W, SCHREIER G & STROBL P. 2005. Monitor-ing of gas pipelines – a civil UAV application. Aircraft EngineerMonitor-ing and Aerospace Technology: an International Journal, 77(5): 352–360. HOFMANN P. 2001. Detecting buildings and roads from Ikonos data us-ing additional elevation information. Journal for Spatial Information and Decision Making, 6(1): 26–33.
IM J, JENSEN JR & TULLIS JA. 2008. Object-based change detection us-ing correlation image analysis and image segmentation. Int. J. Remote Sensing, 29(2): 399–423.
JENSEN JR. 1983. Urban/Suburban Land Use and Analysis. In: COWELL RN (Ed.). Manual of Remote Sensing. Falls Church: American Society of Photogrammetry, p. 1571–1666.
KALPOMA KA & KUDOH J. 2007. Image fusion processing for IKONOS 1-m color imagery. IEEE T. Geosci. Remote, 45(10): 3075–3086.
LANDIS JR & KOCH GG. 1977. The measurement of observer agreement of categorical data. Biometrics, 33(1): 159–174.
LIU Y, GUO Q & KELLY M. 2008. A framework of region-based spatial relations for non-overlapping features and its application in object based image analysis. ISPRS J. Photogramm., 63: 461–475.
LORA EES. 2002. Prevenc¸˜ao e controle da poluic¸˜ao nos setores ener-g´etico, industrial e de transporte. Rio de Janeiro: Interciˆencia, 481 pp. LU DS, MAUSEL P, BROND´IZIO E & MORAN E. 2004. Change detection techniques. Int. J. Remote Sensing, 25(12): 2365–2401.
MARQUES ML, FERREIRA MV, RIEDEL PS, DELANEZE ME & BENTZ CM. 2013. High spatial resolution images for monthly pipeline moni-toring. RBC Rev. Bras. Cartografia, 65(1): 189–198.
PLATT RV & RAPOZA L. 2008. An Evaluation of an Object-Oriented Paradigm for Land Use/Land Cover Classification. The Professional Geo-grapher, 60(1): 87–100.
POWERS RP, HAY GJ & CHEN G. 2012. How wetland type and area differ through scale: a GEOBIA case study in Alberta’s Boreal Plains. Remote Sens. Environ., 117: 135–145.
PU R & LANDRY S. 2012. A comparative analysis of high spatial resolu-tion IKONOS and WorldView-2 imagery for mapping urban tree species. Remote Sens. Environ., 124: 516–533.
RAPIDEYE. 2007. RapidEye image product specifications. Available on: <http://www.blackbridge.com/rapideye/mosaics/index.html>. Access on: October 10, 2011.
ROPER WE & DUTTA S. 2005. Remote sensing and GIS applications for pipeline security assessment. In: ESRI User Conference Proceedings, San Diego. Proceedings... Available on:<http://proceedings.esri.com/ library/userconf/proc05/papers/pap1762.pdf>. Access on: May 20, 2010.
RYHERD S & WOODCOCK CE. 1996. Combining spectral and texture data in the segmentation of remotely sensed images. Photogramm. Eng. Rem. S., 62(2): 181–194.
SEMA – Secretaria Estadual do Meio Ambiente de S˜ao Paulo. 2007. RIMA – Relat´orio de impacto ambiental. Plano diretor de dutos de S˜ao Paulo (PDD/SP). Available on: <http://www.petrobras.com.br/pt/meio- ambiente-e-sociedade/preservando-meio-ambiente/licenciamento-am-biental/downloads/pdf/RIMA-sp2.pdf>. Access on: July 22, 2011. SETO KC, WOODCOCK CE, SONG C, HUANG X, LU J & KAUFMANN RK. 2002. Monitoring land-use change in the Pearl River Delta using Landsat TM. Int. J. Remote Sensing, 23(10): 1985–2004.
SHACKELFORD AK & DAVIS CH. 2003. A combined fuzzy pixel-based and Object-Based approach for classification of high-resolution multi-spectral data over urban areas. IEEE T. Geosci. Remote, 41(10): 2354– 2363.
SINGH A. 1989. Review article digital change detection techniques using remotely-sensed data. Int. J. Remote Sensing, 10(6): 989–1003. SUAREZ MA. 1986. Petroqu´ımica e tecnoburocracia. Hucitec, S˜ao Paulo, 242 pp.
WEICHELT H, ROSSO P, MARX A, REIGBER S, DOUGLASS K & HEYNEN M. 2012. The RapidEye red edge band. Available on: <http://www.rapideye.de>. Access on: October 10, 2012.
ZIRNIG W, HAUSAMANN D & SCHREIER G. 2001. A concept for
natu-ral gas transmission pipeline monitoring based on new high-resolution remote sensing technologies. In: International Gas Research Confer-ence. Amsterdam. Proceedings. Available on:<http://www.gerg.eu/public/ uploads/files/publications/conference papers/2001/zirnig amsterdam01.pdf>. Access on: November 25, 2013.
ZIRNIG W, HAUSAMANN D & SCHREIER G. 2002. High-resolution re-mote sensing used to monitor natural gas pipelines. Earth Observation Magazine: Geographic, Mapping, Earth, 11: 12–17.
Recebido em 1 setembro, 2013 / Aceito em 8 setembro, 2014 Received on September 1, 2013 / Accepted on September 8, 2014
NOTES ABOUT THE AUTHORS
Paulina Setti Riedel received the B.Sc. degree in Geology from the Universidade de S˜ao Paulo (USP – 1984); the M.Sc. degree in remote sensing from the National Institute for Space Research (INPE – 1988); and the Ph.D. degree in geotechnical engineering from the Universidade de S˜ao Paulo, S˜ao Carlos (USP-SC – 1994). Since 1988, has been a Professor in the Department of Applied Geology, Universidade Estadual Paulista (UNESP). Research interests include remote sensing and geoprocessing of spatial data.
Mara L ´ucia Marques geographer with degree held at Universidade Estadual Paulista (UNESP/Rio Claro – 1994). M.Sc. and Ph.D. degrees in Geography from the UNESP/Rio Claro, in 2005. Post-doctoral position at Department of Applied Geology – Graduate Program in Geosciences and Environment (UNESP/Rio Claro). Research background in spatial analysis, geoprocessing, remote sensing, and urban and regional planning.
Mateus Vidotti Ferreira currently, pursuing to accomplish the Ph.D. degree (Geosciences and Environment – UNESP), B.Sc. in Geography (UNESP - 2007), M.Sc. in Geosciences and Environment (UNESP – 2009), Specialization in Geoprocessing (UFSCAR – 2008). Experience in geoprocessing, with emphasis in remote sensing, planning and management of the environment. Worked for three years as a researcher in a partnership project between UNESP and Cenpes/Petrobras focused on analysis of remote sensing products for pipelines monitoring.
Marcelo Elias Delaneze is a Doctorate student in Geosciences and Environment, at Universidade Estadual Paulista (UNESP), Rio Claro (SP), Brazil. Obtained a Bachelor in Geography (2008), and a Master’s Degree (2011), both at UNESP. Academic experience on Environmental Sciences, Oil Pipeline Monitoring, Remote Sensing, GIS, and Sediment Transport Models. Research interest has been focusing on modelling of sediment transport capacity in dams and possible deposition zones.