Vol.56, n.2: pp. 223-236, March-April 2013
ISSN 1516-8913 Printed in Brazil BRAZILIAN ARCHIVES OF
BIOLOGY AND TECHNOLOGY
A N I N T E R N A T I O N A L J O U R N A L
Design and Evaluation of Famotidine Mucoadhesive
Nanoparticles for Aspirin Induced Ulcer Treatment
Dhaval J Patel
1*and Jayvadan K Patel
21Department of Pharmaceutics; Saraswati Institute of Pharmaceutical Sciences; Gandhinagar; 382355, Gujarat,
India. 2Department of Pharmaceutics; Nootan Pharmacy College; Visnagar, 384315, Gujarat, India.
ABSTRACT
The present study was performed to design and evaluate the famotidine loaded mucoadhesive nanosuspension for aspirin induced ulcer. A 3-factor, 3-level Box-Behnken design was applied to study the effects of amount of the beads (X1), PVPK-30(X2) and Tween-80 (X3) on the particle size (Y1), and cumulative percentage drug released
after 1h (Y2). The optimization was performed using the desirability function and contour plots. The scanning
electron microscopy (SEM) showed the nanoparticles as spherical in shape. The differential scanning calorimetry (DSC) analysis indicated that there was substantial crystallinity change in the nanoparticle compared with the pure drug. Ex-vivo mucoadhesion study showed that famotidine mucoadhesive nanoparticles possessed higher mucoadhesion than the famotidine nanoparticles. The in vivo studies on aspirin-induced rats indicated the lowering in ulcer index for famotidine mucoadhesive nanoparticles was 0.46+0.011, which was significantly better than the effect of traditional famotidine suspension (0.66+0.035). Famotidine mucoadhesive nanosuspension could be prepared using the media milling technique and allowing significant reduction in ulcer index compared to famotidine suspension.
Key words: Famotidine, Nanosuspension, Box-Behnken design, Mucoadhesion, peptic ulcer
*Author for correspondence: dhaval6668@gmail.com
INTRODUCTION
Among various noxious substances such as acid, pepsin, H. pylori, the use of non steroidal anti-inflammatory drugs (NSAIDs) plays a major role in the pathogenesis of peptic ulcer disease. The use of NSAIDs is the second most common cause of ulcers and the rate of NSAID-caused ulcers is increasing (Ibrahim et al. 2007; Hawkey (1990); Derle et al. 2006). Famotidine is H2-receptor
antagonist widely prescribed in the gastric ulcers, duodenal ulcers, Zollinger-Ellison syndrome and gastro-esophageal reflux disease. Famotidine is reported to be 7.5 and 20 times more potent than ranitidine and cimetidine, respectively. Famotidine
to adhere to the gastrointestinal wall enabling rapid replenishment of the absorbed drug. To circumvent these problems, the drug nanoparticles system treated with mucoadhesive polymers has been proposed. These small particles have ability to penetrate in the mucus layer and bind to underlying epithelium and adhere directly to the mucus network. Thus, it may be expected that the particle uptake into the disrupted barrier in gastric ulcerations could allow the accumulation of the particulate carrier system in the desired area. Hence, subsequent increase in local drug concentration, prolongs the residence time of the drug in the gut and, therefore, increases the time when absorption can occur (Hasani et al. 2009). Hence, the aim of present work was done to formulate and evaluate famotidine mucoadhesive nanosuspension for aspirin induce peptic ulcer treatment to overcome the problem of less contact time in ulceration. Famotidine nanosuspension was prepared using the media milling technique. Box-Behnken design was used to optimize the nanosuspension containing famotidine. The relationship between the dependent and independent variables was constructed using the contour plots. Then, the experimental design was combined with the desirability functions to predict the desired quality. The optimized famotidine nanoparticles were incorporated in physical admixture of mucoadhesive polymers (Hydroxyl propyl methyl cellulose/Sodium carboxymethylcellulose) dispersion to prolong their therapeutic effect. These combined systems were evaluated for mucoadhesion, rheological behavior, in vitro drug release and in vivo study.
MATERIALS AND METHODS
Famotidine was obtained as a gift sample from Cadila Pharmaceutical, Gujarat, India. Polyvinylpyrrolidone (PVPK-30) was purchased from Sisco Research Laboratory, India. Tween-80 and Sodium carboxymethylcellulose (Na-CMC) were gifted by the S.D Fine Chemical Ltd, Mumbai, India. Hydroxyl propyl methyl cellulose-K4M (HPMC-cellulose-K4M) was obtained as a gift sample from the Colorcon Asia Ltd, Goa, India. Double distilled water was prepared in the laboratory. All
the chemicals used in the study were of analytical grade and used without further purification.
Box-Behnken experimental design
A Box-Behnken statistical design with three factors, three levels, and 15 runs was selected for the optimization study (Solanki et al. 2007). The experimental design consisted of a set of points lying at the midpoint of each edge and the replicated center point of the multidimensional cube. The independent and dependent variables are listed in Table 1. The polynomial equation generated by this experimental design (Microsoft excel, 2007) was as follows
Yi=bo+b1X1+b2X2+b3X3+b12X1X2+b13X1X3+b23X2 X3+b11X12+b22X22+ b33X32 [1]
Here, Yi was the dependent variable, b0 was the
intercept, b1 to b33 were the regression coefficients
and X1, X2 and X3 were the independent variables
that were selected from the preliminary experiments. After the fitting of the mathematical model, the desirability function was used for the optimization. The application of the desirability function combined all the responses into one variable and left the possibility to predict the optimum levels for the independent variables (Holm et al. 2006).
Preparation of nanosuspension
Table 1 - Variables and their levels in Box-Behnken design.
Characterization of nanoparticles Particle size and zeta potential analysis
Particle size analysis of the nano-suspension formulations was performed by the photon correlation spectroscopy using a Zetasizer 3000 (Malvern Instruments, UK). The formulations were added drop-wise to the sample dispersion unit containing water (saturated with famotidine) as a dispersant. A refractive index value of 1.5 was used for particle size analysis. Also, zeta potential for the optimized nano-suspension in distilled water was determined using the same equipment. All the data presented are the mean values of the results on three independent samples produced under the identical conditions.
SEM study
The surface morphologies of the micronized famotidine and optimized famotidine nanoparticles were visualized by the SEM. Particle morphology
was investigated using a Hitachi (S-4700, Japan) with an acceleration voltage of 30 kV followed by coating with Pt-Pd for 2 min.
Preparation of famotidine loaded mucoadhesive nanosuspension
Table 2 shows the composition of all the mucoadhesive nano-suspensions. The HPMC-K4M and Na-CMC were dispersed gradually in separate container using double distilled water with slow magnetic stirring (Remi, India). Then, mucoadhesive dispersions were prepared by mixing the weighed quantities of Na-CMC (0.2, 0.4 and 0.6 %w/v) solutions with the HPMC-K4M (0.6, 0.4 and 0.2 %) solutions in 50ml glass beaker left to equilibrate for 24 h. The famotidine nanoparticles were then added to the HPMC-K4M and Na-CMC solution under constant stirring to obtain the uniform mixture and same for their polymer mixtures.
Table 2 - Formulation of famotidine mucoadhesive nanosuspensions.
Ingredients B1 B2 B3 B4 B5 B6 B7 B8 B9 B10
Optimized nanosuspension equivalent to 40 mg of famotidine(ml)
10 10 10 10 10 10 10 10 10 10
HPMCK4M (% w/v) 0.6 0.4 0.2 0.6 0.8 1
Na-CMC (% w/v) 0.2 0.4 0.6 0.6 0.8 1
Volume of aqueous solvent 10 10 10 10 10 10 10 10 10
Stirring Speed( Rpm) 600 600 600 600 600 600 600 600 600 600
Rheological measurement
The viscosity of the mucoadhesive nano-suspensions was determined by the Brookfield viscometer (LV/M/00-151-E0808, MA, USA). Mucoadhesive nanosuspensions were filled in clean and dry test tube (Capacity 25 ml). The viscosity of the mucoadhesive nanosuspensions were determined at various rpm 6, 12, 30 and 60 using spindle no 3 and was calculated using the dial reading with its respective factor in repeated manner.
Mucoadhesion measurement
The shear stress measurement method, based on the measurement of shear stress required to break the adhesive bond between glass slides and the test formulation was used. The test formulation was sandwiched between the two glass slides fixed on flexible supports in the assemblies for a sufficient period of time. Water from a burette was allowed to fall in a beaker at a constant rate of 10 ml/sec. Increasing weight of water added gradually detached the two glass slides. Mucoadhesive force,
Independent Variables Levels
Low Medium High
X1: Amount of zirconium oxide beads(gm) 6 7 8
X2: Amount of PVPK-30 (mg) 40 60 80
X3: Amount of tween-80 (ml) 0.06 0.08 0.1
Transform values -1 0 +1
Dependent variables Y1: Particle size (nm)
the detachment stress (g), was determined from the minimal weights of water that detached the glass slides. The experiments were carried out in triplicates (Verma et al. 2009; Sheikh et al. 2009).
Thermal analysis
The optimized mucoadhesive nanodispersion was centrifuge at 10,000rpm for 10 min and the particle pellet was oven-dried at 50ºC for 24 h. Afterwards, it was used for the DSC analysis. The DSC scans of the famotidine and mucoadhesive nanoparticulate dispersion were recorded using the DSC-Shimadzu 60 (Shimadzu Co., Kyoto, Japan) with TDA trend line software. All the samples were weighed (8-10 mg) and heated at a scanning rate of 20°C/min under dry air flow (100 ml/min) between 50 and 300° C using the aluminum pans and lids for all the samples.
Drug release study
A double- jacketed beaker was used as a dialysis system to study the dissolution behavior of mucoadhesive nano-suspensions. The dissolution medium used was freshly prepared using 0.1 N HCL (pH 1.2). Dialysis membrane, previously soaked overnight in the dissolution medium was tied to one end of a specifically designed glass cylinder (open at both the ends) (Pandya et al. 2010; Lai et al. 2009). Five milliliter of the formulation was accurately placed into this assembly. The cylinder was attached to a stand and suspended in 300 ml of dissolution medium maintained at 37±1°C so that the membrane just touched the receptor medium surface. The contents of the beaker were agitated on a magnetic stirrer. Five milliliter of the sample was withdrawn periodically and replaced with an equal volume of fresh 0.1N HCl (pH 1.2) up to 8h. The samples were diluted suitably and filtered through a filter paper (0.22 µm, Whatman Inc., USA). The sample was then subject to the UV analysis against the blank (0.1NHCl solution). Percent cumulative release of famotidine was calculated based on the standard UV calibration curve at 267 nm (Systronic 2203, Japan).
Ex-vivo retention of mucoadhesive
nano-suspension
Ex-vivo retention of mucoadhesive nano-suspension was adopted from the previously reported method (Rajinikanth et al. 2008). The approval of the Institutional Animal Ethics
Committee was obtained before the starting the study. The stomach of the overnight fasted rats was removed and cut into pieces (2 cm long and 1 cm wide) and were rinsed with 2.0 ml of physiological saline and 5.0 ml of optimized mucoadhesive nanoparticulate dispersion. The nanoparticulate dispersion of drug were placed uniformly on the surface of the stomach mucosa and allowed to react with mucin for 15-20min. The mucosal lumen was rinsed with HCl-physiological saline at angle of 45°. The amount of formulation, which remained coated onto the tissues after rinsing in HCl-physiological saline was determined.
In vivo study
All the animal experiments were carried out in accordance with the recommendations of the Institutional Animal Ethics Committee of Shree Krishna Institute of Pharmacy Shankhalpur, Gujarat, India. Albino rats of both sexes (age:- 10-12 weeks and weighing 200-250 g) were used in all the experiments. Each group of the treated animals contained at least three rats and was housed in standard cages. Disease control (distilled water-10 ml/kg), famotidine marketed suspension (40mg/10ml/kg), and famotidine mucoadhesive nano-suspension (B3) (40 mg/10ml/kg) were arranged in groups 1, 2 and 3, respectively. Distilled water, famotidine and formulation B3
were given orally and 30min later aspirin (200mg/kg-per oral) was administrated to all the groups. Eight hours later, the animals were killed by decapitation. The stomachs were removed, opened along the great curvature and washed with the tap water to remove the gastric contents, then examined under a dissecting microscope with square-grid eyepiece to assess the formation of ulcers. For each stomach, ulcerated and total areas were measured as mm2. The ulcer indexes for each stomach were calculated using the following formula:
Ulcer Index = [Ulcerated area / Total stomach area] * 100
Stability study
The accelerated stability study was carried out according to the International Conference on Harmonization (ICH) guidelines (Shaikh et al. 2009). Sealed vials (10ml) of freshly prepared B3
25°C±2°C/60% relative humidity (RH). The nanoparticles subjected to comparative stability tests were analyzed over three month’s period for physical appearance, particle size and sedimentation of nanoparticles at frequency of 1 month sampling. In vitro release study of formulation B3 was also carried out after every one
month.
RESULT AND DISCUSSION
Box-Behnken design and desirability function
From the preliminary experimentation, it was observed that the amount of the beads, amount of PVPK-30 and amount of tween-80 contributed much towards the change in Y1 andY2 in
nano-suspension preparation using the media milling method. Therefore, Box-Behnken design was applied in this study to optimize the famotidine
nano-suspension with the constraints on the particle size and Q1. The transformed values of all
the batches along with their results are shown in Table 3 (Solanki et al. 2007). The polynomial equations were used to draw the conclusions after considering the magnitude of coefficient and the mathematical sign it carried (i.e., positive or negative). The mathematical relationship in the form of factor’s coefficients, its corresponding P-values for the measured responses and correlation coefficient are listed in Table 4. Coefficients with P-value less than 0.05 had a significant effect on the prediction efficacy of the model for the measured response. The high values of correlation coefficient for the dependent variables indicated a good fit. The particle size (dependent variable,Y1)
obtained at various levels of the three independent variables (X1, X2, and X3) was subjected to
multiple regression to yield a second-order polynomial equation (full model).
Table 3 – Formulation and dissolution characteristics of Box-Behnken design batches.
Run Coded value Actual value Dependent Variables
X1 X2 X3 X1 X2 X3 Y1 (nm ±S.D) Y2(%±S.D)
W21 -1 -1 0 6 40 0.08 742.0±10.80 78.59±1.57
W22 1 -1 0 8 40 0.08 730.0±6.00 83.91±1.83
W23 -1 1 0 6 80 0.08 525.0±10.73 81.09±2.48
W24 1 1 0 8 80 0.08 677.0±9.00 81.18±1.84
W25 -1 0 -1 6 60 0.06 528.0±5.32 82.59±1.99
W26 1 0 -1 8 60 0.06 614.0±7.27 87.19±2.99
W27 -1 0 1 6 60 0.1 448.9±7.32 85.25±3.21
W28 1 0 1 8 60 0.1 463.7±3.99 89.74±2.52
W29 0 -1 -1 7 40 0.06 560.0±5.80 81.67±1.36
W30 0 1 -1 7 80 0.06 394.1±10.16 84.87±3.55
W31 0 -1 1 7 40 0.1 432.5±12.93 88.79±3.71
W32 0 1 1 7 80 0.1 435.7±12.40 85.18±4.77
W33 0 0 0 7 60 0.08 498.0±11.18 85.24±1.28
W34 0 0 0 7 60 0.08 542.0±10.98 84.14±3.41
W35 0 0 0 7 60 0.08 532.0±13.37 83.15±1.96
Y1 is indicating particle size (nm), whereas Y2 is Cumulative percentage release of drug after 1h . X1= amount of amount of
beads, and X2= amount of PVPK-30, X3= amount of Tween-80. Each batch contains 40 mg of famotidine; total quantity of
nanosuspension was made to 10 ml. S.D is indicating standard deviation of the responses measured value.
Y1=
524+30.10X1-54.09X2-39.39X3+41.00X1X2-7.30X1X3+42.30X2X3 +101.29X12+43.20X22
-111.64X32 [2]
The particle size values measured for the different batches showed wide variation (i.e., values ranged from a minimum of 394.1 to a maximum of 742.0). The results clearly indicated that the particle size value was strongly affected by the variables selected for the study. This was also reflected by the wide range of values for the coefficients of the terms of equation 2. The main
effects of X1, X2, and X3 represented the average
result of changing one variable at a time from its low level to its high level. The interaction terms (X1X2, X1X3, X2X3, X1
2
, X2 2
, and X3 2
) showed how the particle size changed when two variables were simultaneously changed. Concerning the particle size, the results of multiple linear regression analysis showed that both the coefficients b1 had
positive sign while b2 and b3 had a negative sign
(R2=0.9673). Equation 2 revealed X1 had the
Among, the interaction terms, only b13 was non-
significant (P >0.05) (Table 4). The significance level of coefficients b12 b13, and b22 was p = 0.052,
0.322, and 0.05 respectively, hence it was omitted from the full model to generate the reduced model. Coefficients b1, b2, b3, b23, b11 and b33 were
significant at p < 0.05 hence, they were retained in the reduced model. The reduced model was tested in portions to determine whether the coefficients b2 and b12 contributed significant information for
the prediction of Y1. The results of testing the
model for ANOVA are shown in Table 5. The observed and predicted values with residuals and percent error of responses for Y1 are shown in
Table 6. The critical value of f = 5.41 (p = 0.05) was higher than the calculated value (F =4.70). It could be concluded that the interaction terms b12
b13, and b22 did not contribute significantly to the
prediction of Y1, and the low coefficients for these
terms in equation 2 indicated that these terms contributed the least to the prediction of Y1.
Hence, these terms were omitted from the full model to obtain a reduced second-order polynomial equation 3 by multiple regressions of Y1 and the significant terms (p < 0.05) of equation
2, Y1 =
524+30.10X1-54.09X2-39.39X3+42.30X2X3+101.29X12- 111.64X32 [3]
Table 4- Summary of regression analysis for measured responses.
Coeffici bo b1 b2 b3 b12 b13 b23 b11 b22 b33 R2
Y1 524 30.1 -54.09 -39.39 41 -17.8 42.3 101.29 43.2 -111.64 0.9673
P-Value 1.1e-06 0.047 0.005 0.018 0.052 0.322 0.048 0.001 0.05 0.001
Y2 84.17 1.81 -0.08 1.58 -1.31 -0.03 -1.71 -0.96 -2.02 2.97 0.9639
P-Value 2.2e-10 0.003 0.821 0.005 0.031 0.956 0.016 0.011 0.009 0.001
Table 5 - Results of ANOVA of full and reduced models for particle size (Y1) and Q1 (Y2).
For Particle size (Y1)
Regression df SS MS R2 p-value Df (3,5)
FM 9 156301.3 17366.81 0.9673 0.0033 Fcalc =4.70/ Ftab =5.41 RM 6 141416.8 23569.47 0.8752 0.002946
Residual df SS MS
FM 5 5272.871 1054.574
RM 8 20157.36 2519.669
For Q1 (Y2)
Regression df SS MS R2 p-value Df (3,5)
FM 9 120.2303 13.35892 0.9639 0.004202 Fcalc =1.27/Ftab =5.41 RM 6 116.7762 19.4627 0.9362 0.000223
Residual df SS MS
FM 5 4.498967 0.899793
RM 8 7.953069 0.994134
Q1 is indicating Cumulative percentage release of drug after 1h.
Table 6 - Observed and predicted values with residuals of the response Y1.
Run Observed Y1(nm) PI ±S.D of Y1 Predicted Y1(nm) Residuals %Errors
W21 742.0±10.80 0.344±0.05 733.4 8.50 -1.15
W22 730.0±6.00 0.384±0.02 711.6 18.30 -2.57
W23 525.0±10.73 0.307±0.01 543.3 -18.30 3.36
W24 677.0±9.00 0.402±0.01 685.5 -8.50 1.24
W25 528.0±5.32 0.227±0.04 505.1 22.85 -4.52
W26 614.0±7.27 0.345±0.06 600.9 13.05 -2.17
W27 448.9±7.32 0.242±0.02 461.9 -13.05 2.82
W28 463.7±3.99 0.374±0.03 486.5 -22.85 4.69
W29 560.0±5.80 0.392±0.03 591.3 -31.36 5.30
W30 394.1±10.16 0.292±0.02 398.5 -4.55 1.14
W31 432.5±12.93 0.311±0.01 427.9 4.55 -1.06
W32 435.7±12.40 0.391±0.05 404.3 31.36 -7.75
W33 498.0±11.18 0.226±0.03 524.0 -26.00 4.96
W34 542.0±10.98 0.361±0.02 524.0 18.00 -3.43
W35 532.0±13.37 0.292±0.02 524.0 8.00 -1.52
This indicated that on increasing X1, Y1 increased.
In the present study, high amount of beads imparted the energy to the system was extensively to break down the particles completely. Therefore, activated regions were generated which might be responsible for agglomeration and hence particle size increase on storage. Therefore, less amount of beads generated the energy imparted to the system was enough to cause the complete particle size reduction. Simultaneously, on other side increasing the amount of PVPK-30 or Tween-80 might decrease the particle size. The small particles, which spontaneously aggregated to decrease the surface energy, were stabilized by a layer of surfactant or/and protective polymer. Less amount of stabilizer induced the agglomeration or aggregation and too much stabilizer promoted the Oswald’s ripening (Patravale et al. 2004; Patel et al. 2010). Particle size was decreased because the freshly created particulate surfaces were immediately coated by a layer of Tween80-PVPK-30, which prevented the broken particles from agglomerating. Concerning Q1, the results of
multiple linear regression analysis showed that both the coefficients b1 and b3 had positive sign
while b2 had a negative sign (R 2
=0.9639). It could be concluded from the equation 4 that X1 showed
the largest positive effect compare to X2 and X3.
Y2=84.17+1.81X1-0.08X2+1.58X3-1.31X1X2-0.03X1X3-1.71X2X3 -0.96X12-2.02X22+2.97X32 [4]
This indicated that on either increasing X1 or X3,
Y2 increased. As discussed earlier for particle size,
small particles surfaces were immediately coated by the layer of surfactant or polymer, which prevented to aggregation. During the dissolution experiments, it was noticed that more amount of PVPK-30 retarded the drug release due to formation of viscous block on to particle surface. The improvement of dissolution rate in nanosuspension was possibly caused by the increased surface area, which enhanced strong hydrophilic character of the drug toward Tween-80 via improvement in wettability of the hydrophobic drug.
Therefore, increasing the amount of the beads or the amount of Tween-80 was expected to increase the drug release after 120 min. The relationship between the dependent and independent variables was further elucidated by constructing the contour plots. The effects of X1 and X2 with their
interaction on particle size at a fixed level of X3
are shown in Figure 1. The plots were linear up to 550nm particle size, but above this value, the plots were nonlinear indicating a nonlinear relationship between X1 and X2. It was determined from the
contour plot that a lower value of particle size (500nm) could be obtained with an X1 level range
from –1 to 0, and an X2 level range from –1 to 0.5.
It was evident from the contour graph that the intermediate level of X1 and X2 favored the
particle size of nano-suspension. When the coefficient values of two key variables, X1 and X2,
were compared, the value for the variable X1
(b1=30.10) was higher, indicating that it
contributed the most to predicting the particle size. The negative effects of X2 on the nano-suspension
decreased the particle size. Figure 2 shows the contour plot drawn at a fix level of X2. The
contour plot of the particle size values were curvilinear and indicated that a 500nm particle size could be obtained for a combination of the two independent variables, the X1 level in the range of
1 to 0, and the X3 level in the range of 0 to 1. The
possible explanation was that the Tween-80 strongly localized at the surface of particles reduced the interface free energy and provided mechanical barrier to coalescence, preventing the aggregation of the particles. Similarly, Figure 3 shows the contour plot plotted at fix level of X1.
The plot corresponding to 500nm was nonlinear, but in a descending pattern with an increase in the amount of the PVPK-30 or Tween-80. The particle size close to 500 nm could be obtained with an X2
level range of –1 to 0 and an X3 level range of 0.5
to 1. All the contour plots for a particle size close to 500nm were nonlinear. This signified that there was no direct linear relationship among the selected independent variables. The aim of the optimization of pharmaceutical formulations is generally to find the levels of the variable that affect the chosen responses and determine the levels of the variable from which a robust product with high quality characteristics may be produced. All the measured responses that may affect the quality of the product should be taken into consideration during the optimization procedure (Holm et al. 2006; Gupta et al. 2010). It was evident from the polynomial equation and contour plots (Figures 1-3) that a high and low level of X1
Figures 1-3 - Contour plot showing the effect of amount of beads (X1), and amount of PVPK-30 (X2)
(1), Contour plot showing the effect of amount of beads (X1), and amount of Tween-80
(X3) (2), Contour plot showing the effect of amount of PVPK-30 (X2) (3) on particle
size(nm).The contour lines show particle size.
Hence, the medium level was selected as optimum for X1. The optimum formulation targeted the
nano-suspension for 500nm particle size and more than 80% drug release within 1h. Using the desirability function and the contour plots shown in Figures (1-3), 0 level for the amount of the beads (X1), a 0 level of the amount of PVPK-30
(X2), and a 0.3 level of the amount of Tween-80
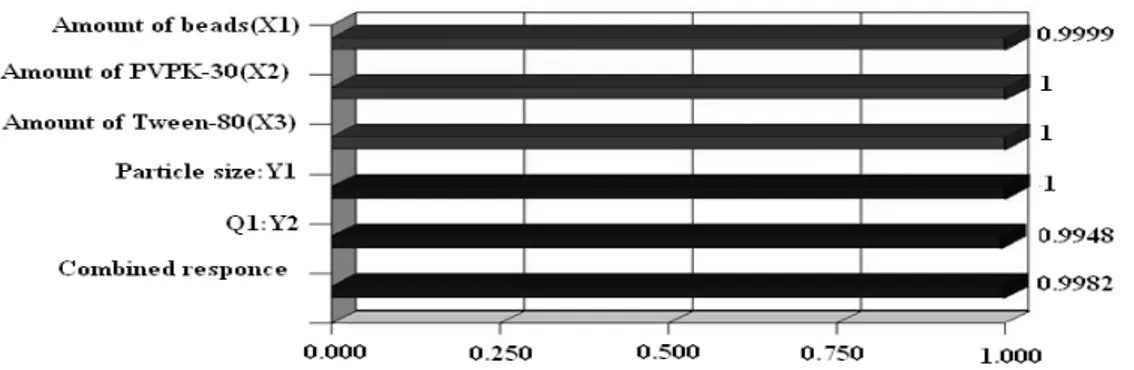
(X3) were selected as optimal. Using the
desirability function, all the defined responses could be combined into one overall response, the overall desirability (Fig. 4). Based on equations (2 and 4), this should be particle size of 500 nm and drug release after 1h (Q1) of 84.96%. These
calculated values were in close accordance with the experimental results obtained. The experimental results led to particle size of 498.5 nm and Q1 of 85.24%.
Characterization of optimized famotidine
nanosuspension
The differences of the two famotidine forms were evident also in the morphological studies done by the SEM (Fig. 5). Micronized famotidine powder showed the particle size generally larger (2.5-50µm) than the famotidine prepared nanoparticles
and had the different morphology. Famotidine micronized suspension crystals showed more irregular elongated shape, while famotidine nanoparticles were more regular and spherical. The media milling of the coarse crystals led to a change of the drug morphology.
Figure 4 - Bar graph showing individual desirability values of various objective responses and their association overall desirability.
Figure 5 - Scanning electron microscopy images of famotidine micronized suspension (a), famotidine optimized nanosuspension (b).
Figure 6 - Zeta potential determination of famotidine loaded optimized nanosuspension.
Rheological behavior
Viscosity plays a vital role in the dispensing and formulation of nanoparticulate mucoadhesive dispersion. In order to treat the peptic ulcers effectively, the lesion should be in contact with the liquid mucoadhesive formulation for the required time. Therefore, the liquid can readily be applied to the affected region of the mucosa and their high viscosity and mucoadhesion will cause liquid to
rates, followed by shear thinning at high shear. Among these formulations, the viscosity was decreased in following order: HPMCK4M/Na-CMC>Na-CMC>HPMCK4M. It was also found that HPMCK4M and Na-CMC showed synergistic effect in viscosity enhancing action. The highest viscosity was recorded for the formulation B3 of
HPMCK4M/Na-CMC (0.2:0.6%). A reduction in
the concentration of HPMCK4M from formulations B1 to B3 without compromising the
rheological properties of the delivery system could be achieved by the addition of viscosity enhancing polymer such as Na-CMC. The HPMCK4M based mucoadhesive dispersions (B4-B6) had fluid like
consistency.
Table 7 - Viscosity profile using spindle no. 3 at different rpm for FAM mucoadhesive nanosuspensions.
rpm B1 B2 B3 B4 B5 B6 B7 B8 B9
6 93.8±2.95 194.8±6.11 232±9.57 83.5±6.62 90.6±5.87 95.6±9.37 89.5±5.87 93.9±9.37 110.9±3.01
12 85.7±1.80 172±7.68 225±8.53 72.9±7.52 76±6.81 81.8±6.98 77.2±6.81 80.1±6.98 85.7±4.46
30 73.9±3.16 147±8.63 203±8.92 59.6±8.08 64.8± .82 69±7.37 65±6.82 71.7±7.37 74.9± 5.71
60 63.7±3.58 115.3±9.96 189±7.88 48.9±7.50 54±8.59 58.3±3.18 58±8.59 59.2±3.18 62.7±9.13
Therefore, these could be readily lost from the point of application in peptic ulcer due to the natural movements of the membrane and surrounding structures. This could be attributed that it was hydrated immediately after the contact with the aqueous medium of nanosuspension. Moreover, it was observed that the increase in the polymer (HPMCK4M) level from 0.6 to 0.8% and to 1% for B4-B6 slightly enhanced the viscosity of
the nano-suspension. Similarly, Na-CMC content was increased in B7-B9 formulations, and
significant change in the viscosity of nanosuspension was observed. This might be due to change in the amount of the polymer from low to high level. More intimate contact between the particle of Na-CMC results in decreased mobility and the increase in resistance of the gel layer to flow and its erosion. In case of the formulations B7-B9, the concentration dependency of the
viscosity was gradual and as concentration was increased, the systems underwent a sol–gel transition and their viscosity was increased proportionally. When amount of Na-CMC was higher than 0.6%, formulations B8 and B9 were
became stiff gels, therefore this could not be able to resuspend the famotidine nanocrytals (Gupta et al. 2010). This finding might suggest that the HPMCK4M hydrated more rapidly than that of HPMCK4M and Na-CMC combination. The formulation B10 did not contain any mucoadhesive
polymer and fluid like consistency. It did not generate sufficient viscosity of formulation so it was not essential to identify its results. Additional benefits were not achieved when micronized suspension had higher viscosity due to their bigger particles. It was noticed that they settled down
rapidly even though higher viscosity of medium. Hence, the particle size was main governing factor for the physical stabilization of mucoadhesive nano-suspension.
Mucoadhesion measurement
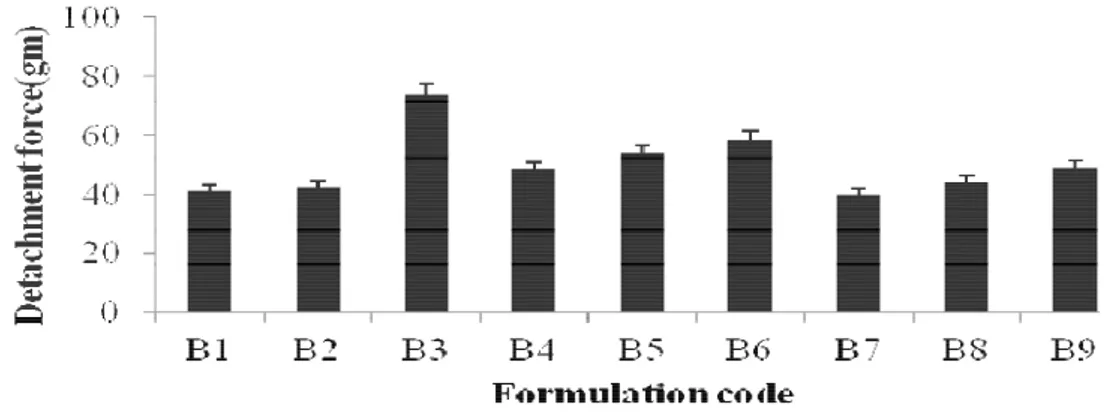
The combination of ionic polymer such as Na-CMC and nonionic polymer such as HPMCK4M is known to provide the formulation with desired mucoadhesive properties (B3) (Singh et al. 2010).
The mucoadhesion characteristics were affected by the mixing ratio of the mucoadhesive polymers. The highest detachment force was observed with the formulation B3 followed by B2 and B1 (Fig. 7).
This type of interaction results from carboxylic groups of Na-CMC and hydrogen binding between the OH groups of HPMCK4M. Thus, HPMCK4M/Na-CMC dispersions might be adhering rapidly in contact with the hydrated mucous membrane. This may be led to increase the adhesive surface for maximum contact with mucin and flexibility for the interpenetration with mucin. It was noticed that mucoadhesion difference between formulations B1 and B2 did not
reach significant level.
Thermal analysis
area. The transformation of a sharp to a broad DSC peak due to the melting of famotidine and decrease in the melting point is associated with
numerous lattice defects and the formation of amorphous regions in which the drug is located (Pople et al., 2006).
Figure 7 - Bar diagram showing mucoadhesive strength determined as the force of detachment (gm) of mucoadhesive nanoparticulate dispersion (B1 to B9).
Figure 7 - DSC thermogram of pure famotidine (A), mucoadhesive nanoparticulate dispersion of famotidine (B).
In vitro drug release study
The cumulative percent of the drug released versus time profiles from the mucoadhesive nanoparticulate dispersion containing HPMCK4M 1% (w/w), Na-CMC 1% (w/w) and binary mixture of HPMCK4M/Na-CMC are shown in Figure 9. The results of drug release studies indicated that B3, B6, and B9 released 28.07, 33.85, and 46.71%
of drug at the end of 1 h and 84.49, 94.05, and 97.70% of drug at the end of 8 h. Among these formulations, the release rate was decreased in the following order: HPMCK4M/Na-CMC>HPMCK4M> Na-CMC. These polymers
an essential first step in achieving the controlled drug release. The results indicated that the formulation B3 had a better ability to retain the
drug than the individual polymer in the mucoadhesive nano-suspension and could be used as sustained release drug delivery system in peptic ulcer. The examination of the correlation coefficient ‘r’ indicated that the drug release followed the diffusion controlled mechanism from the mucoadhesive dispersion (B3), as the values of
‘r’ for zero order (0.9902) were higher in comparison to first order (0.9717) and Higuchi’s
square root of time (0.9858). To confirm the diffusion mechanism, the data were fit into Korsmeyer’s equation. When plotted according to korsmeyer’s equation, the formulation B3 also
showed high linearity (R2 0.9706), with a comparatively slope (n) value of 0.5718. This n value, however, appeared to indicate a coupling of diffusion and erosion mechanisms, the so-called anomalous diffusion (Singh et al.2010). Hence, the diffusion coupled with erosion could be the mechanism for the drug release from B3
formulation.
Figure 9 - In vitro release of famotidine from mucoadhesive nanoparticulate dispersion.
Ex vivo retention study
The mucoadhesive nanoparticulate dispersion (B3)
with highest in vitro mucoadhesivity was compared with famotidine nanoparticles suspension (W33) for ex vivo mucoadhesivity
study. It was remarkable that formulation B3
showed 75.8±3.03% compared to 57.2±1.64% mucoadhesion of famotidine nanosuspension after rinsing with HCl-physiological saline. It was noticed that combination ionic polymer (Na-CMC) with non-ionic polymer (HPMCK4M) potentiate the mucoadhesive strength of famotidine nanoparticles (Singh et al. 2010). It could be attributed that hydrogen bond interaction between Na-CMC and HPMCK4M promote the mucoadhesive nanoparticles to retain after 6 hours on mucus components of tissue.
In vivo study
The disease controlled model in rat after the oral administration of aspirin establishes a stable ulcer for at least two days. This permits the characterization of the in-vivo deposition of the particulate carrier system under the influence of gastritis symptoms. After inducing the gastric ulcer, stomach were opened to get visual evidence
animal was dramatically reduced compared to famotidine suspension treated animal. It was noticed that mucoadhesive nanoparticles with smallest diameter led to highest adhesion compared to the coarse particle of famotidine suspension. This could be attributed to the strong
mucus production in the gastrointestinal tract, especially in the stomach, which favored the particle adhesion to the mucus. Mucoadhesive nanoparticles can better attach to mucus layer due to their small mass.
Figure 10 - Induction of ulcer in rat after administration of aspirin treated as control animal (A),famotidine treated rat stomach (B), mucoadhesive nanosuspension treated rat stomach(C).
Stability study
Stability studies of the prepared nanosuspensions were carried out by storing the formulation B3 and
famotidine nanosuspension at 25±2°C, 65±5% RH in humidity control oven for three months. The change in the particle size of formulation famotidine nanosuspension and famotidine mucoadhesive nanosuspension were investigated as the function of time to determine whether mucoadhesive polymers had better stabilizing efficiency. Famotidine nanosuspension particle size increased to 573.9±5.10, 638.8±8.73 and 734.9±6.30 respectively for each month of the analysis from first to third month.
The crystal growth could be due to Ostwald’s ripening and was avoided by the addition of mucoadhesive polymers. Upon storage, famotidine mucoadhesive nano-suspension had particle size 578.7±7.51, 532.7±4.32 and 528.9±3.41 consecutively for three month analysis. The lower values at third month might be explainable by mucoadhesive polymer having sterically stabilizing effect after adsorption onto particle surface. Since adequate and uniform dosage is a prerequisite for any pharmaceutical suspension, the necessity of controlling the particle sedimentation is obvious. Famotidine nano-suspension showed 0.65±0.3 sedimentation volume (SV) ratio compared to 0.85±0.6 for the famotidine mucoadhesive after three months.
Therefore, the famotidine mucoadhesive nano-suspension sediment was easily redispersed with soft agitation. On the other hand, famotidine nano-suspension was denser and it was more difficult to resuspend the sediment with vigorous shaking. This could be attributed to the particle size of famotidine nano-suspension, which increased due to Oswald’s ripening. The settled particle arranged them into a hard packed cake, which resulted in the failure to obtain good degree of dispersion after three months. In vitro release study of selected mucoadhesive nanosuspension (B3) was
carried out at 25±2°C/65%±5% RH after three months. Famotidine mucoadhesive nanosuspension was released 90.57±2.75% after 8 h. On comparing this data with the previous release data of B3 (Fig.9), it was observed that
there was an overall increase in the drug release. These results could be attributed to the erosion of nanoparticles to some extent during the storage (Mishra et al. 2010).
CONCLUSION
adhesion and prolong drug release characteristic up to 8h. Ex- vivo retention of mucoadhesive nanosuspension was higher compared to nanosuspension. Thus, apparently the surface modification of drug nanoparticles improved the retention of drug particles in upper intestinal tract. Moreover, the formulation was therapeutically effective against aspirin induced peptic ulcer. Mucoadhesive nanosuspension containing famotidine nanocrystals could produce added value by allowing a reduction in ulcer index compared to famotidine suspension.
REFERENCES
Arangoa, MA, Campanero MA, Renedo MJ, Ponchel G, Irache JM. Gliadin nanoparticles as carriers for the oral administration of lipophilic drugs relationships between bioadhesion and pharmacokinetics. Pharm Res. 2001; 18: 1521-1527. Derle DV, Gujar KN, Sagar, B. Adverse effect
associated with the use of non steroidal, anti-inflammatory drug: An overview. Indian. J. Pharm. Sci. 2006;68: 409-414.
Gupta S, Samanta MK, Raichur AM. Dual-drug delivery system based on in situ gel-forming nanosuspension of forskolin to enhance antiglaucoma efficacy. AAPS PharmSciTech, 2010;11:322-335. Hasani S, Pellequer Y, Lamprecht. A Selective
adhesion of nanoparticles to inflamed tissue in gastric ulcers. Pharm Res. 2009;5:1149-1154.
Hassan MA, Suleiman MS, Najib NM. Improvement of the in vitro dissolution characteristics of famotidine by inclusion in β-cyclodextrin. Int. J. Pharm 1990; 58:19-24.
Hawkey, CJ. Nonsteroidal anti-inflammatory drugs and peptic ulcer. British Medicinal Journals, 1990; 300: 278-84.
Holm R, Jensen IH. Sonnergaard J. Optimization of self-microemulsifying drug delivery systems (SMEDDS) using a d-optimal design and the desirability function. Drug Dev. Ind. Pharm 2006:32: 1025-1032.
Ibrahim AA, Rashed S, Rashed Al. Nonsteroidal, anti-inflammatory drug-induced gastrointestinal injuries and related adverse reactions: epidemiology, pathogenesis and management. Saudi J Gastroenterol. 2007:13:107-113.
Lai F, Sinicoa C, Ennas G, Marongiua F, Marongiub G, Faddaa AM. Diclofenac nanosuspensions: Influence of preparation procedure and crystal form on drug dissolution behavior. Int. J. Pharm 2009; 373: 124-132.
Mishra B, Arya N, Tiwari S. Investigation of formulation variables affecting the properties of
lamotrigine nanosuspension using fractional factorial design. DARU. 2010; 18: 1-8.
Patel DJ, Patel, JK. Mucoadhesive effect of polyethyleneoxide on famotidine nanosuspension prepared by solvent evaporation method. Int J Pharm Pharm Sci. 2010; 2:122-127.
Pandya VM, Patel JK, Patel DJ. Improvement in the dissolution of poorly water soluble drug using media milling technique. Thai J Pharma sci. 2010; 34:155-164.
Patravale VB, Date AA, Kulkarni RM.. Nanosuspensions: a promising drug delivery strategy. J Pharm and Pharmac 2004; 56:7, 827-840.
Pople PV, Singh, KK. Development and evaluation of topical formulation containing solid lipid nanoparticles of vitamin A. AAPS PharmSciTech 2006;7:E1-E2.
Rajinikanth PS, Karunagaran LN, Balasubramaniam J, Mishra B. Formulation and evaluation of clarithromycin microspheres for eradication of helicobacter pylori. Chem. Pharm Bull. 2006; 56:1658-1664.
Reddy KR, Mutalik S, Reddy S. Once-daily sustained-release matrix tablets of nicorandil: formulation and in vitro evaluation. AAPS PharmSciTech, 2003; 4:1-9.
Shaikh J, Ankola DD, Beniwal V, Singh, D, Ravi Kumar MN. Nanoparticle encapsulation improves oral bioavailability of curcumin by at least 9-fold when compared to curcumin administered with piperine as absorption enhancer. Eur J Pharm Sci 2009; 37: 223–230.
Singh B, Rani A, Babita, Ahuja N, Kapil R. Formulation optimization of hydrodynamically balanced oral controlled release bioadhesive tablets of tramadol hydrochloride. Sci Pharm 2010; 78: 303-323.
Solanki AB, Parikh JR, Parikh RH. Formulation and optimization of piroxicam proniosomes by 3-Factor, 3-Level Box-Behnken design. AAPS PharmSciTech. 2007; 8: E1-E7.
Verma S, Lan Y, Gokhaleb R, Burgessa DJ. Quality by design approach to understand the process of nanosuspension preparation. Int J. Pharm.2009; 377: 185-198.
Zidan AS, Sammourb OA, Hammad MA, Megrab NA, Habib M.J, Khana MA. Quality by design: Understanding the formulation variables of a cyclosporine a self nano emulsified drug delivery systems by Box–Behnken design and desirability function. Int J. Pharm 2007; 332: 55–63.