16 | Revista GEAMA, 4 (3): 016-021, Set 2018
4
3
Revista GEAMA – Ciências Ambientais e BiotecnologiaScientific Journal of Environmental Sciences and Biotechnology
ISNN: 2447-0740
Avaliação do regime hídrico do solo para a microrregião de Vitória de Santo
Antão – Pernambuco
Evaluation of the soil water regime in the microregion of Vitória de Santo Antão –
Pernambuco
Eberson P. Ribeiro
1, Carolayne S. de Souza
21 Federal Institute of Education Science and Technology of Pernambuco, Pernambuco, Brazil.
2 Federal Institute of Education Science and Technology of Pernambuco, Vitória de Santo Antão, Pernambuco, Brazil.
Todos autores contribuíram de forma igualitária
Palavras-Chave evapotranspiração real balanço hídrico climatológico déficit hídrico
excedente hídrico
O conhecimento da quantidade de água no solo é indispensável para a elaboração do planejamento agrícola eficaz. Assim, o objetivo do presente trabalho foi determinar o regime hídrico do solo para a microrregião de Vitória de Santo Antão. Foram utilizados nesta pesquisa os valores médios mensais da precipitação da série histórica de 1950 a 2015, medidos de 5 estações meteorológicas. Já a obtenção dos dados médios mensais de temperatura do ar foi empregado o software Estima T, o qual estima temperaturas do ar por meio de regressões múltiplas em função das coordenadas locais: longitude, latitude e altitude. A representação espacial dos principais parâmetros deste estudo foi realizada por meio da aplicação da krigagem. O extrato do BHC revelou que a sazonalidade de períodos seco e chuvoso da microrregião afeta os níveis de ETR, DEF e EXC. A ETR apresentou aproximadamente 916 mm/ano, diminuindo gradativa da porção nordeste para sudoeste devido ao aumento da altitude. Já DEF obteve um total de 336 mm/ano, concentrando-se no período de outubro a março, em que a escassez hídrica se localiza principalmente na porção centro-oeste. O EXC deteve um total de 248 mm/ano, restringindo-se aos meses de maio, junho e julho, no qual as porções extremas do nordeste e sudoeste da microrregião são as que apresentaram as mais altas taxas, superiores a 360 mm/ano. A avaliação do regime hídrico do solo para microrregião de Vitória de Santo Antão permitiu conhecer a demanda hídrica do solo em diferentes períodos do ano.
Key-word
real evapotranspiration climatological water balance water deficit
water surplus
ABSTRACTS
The knowledge of the amount of water in the soil is essential for the development of effective agricultural planning. Therefore, the objective of the present work was to determine the soil water regime for the microregion of Vitória de Santo. It was used in this study the mean monthly rainfall values of the historical series from 1950 to 2015, measured from 5 meteorological stations. Since obtaining the average monthly air temperature data was employed Estima_T software, which estimates air temperatures through multiple regressions depending on local coordinates: longitude, latitude and altitude. The spatial representation of the main parameters of this study was performed by applying the kriging. The BHC extract revealed that the dry and rainy seasonality of the microregion affects the levels of ETR, DEF and EXC. The ETR presented approximately 916 mm/year, decreasing gradually from northeast to southwest portion due to increased altitude. DEF has obtained a total of 336 mm/year, concentrating on the period from October to March, where the water scarcity is mainly located in the center-west portion. The EXC had a total of 248 mm/year, being restricted to the months of May, June and July, in which the extreme portions of the northeast and south-west of the microregion are the ones with the highest rates, above 360 mm/year. The evaluation of the soil water regime for the Vitória de Santo Antão microregion allowed to know the water demand of the soil in different periods of the year.
Informações do artigo
Recebido: 09 Julho, 2018 Aceito: 11 Setembro, 2018 Publicado: 30 Setembro, 2018
17 | Revista GEAMA, 4 (3): 016-021, Set 2018
Introduction
The knowledge of the amount of water in the soil is needful for the elaboration of the effective agricultural planning, since excess or water deficiency in the soil are harmful to the agricultural production, causing low productivity and decrease of the production. Second with Cintra; Libardi; Saad (2000), the cyclical movement of the water begins by infiltration in the soil, soon after it is stored in the zone of the root system of the plant and ends up being removed by means of the process of evaporation and evapotranspiration.
Evapotranspiration is the reverse process of precipitation, as it is characterized by the amount of water lost from the soil to the atmosphere added to the transpiration of the plants (MENDONÇA et al., 2003) and is an important component in the performance of the climatological water balance, since contributes to determine the water demand of the soil in a particular location (MONTEIRO et al., 2011).
The climatic water balance (BHC) proposed by Thornthwaite & Matther (1955) enables to perform the measurement of the water system in a location without the need for direct measurement of soil conditions. It can determine the amount of water available for the plants, besides indicating the wet and dry periods within a certain time (TREMOCOLDI & BRUNINI, 2008).
According to Carvalho et al. (2011), the water balance is one of the most used in accounting for surpluses and water deficits tools, spare and ground water withdrawal and allow assess whether the amount present in the ground water is enough to meet the water requirement of the plant. Thus, the objective of this work was to determine the soil water regime from microregion of Vitória de Santo Antão.
Material and Methods
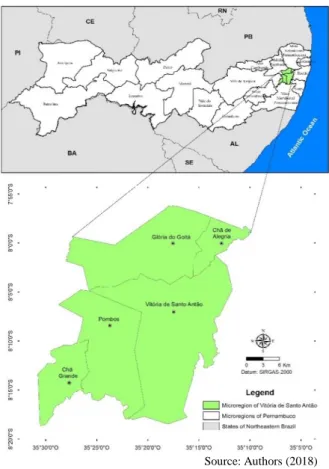
The microregion of Vitória de Santo Antão is located in the center of the Meso region of Zona da Mata de Pernambuco, which is composed of the municipalities of Chã de Alegria, Glória do Goitá, Vitória de Santo Antão, Pombos and Chã Grande (Figure 1).
From the physiographic point of view, the microregion is marked by the relief with surfaces reworked with intense dissection and deep valleys. The vegetation is predominantly subperenifolia forest type, with parts of hypoxerophilic forest.
Latosols-like soils on flat tops, being deep and well drained; Podzolics on steep slopes, little to moderately deep and well drained; and by floodplain gleysoils in the bottoms of narrow valleys, with organic soils and soaked. The climatology of the region is characterized by high annual averages of temperature and evaporation; with rainfall around 1300 mm/year, where the rainy season occurs in autumn / winter, characteristic of Rainy Tropical weather with dry summer (MASCARENHAS et al., 2005).
The elements of rainfall and air temperature were the climatological basis for the elaboration of the parameters studied.
Thus, the mean values of the precipitation of the historical series from 1950 to 2015, measured from 5 stations distributed in the micro-region examined (Figure 2), were used in this study.
The data were obtained through the Agência Pernambucana de Águas e Clima - APAC (Pernambuco State Agency for Water and Climate).
Figure 1 - Map of the location of the microregion of Vitória de Santo Antão
Source: Authors (2018) Figure 2 - Representation of the pluviometric network of microregion of Vitória de Santo Antão microregion
Source: Authors (2018)
It should be noted that faults were filled in the historical series of rainfall stations that presented no data. To this end, the Regional Weighting Method (MPR) of Bertoni and Tucci (2001), expressed in Equation 1:
( ) (1)
wherein: Y is the precipitation of the station to be estimated; x1, x2 and x3 are the precipitations corresponding to the month or year to be filled, observed in three neighboring stations; xm1, xm2 and xm3 are mean precipitations in the three neighboring seasons; and ym as the average precipitation of the point to be estimated.
18 | Revista GEAMA, 4 (3): 016-021, Set 2018
As for getting the monthly average data of air temperature of 5 rainfall stations, it was used the Estima_T software, which estimates air temperatures in the Northeast of Brazil through multiple regressions depending on local coordinates: longitude, latitude and altitude (CAVALCANTI; SILVA; SOUSA, 2006).
As the Climatological Water Balance (BHC) was performed by the Thornthwaite-Mather method (1955) in which the available soil water capacity (CAD) was estimated to be 100 mm for all months of the year, due to soil and climatic characteristics. The BHC used as input data the monthly averages of air temperature, precipitation and potential evapotranspiration. The estimate of corrected potential evapotranspiration consisted of the calculation of Equation 2 by the Thornthwaite method (1948):
a
(2)
wherein: ETP is the corrected potential evapotranspiration; f is the correction factor as a function of latitude and month of the year; t is the average monthly temperature (ºC); I is the annual heat index; and "a" a constant that varies from place to place. The annual heat index was obtained by Equation 3:
∑ ( ) . Being "a" a function of I; is also a regional thermal index calculated by Equation 4:
a = 6.75x10⁻⁷ x I3 –7.71x10⁻⁵ x I2+1.7292x10⁻² x I+0.49239 (4) After obtaining the corrected potential evapotranspiration, the following steps were performed to obtain BHC through the method proposed by Thornthwaite Mather (1955). Firstly, the estimation of soil water storage (ARM), in mm, was calculated using the Equation 5 and 6 criteria for dry seasons and rainy seasons by Equation 7, in the latter case the ARM was the first calculation:
[ ]
being: "m" referring to the analyzed month; P - ETP is the difference between precipitation (P) and potential evapotranspiration (ETP); NegAc is the accumulated negative parameter, which was evaluated by Equations 8 and 9 for dry seasons and by Equation 10 for rainy seasons:
Next that, the real evapotranspiration (ETR) was evaluated by Equations 11 and 12:
The soil moisture change (ALT) was estimated by Equation 13:
From these data, the water deficit (DEF) was evaluated by the difference between potential evapotranspiration (ETP) and actual evapotranspiration (ETR). While for the water surplus (EXC), Equation 14 was used only for the positive values, (P - ETP)> 0 and ARM = CAD. When the value was negative, zero was applied.
Lastly, the replacement estimate (R) was evaluated through Equations 15 and 16:
In possession of the values of the variables analyzed by the BHC, the spatialization was carried out using the software ArcGis 10.3, licensed to the Department of Geographical Sciences of the Federal University of Pernambuco (DCG/UFPE), projected in the Geocentric Reference System for the Americas (SIRGAS-2000), which made it possible to understand the periods of planting and harvesting the main crops with the spaces used.
Results and Discussion
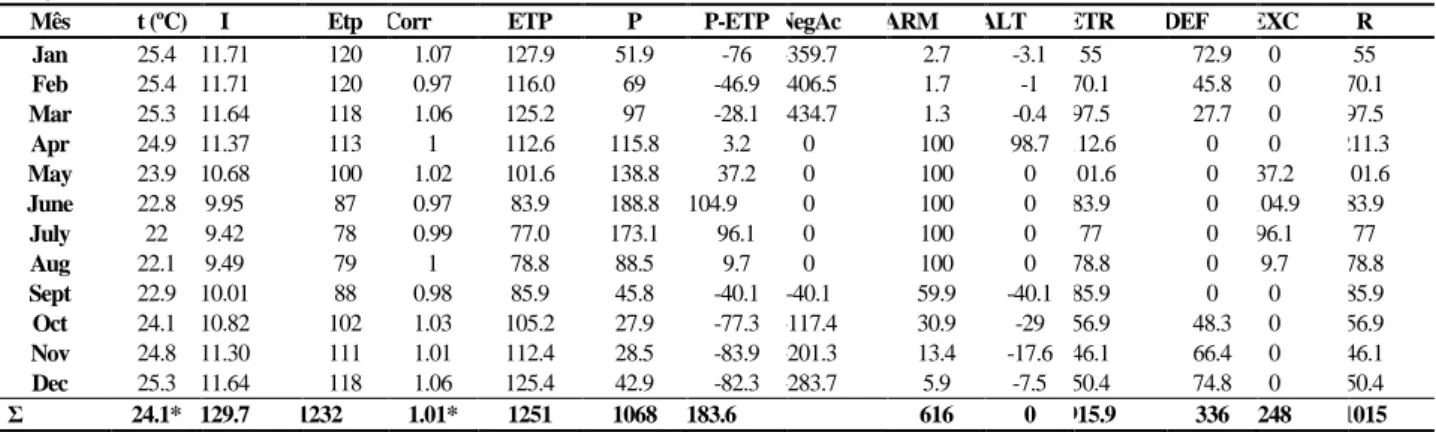
The calculation of the BHC, for the series analyzed, allowed to estimate the levels of ground water storage (ARM), actual evapotranspiration (ETR), water deficit (DEF) and water surplus (EXC).
The BHC results are shown in Table 1, where the mean air temperature is around 24 ° C and the average annual precipitation value is 1068 mm. On the other hand, the ETP, ETR, DEF and EXC variables presented annual mean values of 1,251, 915.9, 336 and 248 mm, respectively.
The micro-region is characterized by high average monthly temperatures, reaching temperatures above 25 ° C and the lowest in July/August with 22 ° C.
In the period of higher average temperatures (above 23ºC) ETP is always above 100 mm from October to May, with an annual total of 1,251 mm. The seasonality of the rainy season occurs between the months of April to July with rainfall above 100 mm/month.
This high rainfall will directly influence the water storage in the soil (ARM) with a maximum capacity (CAD) in the months from April to August (100 mm) and with a total of 616 mm/year.
19 | Revista GEAMA, 4 (3): 016-021, Set 2018
Table 1 - Climatological Water Balance of the Vitória de Santo Antão microregion, according to the method proposed by Thornthwaite-Mather (1955).
Mês t (ºC) I Etp Corr ETP P P-ETP NegAc ARM ALT ETR DEF EXC R
Jan 25.4 11.71 120 1.07 127.9 51.9 -76 -359.7 2.7 -3.1 55 72.9 0 55 Feb 25.4 11.71 120 0.97 116.0 69 -46.9 -406.5 1.7 -1 70.1 45.8 0 70.1 Mar 25.3 11.64 118 1.06 125.2 97 -28.1 -434.7 1.3 -0.4 97.5 27.7 0 97.5 Apr 24.9 11.37 113 1 112.6 115.8 3.2 0 100 98.7 112.6 0 0 211.3 May 23.9 10.68 100 1.02 101.6 138.8 37.2 0 100 0 101.6 0 37.2 101.6 June 22.8 9.95 87 0.97 83.9 188.8 104.9 0 100 0 83.9 0 104.9 83.9 July 22 9.42 78 0.99 77.0 173.1 96.1 0 100 0 77 0 96.1 77 Aug 22.1 9.49 79 1 78.8 88.5 9.7 0 100 0 78.8 0 9.7 78.8 Sept 22.9 10.01 88 0.98 85.9 45.8 -40.1 -40.1 59.9 -40.1 85.9 0 0 85.9 Oct 24.1 10.82 102 1.03 105.2 27.9 -77.3 -117.4 30.9 -29 56.9 48.3 0 56.9 Nov 24.8 11.30 111 1.01 112.4 28.5 -83.9 -201.3 13.4 -17.6 46.1 66.4 0 46.1 Dec 25.3 11.64 118 1.06 125.4 42.9 -82.3 -283.7 5.9 -7.5 50.4 74.8 0 50.4 Ʃ 24.1* 129.7 1232 1.01* 1251 1068 -183.6 616 0 915.9 336 248 1015
Legend: t = Air temperature; I = Thermal index; ETp = Evapotranspiration; Corr = Correction factor; ETP = potential evapotranspiration; P = Precipitation; P-ETP = Amount of water remaining in the soil (Potential Evapotranspiration Precipitation); NegAc = Accumulated negative; ARM = Soil water storage; ALT = Change of soil moisture; ETR = Real evapotranspiration; DEF = Water deficit; EXC = Water surplus; and R = water replenishment. *arithmetic mean.
Source: Authors, 2018 The water deficit (DEF) totaled 336 mm annually,
concentrating on the period from October to March, with a more intense summer deficit. The water surplus is restricted to the months of May, June, July and August, with an annual total of 248 mm. In the month of April there is no surplus or water deficit. In that month, the water supply was approximately 211 mm, the highest monthly rate; the annual replacement was 1015 mm.
To assess the spatiality of the soil water regime of the microregion of Vitória de Santo Antão, real evapotranspiration (ETR) was analyzed. Thus, Figure 3 shows spatial distribution of the annual ETR defined by Matzanauer (2014) as process water transfer into the atmosphere by evaporation and transpiration under actual conditions of atmospheric factors and soil moisture.
It is noted that the ETR presented averages ranging from values below 860 mm and above 980 mm, gradually decreasing from the northeast to southwest portion of the micro-region, in which the municipality of Chã de Alegria presented the highest averages.
Figure 3 - Map of the real evapotranspiration of the microregion of Vitória de Santo Antão.
Source: Authors (2018)
As Figure 4 expresses the spatial distribution of DEF, which identified greater water scarcity in the Midwest of the studied locality portion (>360 mm/year), reducing the deficit gradually in the southwest direction with rates of less than 240 mm/year. This behavior occurs due to the lower precipitation rates in the central portion of the microregion.
Figure 4 - Map of the water deficit of the microregion of Vitória de Santo Antão.
Source: Authors (2018) This configuration of the ETR is due to the high air temperatures and rainfall in the northeast of the surveyed area, while in the southwest portion, despite the high rainfall, the ETR decreases because the temperatures diminish as the altitude increases w ith the first foothills of the fault escarpment of the Borborema plateau.
In the monthly spatial representation of DEF, shown in Figure 5, it can be seen that the highest disability rates occur in the months from October to March, and the North and Northeast of the micro-region most affected areas, with disabilities greater than 21 mm. The months that showed the highest values of DEF, January had the highest average 81-100 mm class in almost all studied territory.
20 | Revista GEAMA, 4 (3): 016-021, Set 2018
As for the lower values, rates of less than 40 mm, are among the period from April to September.
The DEF oscillations are related to periods of higher and lower air temperatures and precipitation. Since the soil water loss is due to the influence of temperature, through the evapotranspiration process, as well as the decrease of precipitation.
Nobre & Assad (2005) and Marengo et al. (2011) explain that the increase in temperature influences the loss of soil moisture, as a consequence of increased evaporation and evapotranspiration, causing water deficiency and changes in the hydrological cycle.
Figure 5 - Monthly water deficit maps the microregion of Vitoria de Santo Antao.
Source: Authors (2018) In Figure 6 is shown the spatiality of EXC, wherein the extreme portions of the northeast and southwest had higher rates to 360 mm, for presenting the highest rainfall.
While in the central region of the microregion the values were below 240 mm, predominating this index by the area. In Figure 7, the monthly water surplus (EXC) is represented spatially.
It can be observed that in the period from September to April, in every cut studied, no EXC was obtained. In the period from May to August, EXC was observed, with rates predominantly higher than 80 mm in the months of June and July, reaching values up to 180 mm in the northeast and southwest portions. In the month of August, only the southern and southwestern portions presented EXC between 21 and 60 mm, being in the majority of the microregion inferior to 20 mm.
Figure 6 - Map of the water surplus of the microregion of Vitória de Santo Antão.
Source: Authors, 2018 Figure 7 - Monthly water surplus maps of the microregion ofVitória de Santo Antão
Source: Authors (2018) . It is observed that the highest values of EXC occur in the same period in which the rainfall indexes are also high, as seen in Table 1.
21 | Revista GEAMA, 4 (3): 016-021, Set 2018
This behavior is due to the water gain in a given volume of soil during rainy periods. Since small EXC presents rates that are related to high thermal indices, which provides evapotranspiration, consequently, the loss of water from the soil into the atmosphere.
Souza et al. (2006) explains that the availability of water in the soil is influenced by thermal fluctuations and the spatial-temporal distribution of precipitations.
Soil water gain consists basically of rainfall, while losses are from percolation, evapotranspiration and surface and subsurface runoff.
Conclusions
The evaluation of the soil water regime for the Vitória de Santo Antão microregion allowed to know the water demand of the soil in different periods of the year.
The indexes of DEF and EXC presented variations according to the seasonality of the dry and rainy periods. The DEF has its highest indexes in the months that have high temperatures and low pluviometric volumes occurring the reverse with the EXC.
The oscillations of these factors indicate that the largest volume of water in the soil is concentrated in the rainy months, May, June and July, with the cities of Chã de alegria and Chã Grande with the highest rainfall volumes.
The water scarcity occurs in the period from October to March, concentrating in the center-west portion of the microregion and decreasing gradually in the southwest direction, coinciding with the behavior of the ETR that also decreases in this sense due to the fall of the temperature caused by the increase of the altitude in this region.
The analyzed data indicate that the microregion of Vitória de Santo Antão has water deficit in the spring/summer period due to the high temperatures, consequently the high evaporative rates, and the low rainfall indexes. Such behavior may jeopardize agricultural production in the region if there is no irrigation planning.
This way, as a result of the results of this study, it is recommended the adequate irrigation management for the productive areas of the microregion of Vitória de Santo Antão, as support to supply the amount of water in the soil in dry periods and avoid excess water in the soil in the period when the soil is well supplied with water.
Acknowledgments
This work was supported by the Federal Institute of Education, Science and Technology Pernambuco (do Instituto Federal de Educação, Ciência e Tecnologia de Pernambuco IFPE) and the National Scientific and Technological Development Council (Conselho Nacional de Desenvolvimento Científico e Tecnológico CNPq).
References
BERTONI, C. J.; TUCCI, C. E. M. Precipitação. In: Carlos Eduardo Morelli Tucci. Hidrologia: ciência e aplicação. 2. ed. Porto Alegre: Editora Universidade/UFRGS: ABRH, 2001.
CARVALHO, H. P. et al. Balanço hídrico climatológico, armazenamento efetivo de água no solo e transpiração na cultura de café. Biosci. J., 27 [2], 221-229, 2011.
CAVALCANTI, E. P.; SILVA, V. P. R.; SOUSA, F. A. S. Programa computacional para a estimativa da temperatura do ar para a região Nordeste do Brasil. Revista Brasileira de Engenharia Agrícola e Ambiental, 10 [1], 140 – 147, 2006.
CINTRA, F. L. D.; LIBARDI, P. L.; SAAD, A. M. Balanço hídrico no solo para porta-enxertos em citros para ecossistemas em tabuleiros costeiros. Revista Brasileira de Engenharia Agrícola e Ambiental, 4 [1], 23-28, 2000.
MASCARENHAS, J. C. et al. Projeto cadastro de fontes de abastecimento por água subterrânea. Diagnóstico do município de Vitória de Santo Antônio, estado de Pernambuco. Publicado no CPRM/PRODEEM, 2005. MARENGO, J. A. et al. Variabilidade e mudanças climáticas no semiárido brasileiro. In: Variabilidade e mudanças climáticas no semiárido brasileiro. 1 ed. Campina Grande: Instituto Nacional do Semiárido, p. 383-416, 2011.
MATZENAUER R. Evapotranspiração de plantas cultivadas e coeficientes de cultura. In: Homero Bergamaschi (Coord.). Agrometeorologia regimes de precipitação em Pernambuco. 19. ed. Botucatu: Editora Irriga, p. 46 – 60, 2014.
MENDONÇA J. C. et al. Comparação entre métodos de estimativa da evapotranspiração de referência (ETo) na região Norte Fluminense, RJ. Revista Brasileira de Engenharia Agrícola e Ambiental, 7 [2], 275-279, 2003.
MONTEIRO, R. N. F. et al. Balanço hídrico climatológico e classificação climática de Thornthwaite para o município
de Groaíras-CE. ABID, 2011. Disponível:
https://www.alice.cnptia.embrapa.br/bitstream/doc/910333/1/ 1009.pdf.
NOBRE, C. A.; ASSAD, E. D. Aquecimento Global e o Impacto na Amazônia e na Agricultura Brasileira. INPE
Eprint, 2005. Disponível:
http://www.sid.inpe.br/ePrint@80/2005/09.12.12.51. SOUZA, M. J. H. et al. Disponibilidade hídrica do solo e produtividade do eucalipto em três regiões da bacia do Rio Doce. R. Árvore, 30[3], 399-410, 2006.
TREMOCOLDI, W.A.; BRUNINI, O. Caracterização agroclimática das unidades da Secretaria de Agricultura e Abastecimento do Estado de São Paulo: Capão Bonito e região. Pulblicado no boletim técnico do Instituto Agronômico de Campinas, 2008.
THORNTHWAITE, C. W. An approach toward a rational classification of climate. Geographical Review, New York, 38, 55 – 94, 1948.
THORNTHWAITE, C. W.; MATHER, J. R. The water balance. Centerton, N. J.: Drexel Institute of Technology, Laboratory of Climatology, publications in Climatology, 8 [1], 104, 1955.