Contents lists available atScienceDirect
Journal of Manufacturing Processes
journal homepage:www.elsevier.com/locate/manproMonitoring of the mechanical load and thermal history during friction stir
channelling under constant position and constant force control modes
Catarina Vidal
a,b,*
, Virgínia Infante
c, Pedro Vilaça
daInstituto Superior Técnico, Universidade de Lisboa, Lisboa, Portugal
bUNIDEMI, Departamento de Engenharia Mecânica e Industrial, Faculdade de Ciências e Tecnologia, Universidade Nova de Lisboa, Caparica, Portugal cLAETA, IDMEC, Instituto Superior Técnico, Universidade de Lisboa, Lisboa, Portugal
dDepartment of Mechanical Engineering, School of Engineering, Aalto University, Espoo, Finland
A R T I C L E I N F O Keywords:
Friction stir channelling Process control
Temperature measurements
A B S T R A C T
In the present investigation, constant position and constant force process control modes; and representative process temperature measurements were analysed during the application of the friction stir channelling process. The experimental tests were carried out using rolled plates of AA5083-H111 with thickness of 15 mm. Results show that the FSC process was found not stable during the forward traverse movement stage when it is per-formed via position control. For both control modes, the tool was subjected to a more severe loading during the initial plunge than during the channelling period. Moreover, it was found that the tool vertical position is not significantly affected during the channelling stage when the process was force controlled. From the temperature measurements carried out, it was recorded a maximum process temperature of about 330 °C.
1. Introduction
The friction stir channelling (FSC) manufacturing technology, pa-tented initially by Mishra [1] as a solid-state technique to manufacture heat exchangers, is one of the most promising innovations based on the friction stir concept. FSC makes use of a non-consumable tool, similar to that used to carry out the friction stir processing (FSP) and friction stir welding (FSW) technologies, to manufacture, in a single step, con-tinuous channels into monolithic metal components.
As in all the friction stir based techniques, a viscoplastic solidstate region is created and processed [2]. In FSC technique part of the vis-coplastic material is extracted from the interior of the base material being processed by the non-consumable tool, generating an amount of burr similar to the volume of the channel produced [3].
Mishra [1], developed a procedure based on the presence of a gap between the tool shoulder and the component being processed in order to deposit the material extracted into it. Mishra [1] considered that this clearance, between the metal workpiece and the tool shoulder, is the main difference between the FSC and the conventional FSW or FSP procedures where the base of the tool shoulder is held in touch with the top surface of the metal workpiece to generate the forging action quired to produce defect-free processed components. The channel re-sults from the application, in the viscoplasticised workpiece material, of an upward action along the threaded probe, that moves the material
from the base of the tool probe to the surface depositing it under the base of the tool shoulderfilling the clearance.
In 2011, Vidal and Vilaça [3], further developed the process with a different material flow promoted by the tool. Without any clearance between the tool shoulder and the solid component a well-defined amount of processed material flows out from the viscoplastic region creating the internal channel. Consequently, the processed material from the interior of the monolithic component is not deposited on its top outer surface but removed from the processed zone as self-detach-able burr. The geometry of the tool shoulder promotes this material flow via its scrolls that have that capability of removing the processed material from the shoulder center to the periphery of the processed region. The significant difference from this step forward [3], compared to [1] is that the channel is no longer the amplification of the tunnel defect originally known in FSW (produced with defective conditions), and became a controllable process where it is now possible to design the channels in a wide range of dimensions, assuring the closing of its top in one action. In [1], the size of the channel is limited by the fact that no large gaps are admissible between the shoulder and the surface of the base materials, in order to be possible to keep the vertical forging load applied by the shoulder, that closes the top of the channel left open by the travel of the rotating probe.
Afterwards, Rashidi et al. [4] proposed a concept of conducting the FSC process with a non-threaded probe with a certain tilt angle and a
https://doi.org/10.1016/j.jmapro.2019.11.016
Received 10 April 2019; Received in revised form 18 October 2019; Accepted 18 November 2019
⁎Corresponding author at: Instituto Superior Técnico, Universidade de Lisboa, Lisboa, Portugal.
E-mail address:c.vidal@fct.unl.pt(C. Vidal).
Available online 13 December 2019
1526-6125/ © 2019 The Society of Manufacturing Engineers. Published by Elsevier Ltd. All rights reserved.
gap between the shoulder and the component being processed. But because the approach is based on the same gap presented by [1], be-tween the shoulder and the top surface of the base material being processed, the size of the channels is also limited.
Balasubramanian et al. [5] validated the applicability of the FSC technique to produce continuous channels, along linear and curved paths, inside 5 mm-thick monolithic plates of AA6061-T6. In this study, three different tools with cylindrical probes and left-handed threads (LHT) were used. The process parameters: tool rotation speed, tool travel speed and the plunge depth were varied in order to maximise the channel size with no visible surface defects. The authors have found that it is possible to modify the channel geometry changing the pro-cessing parameters (tool rotation speed and tool travel speed) and the tool probe features.
In order to investigate the effect of the process forces during the FSC process, Balasubramanian et al. [6] have used three different tool probe profiles and four different processing conditions by varying the tool rotation speed and the tool travel speed. Concerning the process forces, it was shown that it is possible to predict the formation of channels in the nugget knowing the position of the net force acting on the tool during the process. Although Balasubramanian et al. [6] state that all the channels produced are stable and continuous, a study was later published questioning that stability. Rashidi et al. [4] claim that the stability of the channels can be solved using a non-threaded tool probe because this has the ability of maintaining the materialflow constant during the process. Another study was published by Rashidi et al. [7], investigating the materialflow using the broken tool probe technique in order to understand the channel formation. In 2019, Pandya et al. [8] have used X-ray micro computed tomography and optical microscopy to study the material flow during the FSC process. These authors have identified five different material regions and considered that the tool probe and shoulder have influence in all of them. They have also found that the influence of the tool shoulder on the channel formation in-creases along with the channel length. Channels produced by FSC and tested by Karvinen et al. [9] were able to withstand an internal pressure up to 380 bar and results using air as cooling media showed that the FSC enhanced the heat transfer by about 45 % compared with smoother milled channels. A recent addition to these techniques is the Hybrid Channelling (HC), which enables simultaneous welding and channel-ling, in one action, of multiple metal components from similar or dis-similar materials and geometries. Karvinen et al. [10] evaluated HC in the production, of a channel and a joint between overlapping alumi-nium plates made of dissimilar thicknesses, and dissimilar material plates made of aluminium and copper. An application of HC technique to improve the cooling efficiency of electronic components is presented by Karvinen et al. [11], reporting a 30–40% lower steady-state tem-perature and 33 % higher cooling rate during the transient period than milled cannels.
The FSC process is thus very demanding as concerns its control and tooling, however, can be a breakthrough technology to produce con-formal channels, presenting distinctive advantages compared with conventional drilling and milling technologies when dealing with complex paths. Although drilling is the number one hole making technology all over the world, due to its low cost, high productivity and simple procedure, it is limited to perform straight hole paths. In con-trast, channels produced by FSC can have any path and variable di-mensions along the path. Regarding the milling technology, whereas the FSC has the ability of produce internal channels, milling can only manufacture open channels that demands additional operation to close it. In the case of industrial applications, FSC can produce internal channels in a solid component in one single run. On the other hand, milling creates open channels and to produce internal channels it needs to produce the channels in two runs (steps) in two different workpieces and then subsequently join them. Therefore, this innovative technology warrants further investigation in order to be eventually introduced in the industry. Herein, FSC process control modes and temperature are
investigated. The main FSC process stages are identified and detailed described for both control modes (position and force). The temperature during the FSC process was measured using embedded thermocouples and infrared thermography.
2. Material and methods
2.1. Material
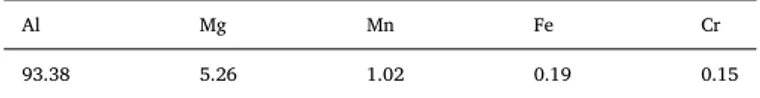
AA5083-H111 having 15 mm-thick plates were used for the present investigation. The chemical composition and mechanical properties of AA5083-H111 are presented inTables 1 and 2, respectively.
2.2. FSC tests and equipment
Friction stir channelling tests were performed using an ESAB LEGIO™ 3UL numeric control machine. An internal refrigeration system makes possible to water cool the welding spindle shaft and the tool. The welding process can be controlled either by force or position control, both on the vertical Z-axis. The processing parameters such as welding position, tool force, tool rotation (value and direction), plunge speed, dwell time and welding speed are set using the control panel. Network connected with the equipment there is a dedicated data acquisition system that monitors in real time and records information about the processing parameters.
A modular non-consumable friction stir tool was used in this work. The tool body, shoulder and probe are independent components al-lowing different combinations shoulder/probe designs. The tool was clamped to the equipment into the welding head and, its linear path, on the XY plane, was previously defined through the control panel.
Table 3presents the main advantages and disadvantages of FSC in comparison to two alternative techniques: drilling and milling. From the analysis ofTable 3, it is possible to understand the relevance of developing the FSC process.
Although less demanding than FSW in terms of the workpiece constraint, clamping the workpiece on the worktable of the equipment is required to avoid its warping. Four steel step clamps (DIN 6314Z– 14 × 160) were used tofix the workpiece as illustrated inFig. 1. A vertical clamping system was found to be adequate to constrict all degrees of freedom during the channelling process.
Four different tool probes with left-handed threads (Table 4) and four different tool shoulders (Table 5) were used for the tests carried out. All tool components were made of H13 steel.
In order to understand and evaluate the time-evolution of some process parameters during channelling controlled either by position or force and the effect of the process control mode on the non-predefined parameters, four tests were carried out as described inTable 6.
To investigate the influence of tool rotation and travel speeds on the average vertical force during the forward traverse movement stage, a set of six FSC tests was carried out as listed inTable 7, keeping the process pitch (as defined by Eq. 1) constant. A tool, comprising a 6mm-length tool probeC and a tool shoulder E, tilted 0°, was used for all the Table 1
Chemical composition of AA5083-H111, % weight [12].
Al Mg Mn Fe Cr
93.38 5.26 1.02 0.19 0.15
Table 2
Mechanical properties of AA5083-H111 [12].
E (GPa) Yield stress (MPa) Ultimate tensile stress (MPa) Elongation (%)
runs. Channels were produced via vertical position control at a depth of 5 mm and a process pitch of 0.25 mm/rev. Both, the pseudo heat index (PHI) and the process specific energy, were calculated for each FSC test according to Balasubramanian et al. [13]. The units selected to present the PHI values are the same than those used by Balasubramanian et al. [13], aiming the comparison of the results.
=
Processpitch mm rev v mm min
ω rev min
[ / ] [ / ]
[ / ] (1)
In order to understand the effect of the tool rotation speed and tool travel speed, separately, on the vertical force, FSC tests were carried out as listed in Table 8, using an 8mm-length tool probe E and a tool shoulder iSTIRcut with two scrolls, via vertical position control at a depth of 7.5 mm.
2.3. Temperature measurements
Temperature measurements were performed using six N-type ther-mocouples with a diameter of 0.2 mm, capable of measuring tem-peratures up to 1200 °C, with an accuracy of ± 1.5 °C. Small holes with a diameter of 2 mm were drilled in order to accommodate the ther-mocouples. Two different layouts were devised to measure the tem-perature field along the channelling direction and the temperature distribution along the width direction of the workpiece. To measure the temperaturefield along the channelling direction, the thermocouples were placed at 5 mm from the tool shoulder outer diameter on both, advancing and retreating, sides, in the beginning, middle and at end of the channel as shown inFig. 2.
To record the temperature distribution along the width direction of the workpiece, the thermocouples were placed at 5, 15, 25, 35, 45 and 55 mm from the tool shoulder outer diameter on the retreating side, in
the middle of the channel as shown inFig. 3.
As depicted inFigs. 2 and 3, grooves were machined to prevent the thermocouple from being crushed by the clamp. The sensing head of the thermocouples is approximately 1 mm-long and the holes used to ac-commodate the thermocouples have a depth of 11 mm from the workpiece surface, which means that the tip of the thermocouple is located at the middle of the tool probe length when the tool passes by the thermocouples. A thermo-conductive paste was added to attach the thermocouples into the holes and to improve conductivity. Therefore, the thermocouples were securely embedded in the holes and the tem-perature could be measured correctly without any external dis-turbances.
The measurements were recorded, at a 10 Hz acquisition frequency, using two NI 9211 thermocouple input modules installed in a NI Compact DAQ connected to a computer running the LabVIEW Signal Express™ software.
Additionally, surface temperature measurements were performed with a FLIR A300 infrared camera. This equipment has a thermal sen-sitivity of 0.05 °C and an accuracy of ± 2 °C. An appropriate paint was applied to the surface of the plates and a surface emissivity of 0.95 was set for all the temperature measurements. The thermal imaging camera was placed at a distance of 1 m away from the workpiece, aligned with the tool path.
All temperature measurements were obtained for a single FSC set of parameters– condition L1 (Table 9).
3. Results and discussion 3.1. Process control
As specified in Section2.2, the equipment used allows controlling Table 3
Advantages and disadvantages of drilling, milling and FSC technologies.
Technology Advantages Disadvantages
Drilling
•
Smooth straight hole paths•
Low cost•
Fast production process•
Cannot produce curved hole paths•
Limited to produce long straight hole paths•
Need to pluge the end of hole in continuous holes Milling•
Straight and curved open channel•
Several paths with desired depth•
Fast production process•
Cannot produce closed channels to use in hea exchangers and conformal cooling applications FSC•
Straight and curved closed channel•
Enable to produce internal channel with desired path•
Fast prduction process•
High roughness of channels’ internal surfaces•
High roughness offinal outer processed surface•
High roughness of channels’ internal surfacesthe channelling process either by force or position control, both on the vertical Z-axis. Typically, it is applied position control during the plunge and dwell periods, switching to force control at the start of the forward traverse movement. Usually, position control during the travel period is employed in the first stage of preliminary tests to find an average force, the value of which will be further used when switching to force control. Both process control modes are hereinafter presented and discussed.
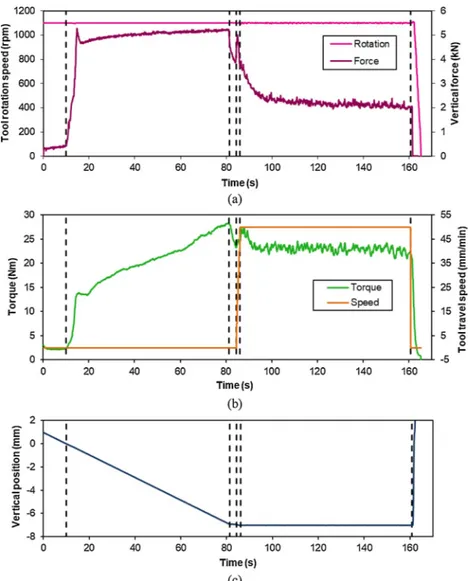
Fig. 4shows the time-evolution of some process parameters during a
FSC test performed with an 8mm-length tool probe H and a tool shoulderN at a tool travel speed of 50 mm/min and a tool rotation speed of 1100 rpm via position control.
As depicted inFig. 4, the FSC process is divided into six different stages:
1) Tool probe’s downward movement – [0,10]s; 2) Tool probe’s plunge – [10, 81.4]s;
3) Dwell time– [81.4, 84.4]s; 4) Tool’s speed-up – [84.4, 86.1]s;
5) Tool’s forward traverse movement (channelling) – [86.1, 160.8]s; Table 4
Tool probe thread profiles.
Probe ID C E G H
Maximum probe length (mm) 10 20 8 8
Thread profile
Table 5
Tool shoulder geometries.
Scroll profile
Number of scrolls and pitch
Shoulder ID
iSTIRcut N E M
Table 6
FSC process parameters. Effect of the process control mode on the non-pre-defined parameters. Control mode Tool travel speed Tool rotation speed Vertical position Vertical force Tool shoulder Tool probe Position 50 mm/ min 1100 rpm 7 mm - N H with a length of 8 mm Force - 2 kN Position 100 mm/ min 400 rpm 7 mm Force - 4 kN Table 7
FSC process parameters. Effect of the tool rotation speed and tool travel speed on the vertical force for a process pitch of 0.25 mm/rev.
Test ID Tool travel speed (mm/min)
Tool rotation speed (rpm) FSC_01 150 600 FSC_02 180 720 FSC_03 200 800 FSC_04 250 1000 FSC_05 300 1200 FSC_06 350 1400 Table 8
FSC variable parameters. Effect of the tool rotation speed and tool travel speed on the vertical force.
Tool travel speed (mm/min)
Tool rotation speed (rpm)
600 800 1000
100 Not tested (N.T.) N.T. Tested
150 Tested Tested Tested
160 N.T. N.T. Tested
6) Tool’s exit – [160.8, 165.3]s.
After the machine develops the torque necessary to reach a tool rotation speed of 1100 rpm, in thefirst stage it starts to move down-ward along the Z-axis todown-wards the metal workpiece. During the second stage, the non-consumable rotating tool is plunged into the solid metal workpiece at a constant plunge speed of 0.1 mm/s up to match a pre-defined depth of 7 mm. Within this stage, the vertical force suddenly increases up to a maximum value of 5.3 kN, dropping immediately to 4.6 kN. After that, the vertical force slightly increases from 4.6 to 5.2 kN. While the tool is plunging into the metal workpiece, the torque increases up to a maximum value of 28.4Nm. During the third stage, the proper thermo-mechanical conditions are established. Within the dwell time, both the vertical force and torque decrease to values of 3.9 kN and 23.3Nm, respectively. After that, the tool speeds up to reach a tool travel speed of 50 mm/min and begins the forward traverse movement along a predetermined linear path. During this stage, both the vertical force and torque further decrease until stabilising at constant levels of 2
kN and 23Nm, respectively. It can be observed that the torque has stabilised faster than the vertical force. The process ends with the exit of the tool probe.
Regarding a FSC test performed with the same process parameters and tool than the previous one, but force controlled during the tool’s forward traverse movement, the following analysis can be drawn by the observation of the graphs presented inFig. 5.
Similar to the FSC test performed via position control, the process can be divided into the same six stages. Noticeable differences were observed on the transition from the dwell time to the tool’s speedup stage, as illustrated inFig. 6for the vertical force. During the dwell time, the torque sharply decreased from a maximum value of 30 to 18.6Nm, in 3 s. After that, the torque increased again, during thefirst 14 s of the tool’s forward traverse movement stage, until stabilised at 26Nm; although, a slightly decrease can be observed during the latest 35 s. Regarding the vertical force, it is possible to verify that it de-creases about 4 kN during the short dwell time (3 s) and then remains constant until the end of the channelling process, as previously Fig. 2. Schematic representation of the thermocouples’ layout for temperature measuring along the channelling direction.
Fig. 3. Schematic representation of the thermocouples’ layout for temperature measuring along the width direction of the workpiece.
Table 9
FSC set of parameters of condition L1.
Tool travel speed Tool rotation speed Vertical force Tool shoulder Tool probe
imposed.
Additionally, it is possible to observe that the tool is subjected to a more severe loading during the initial plunge compared with the for-ward traverse movement stage. The local maximum value of the ver-tical force at time instant t=14 s can be explained by the demanding compression and shear stress of the workpiece material that is work-hardened [14].
In order to understand whether performing the channelling stage under force control significantly affects the channel’s depth along the path, the tool probe vertical position, monitored during FSC tests car-ried out via position and force control modes, was compared as shown inFig. 7.
From the analysis ofFig. 7, it is possible to note that the tool probe vertical position is not significantly affected when the channelling stage is force controlled, although, a slightly lifting of the tool can be ob-served, corresponding to 5 % of the tool probe length.
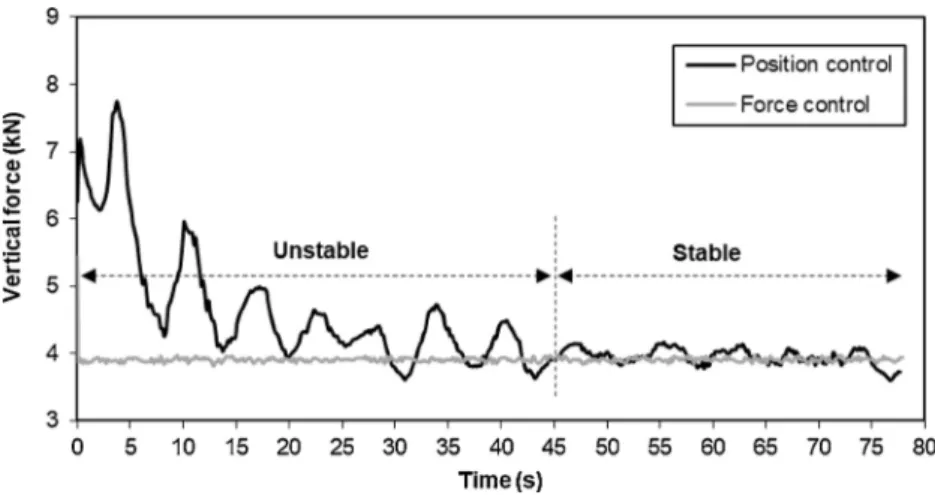
Fig. 8 shows the comparison between the time-evolution of the vertical force during FSC tests performed, with tool (probe H and shoulderN), at a tool travel speed of 100 mm/min and a tool rotation speed of 400 rpm via position and force control modes, where t = 0 s is the time instant in which the tool’s speed-up stage begins.
Similar to the results presented inFig. 6, it is possible to verify that, under position control, FSC process is not stable all over the forward traverse movement stage, as depicted inFig. 8, being the vertical force too much higher at the beginning of the tool’s speed-up stage.
The vertical force patterns present a periodic variation, even when
the process is force controlled. However more pronounced oscillations are observed when the process is performed via position control. Reynolds [15] and Yan et al. [16] reported that these variations are not just a result of the tool rotation and travel speed but also the tool runout.
Regarding the average vertical force during the FSC process stable region, it was found that a lower tool travel speed and a higher tool rotation speed, once independently considered, leads to a higher ver-tical force, as presented inFig. 9. Atharifar et al. [14] found that in-creasing the tool rotation speed during the FSW process increases the temperature, and therefore decreases the dynamic viscosity that re-duces the load required. On the other hand, increasing the tool travel speed increases the dynamic pressure distribution deviation along the tool’s path, which increases the force imparted to the tool shoulder.
Although both FSC conditions presented an unstable region, it can be seen that a lower tool rotation speed and a higher tool travel speed condition gives rise to a three-times longer stabilisation period.
Even if inertial effects have been more pronounced in the lower tool rotation speed and higher tool travel speed condition owing to the higher pressure deviation imparted on the probe surface than the shear stresses caused by a lower rotation [14]; the viscous effects created by the shear stress on the tool probe have a significant influence on the torque, the value of which is higher for the lower tool rotation speed and higher tool travel speed condition, as it is possible to observe in Fig. 10.
Table 10 shows the average vertical force and torque values Fig. 4. Time-evolution of FSC processing parameters. All the stages were position controlled byfixing the tool probe position at 7 mm-depth.
recorded during the tests listed inTable 7, as well as the process specific energy and pseudo heat index.
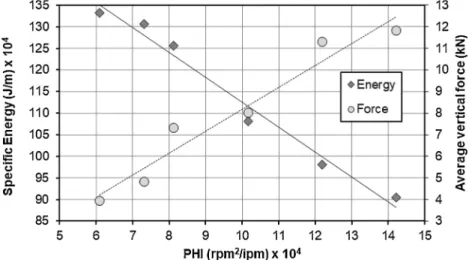
The process specific energy calculated from the measured torque and the average vertical force are plotted with the process pseudo heat index inFig. 11.
From the analysis ofFig. 11, it is possible to observe a clear trend between the process specific energy and the pseudo heat index: the process specific energy decreases when the pseudo heat index increases,
for a process pitch of 0.25 mm/rev. FromTable 10is possible to verify that the measured torque decreases with the increasing of both speeds, which is, mainly, owing to the increasing of the tool rotation speed. Other trend that stands out is the increase of the vertical force with the heat input. For a similar study concerning the FSW process, Upadhyay et al. [17] connect this trend with the peak temperature achieved during the welding process. The authors reported that the temperature increase caused by increasing the tool rotation speed overwhelms the Fig. 5. Time-evolution of FSC processing parameters. The tool’s forward traverse movement was force controlled by imposing a 2 kN vertical force. All other stages were position controlled.
Fig. 6. Time-evolution of the vertical force during FSC tests performed via position and force control modes at a tool travel speed of 50 mm/min and a tool rotation speed of 1100 rpm.
corresponding temperature reduction effect due to the increasing of the tool travel speed.
However, the individual effect of the tool rotation speed and tool travel speed is difficult to gather from the above data set because the channels were performed at the same process pitch, i.e., at the same advance per revolution. So, in order to understand the effect of the tool rotation speed and tool travel speed, separately, on the vertical force, FSC tests were carried out as listed inTable 8.
The variation of the average vertical force with the process pseudo heat index is shown inFig. 12.
On the one hand, at a constant tool rotation speed of 1000 rpm, the vertical force decreases when the pseudo heat index increases, i.e., when the tool travel speed decreases but, on the other hand, at a con-stant tool travel speed of 150 mm/min, the vertical force increases when the pseudo heat index increases, i.e., when the tool rotation speed
increases. Additionally, it is possible to observe that the vertical force increases with the increase of both, tool rotation speed and tool travel speed, although, the results seem to indicate that the tool travel speed has a more significant effect on the vertical force than the tool rotation speed. It would be expected a reduction in the vertical force with the tool rotation speed increase because a higher rotation leads to a ma-terial’s greater softening [17]. However, during the FSC process, the material’s softening hampers the flash removal, which means that there is more processed material in the tool shoulder/workpiece interface, increasing the pressure required to compact the channel nugget leading to a higher vertical force.
3.2. Temperature measurements
It was the authors’ option to carry out this study for a stable and Fig. 7. Time-evolution of the tool probe vertical position during FSC tests performed via position and force control modes.
Fig. 8. Time-evolution of the vertical force during FSC tests performed via position and force control modes at a tool travel speed of 100 mm/min and a tool rotation speed of 400 rpm.
well study FSC condition rather than to investigate the influence of the channelling parameters, namely, the tool rotation speed and the tool travel speed, on the process temperaturefield.
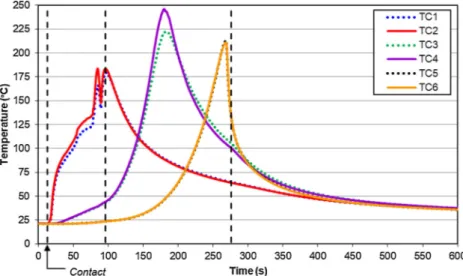
Fig. 13presents the measured temperatures recorded by each em-bedded thermocouple along the channelling direction. Thermocouples TC1, TC3 and TC5 were placed on the channel’s advancing side (AS), whereas thermocouples TC2, TC4 and TC6 were placed on its retreating side (RS). The dash lines represent, respectively, the time instant when the tool probe touched the workpiece, the beginning of the tool’s for-ward traverse movement and the tool’s exit.
The maximum temperature values recorded by each thermocouple are listed inTable 11. These values were recorded when the tool passed by the thermocouples.
The highest measured temperatures were obtained by the two thermocouples placed at the middle of the channel’s path, namely 222.2
and 246 °C. FromTable 11, it can be observed that, in the beginning and middle of the channel length, the retreating side has higher values of temperature. These values can be explained by the channel asym-metry: the advancing side is tangent to the tool probe surface, but the retreating side is not, which means that there is a more intense visco-plastic materialflow on the retreating side that results in higher heat generation by the plastic deformation and viscous heating. The chan-nels’ asymmetry is visible in all chanchan-nels’ produced throughout this investigation: there is more processed material between the tip of the thermocouple and the channel’s side wall on the retreating side than on the advancing side, as can be seen inFig. 14.
Thermocouple measurements reveal peak temperatures about 180 °C during the tool’s plunge stage as depicted in Fig. 15. This initial Fig. 10. Time-evolution of the torque during FSC tests performed via position control at different processing parameters.
Table 10
Measured FSC processing parameters and calculated specific energy. Test ID Average vertical
force (kN) Average torque (Nm) Specific energy (J/m)x104 PHI (rpm2/ipm) x104 FSC_01 3.95 53 133.20 6.10 FSC_02 4.82 52 130.69 7.32 FSC_03 7.31 50 125.66 8.13 FSC_04 8.02 43 108.07 10.16 FSC_05 11.29 39 98.02 12.19 FSC_06 11.83 36 90.48 14.22
Fig. 11. Variation of the process specific energy and the average vertical force with the pseudo heat index forv ω/ =0.25mm/rev.
deformation stage is associated with the generation of the amount of heat and plastic deformation required to induce a dynamic re-crystallization.
FromFig. 15, it can be noticed that the torque and the temperature, recorded by a thermocouple placed in the beginning of the channel’s path, have a similar behaviour up to the beginning of the tool’s forward traverse movement stage. The temperature and torque rise during the tool’s plunge corresponds to a greater power requirement throughout this process period, which is performed under position control.
Fig. 16shows the temperature distribution along the width direc-tion of the workpiece, perpendicular to the channelling direcdirec-tion, re-corded on the retreating side at the channel’s half-length, as well as, the time-evolution of the tool’s temperature after it has exited the work-piece.
The utmost measured temperature values are plotted inFig. 17: Peak temperatures from 112 to 238 °C were recorded by the em-bedded thermocouples. The period of maximum temperature exposure is about 2 s, followed by a quite long cooling period. Average cooling
rates from peak temperatures to 100 °C ranging from 0.2 to 1.5 °C/s, respectively, when the distance from the tool shoulder outer diameter decreases from 55 to 5 mm.
Regarding the tool’s temperature measurement after it has exited the workpiece, a maximum value of 326 °C was measured by a free thermocouple, followed by a long cooling period about 5 and 9 min, respectively, to 100 and 75 °C.
For this set of FSC parameters, the temperaturefield during the channelling process was also mapped out using infrared thermography. The results are presented inFig. 18.
Although, the temperature fields obtained by thermal imaging, globally, match well with those obtained by thermocouples measure-ments, it can be verified that the maximum peak temperature obtained by infrared thermography (324 °C) is higher than that measured by the thermocouples (246 °C); however similar to that of the tool (326 °C), immediately after the end of the process. The differences can be at-tributed to the location of the thermocouples. In fact, the thermo-couples were placed inside the metal workpiece, 4 mm from its upper surface and 5 mm from the tool shoulder outer diameter, while the temperature measurements using the infrared camera were carried out on the surface. As such, the temperatures acquired with the present thermocouple installation may be slightly lower than those actually experienced.
In an attempt to describe the temperature distribution with the distance to the tool probe center, a second degree polynomial trend line was used to extrapolate the results, as shown inFig. 19.
The model predicts a maximum temperature of≈ 328 °C, which occurs at the centre of the tool probe, and decreasing towards the width of the workpiece. The predicted maximum temperature is quite similar Fig. 13. Time-evolution of temperature along the channelling direction. Thermocouples were placed at 5 mm from the tool shoulder outer diameter.
Table 11
Maximum temperature values.
Thermocouple ID Temperature (°C) Channel side ID
TC1 179.4 AS TC2 183.7 RS TC3 222.2 AS TC4 246.0 RS TC5 213.2 AS TC6 210.9 RS
to that measured by the infrared camera (324 °C).
Regarding temperature measurements during the FSC process, Balasubramanian et al. [10] investigated the temperature distribution on a 6mm-thickness plate of AA6061-T6 using infrared thermography. The authors measured a maximum temperature of 182 °C at 5 mm from the tool shoulder outer diameter on the advancing side. Although the base material used is different and the tool smaller, the significant difference in the measured peak temperature can be attributed to the reduction in frictional heat generated at the tool shoulder/workpiece interface. Performing the FSC process with a clearance between the tool shoulder and the workpiece surface decreases the contact area between the tool and the base material. Moreover, the authors reported that the
peak temperature of 182 °C was measured for the highest tool’s plunge depth tested, i.e., for the smallest clearance used. Therefore, performing the FSC process with the tool shoulder in contact with the workpiece surface, continuously removingflash leads to the temperature rise. 4. Conclusions
The FSC process can be divided into six different stages regardless if it is performed via position or force control. However two main stages can be considered in this solid-state technology: thefirst one when the tool travel speed is zero ( =v 0) and the second one when the tool travel speed is not zero ( ≠v 0). These two stages are, respectively, the tool’s plunge stage and the tool’s forward traverse movement stage. Based on the time-evolution of the vertical force, the FSC process can be con-sidered not stable during the forward traverse movement stage when it is performed by position control. For both control modes, the tool is subjected to a more severe loading during the initial plunge than during the channelling period. It was found that the tool probe vertical posi-tion is not significantly affected during the channelling stage when the process is force controlled.
From the temperature measurements carried out, it was recorded a maximum process temperature of about 330 °C.
Declaration of Competing Interest
The authors declare that they have no known competingfinancial Fig. 15. Time-evolution of measured torque and temperature at the beginning of the channelling process.
Fig. 16. Time-evolution of temperature along the width direction of the workpiece, as well as of the tool (after exiting the workpiece). Thermocouples were placed at 5, 15, 25, 35, 45 and 55 mm from the tool shoulder outer diameter on the retreating side, at tool’s mid-course.
Fig. 17. Maximum temperatures versus distance from the tool shoulder outer diameter for thermocouples on the retreating side.
interests or personal relationships that could have appeared to influ-ence the work reported in this paper.
Acknowledgements
The authors would like to acknowledge the Portuguese Foundation for the Science and Technology (FCT) for itsfinancial support through: the PhD scholarship FCT SFRH/BD/62963/2009, project UID/EMS/ 50022/2019 and project UID/EMS/00667/2019.
References
[1] Mishra RS. Integral channels in metal components and fabrication thereof Patent no. US 6923362 B2 2005.
[2] Vilaça P, Thomas W. State-of-the-art in FSW technology”. Chapter 4 of “structural connections for lightweight metallic structures 8. Springer, Advanced Structured
Materials; 2012. p. 85–124.
[3] Vidal C, Vilaça P. Processo de Abertura de Canais Internos Contínuos em Componentes Maciços Sem Alteração da Cota de Superfície Processada e Respectiva Ferramenta Modular Ajustável PT 105628 (B). 2011.
[4] Rashidi A, Mostafapour A, Salahi S, Rezazadeh V. Modified friction stir channeling: a novel technique for fabrication of friction stir channel. Appl Mech Mater 2013;302:365–70.
[5] Balasubramanian N, Mishra RS, Krishnamurthy K. Friction stir channeling: char-acterization of the channels. J Mater Process Technol 2009;209:3696–704. [6] Balasubramanian N, Mishra RS, Krishnamurthy K. Process forces during friction stir
channeling in an aluminum alloy. J Mater Process Technol 2011;211:305–11. [7] Rashidi A, Mostafapour A, Rezazadeh V, Salahi S. Channel formation in modified
friction stir channeling. Appl Mech Mater 2013;302:371–6.
[8] Pandya S, Mishra RS, Arora A. Channel formation during friction stir channeling process— A material flow study using X-Ray micro-computed tomography and optical microscopy. J Manuf Process 2019;41:4855.https://doi.org/10.1016/j. jmapro.2019.03.021.
[9] Karvinen H, Aleni AH, Salminen P, Minav T, Vilaça P. Thermal efficiency and material properties of friction stir channeling applied to aluminium alloy AA5083. Energies 1549;12(8):2019.
[10] Karvinen H, Nordal D, Vilaça P. Microstructural characterization of the stir pro-cessed zones of Cu-Al and Al-Al plate systems manufactured by hybrid friction stir channeling. 12th lnt. Symp. on Friction Stir Welding. Chicoutimi 2018. June. [11] Karvinen H, Nordal D, Galkin T, Vilaça P. Application of hybrid friction stir
chan-neling technique to improve the cooling efficiency of electronic components. Weld World 2018;62(3):497–509.
[12] Vidal C, Infante V, Vilaça P. Fatigue assessment of friction stir channels. Int J Fatigue 2014;62:77–84.https://doi.org/10.1016/j.ijfatigue.2013.10.009. ISSN 0142-1123.
[13] Balasubramanian N, Mishra RS, Krishnamurthy K. Development of a mechanistic model for friction stir channeling. J Manuf Sci Eng 2010;132(5).
[14] Atharifar H, Lin DC, Kovacevic R. Numerical and experimental investigations on the loads carried by the tool during friction stir welding. J Mater Eng Perform 2009;18(4):339–50.
[15] Reynolds AP. Flow visualization and simulation in FSW. Scr Mater 2008;58:338–42. [16] Yan JH, Sutton MA, Reynolds AP. Processing and banding in AA2524 and AA2024
friction stir welding. Sci Technol Weld Join 2007;12:390–401.
[17] Upadhyay P, Reynolds AP. Effects of forge axis force and backing plate thermal diffusivity on FSW of AA6056. Mater Sci Eng A 2012;558:394–402.
Fig. 18. Thermal images showing the temperaturefield during (a) the tool’s plunge stage, (b) the tool’s forward traverse movement and (c) at the end of the channelling process.
Fig. 19. Extrapolated peak temperatures versus distance from the tool probe center on the retreating side.