ORIGINAL PAPER
Extracting natural dyes from wool
—an evaluation
of extraction methods
Ana Manhita&Teresa Ferreira&António Candeias&
Cristina Barrocas Dias
Received: 10 January 2011 / Revised: 21 February 2011 / Accepted: 26 February 2011 # Springer-Verlag 2011
Abstract The efficiency of eight different procedures used for the extraction of natural dyes was evaluated using contemporary wool samples dyed with cochineal, madder, woad, weld, brazilwood and logwood. Comparison was made based on the LC-DAD peak areas of the natural dye’s main components which had been extracted from the wool samples. Among the tested methods, an extraction
proce-dure with Na2EDTA in water/DMF (1:1, v/v) proved to be
the most suitable for the extraction of the studied dyes, which presented a wide range of chemical structures. The identification of the natural dyes used in the making of an eighteenth century Arraiolos carpet was possible using the
Na2EDTA/DMF extraction of the wool embroidery samples
and an LC-DAD-MS methodology. The effectiveness of
the Na2EDTA/DMF extraction method was particularly
observed in the extraction of weld dye components. Nine flavone derivatives previously identified in weld extracts could be identified in a single historical sample, confirming the use of this natural dye in the making of Arraiolos carpets. Indigo and brazilwood were also identified in the
samples, and despite the fact that these natural dyes were referred in the historical recipes of Arraiolos dyeing, it is the first time that the use of brazilwood is confirmed. Mordant analysis by ICP-MS identified the widespread use of alum in the dyeing process, but in some samples with darker hues, high amounts of iron were found instead. Keywords Natural dyes . Dye extraction . Historical textiles . Arraiolos carpets . LC-DAD-MS . ICP-MS
Introduction
Natural dyes have been used since prehistoric times until the mid nineteenth century to dye textiles. They can be found in a broad range of natural sources, such as plants,
fungi (lichens and mushrooms), insects and molluscs [1–3].
Indigo, weld, brazilwood, logwood, cochineal and madder are among those natural dyes that were widely used and contain chromophores with a variety of chemical structures
(Fig. 1).
Indigo blue dye is one of the oldest natural dyestuffs. It has been obtained from a variety of plant sources, such as Indigofera tinctoria L. or Isatis tinctoria L., being the latter
of inferior quality and commonly named as woad [1–3].
The major constituent of this dye is indigotin (1, Fig. 1).
Flavones and flavonols are the main chromophores in the majority of natural yellow dyes, many occurring in the plants as sugar derivatives (commonly glycosides). The main flavonoid yellow dye source mentioned in traditional
European recipes is weld (Reseda luteola L.) [1–3]. The
predominant chromophores found in this plant are the
flavones luteolin (3, Fig. 1), apigenin (4, Fig. 1) and
glycosides like luteolin 7-O-glucoside (2, Fig.1). Weld was
usually combined with red dyes to produce different shades
A. Manhita
:
T. Ferreira:
A. Candeias:
C. Barrocas Dias Chemistry Department and Évora Chemistry Centre, University of Évora,Rua Romão Ramalho 59, 7000–671 Évora, Portugal
A. Manhita
:
T. Ferreira:
A. Candeias:
C. Barrocas Dias (*) HERCULES Laboratory,Largo Marquês de Marialva, 8, 7000–554 Évora, Portugal e-mail: cmbd@uevora.pt A. Candeias
José de Figueiredo Conservation and Restoration Laboratory, Institute of Museums and Conservation,
Rua das Janelas Verdes 37, 1249–018 Lisboa, Portugal DOI 10.1007/s00216-011-4858-x
of orange and with indigo to produce green hues. Brazil was named after brazilwood (Caesalpinia spp.) due to the
abundance of this redwood on its coasts [2]. Chemically,
the major compound isolated from this redwood is brazilin
(5, Fig.1), which by oxidation forms the deep red brazilein
(6, Fig. 1), the chromophore in brazilwoods [1–3].
Although belonging to the group of redwoods, logwood (Haematoxylum campechianum L.) is used to dye textiles in
black. Haematein (7, Fig.1) is the major colouring matter
and derives from its precursor, haematoxylin (8, Fig. 1)
[1–3]. Anthraquinone dyes represent the biggest group of
natural quinone dyes [1–3] and can be of insect or plant
origin. Carminic acid (9, Fig.1) is the main constituent of
cochineal, a plant parasite from Coccidea family used for dyeing textiles in red. Madder (Rubia tinctorum L.) is a
plant anthraquinone red dye; alizarin (10, Fig. 1) and
purpurin (11, Fig. 1) are the main chromophores of this
plant. When combined with different mordants, madder can produce shades that vary from pink to black, purple and
red [1–3].
The analysis and identification of dyes used in historical textiles are of extreme importance in conservation science as they can help in elucidating the textile’s place of origin and time of production. Moreover, they will provide
information that can be used for choosing the appropriate conditions for textiles conservation or restoration. The organic natural colourants used to dye textiles are among one of the most degradable materials used in the works of art. Chromophore identification in ancient textiles can be a challenging task mainly due to the low amounts of intact dye that can be extracted from the usually small historical samples. Extra difficulties arise from the different rates at which the chromophores suffer light and wear degradation
[4,5] and the common use of different dyes to obtain the
fibres desired hues.
Dye analysis is usually performed by liquid
chromatog-raphy with a diode array detector [6–11], but nowadays,
mass detection is becoming increasingly important [12–20].
A successful approach to identify natural dyes requires that, prior to the chromatographic analysis, an adequate analyt-ical methodology is used for their extraction from the textile fibres. The chemical structure and properties of the different dye chromophores suggest that probably no single procedure is adequate for the dye’s extraction. Despite the obvious importance of the sample preparation methodology for the ultimate relevance of the analytical data collected, few systematic studies on the recovery rates of the different chromophores with the available extraction methods have
been published [11, 16, 21]. One of the most commonly
used extraction methods involves the use of hydrochloric
acid (HCl) and methanol (MeOH) at high temperature [5–7,
11,14,16,17]. After solvent evaporation, different solvents
have been used to solubilise the resulting dried residue. Methanol (MeOH) is usually used for the yellow and red dyes solubilisation, while dimethylformamide (DMF) is preferred for the indigoids.
Wouters and Verhecken [5] proposed, several years ago, an
HCl-based method for dye extraction from wool dyed with several coccid insect dyes. Wool dyed fibres were hydrolysed
in a mixture of 37% HCl/MeOH/H2O (2:1:1, v/v/v) placed in
a boiling water bath for 10 min, and after several procedures, the residue was redissolved in an appropriate volume of
H2O/MeOH (1:1, v/v). Although losses during manipulations
are avoided and good extraction yields can be obtained, the use of an HCl-based extraction procedures leads to informa-tion loss (fibre destrucinforma-tion and chromophore glycosidic bonds break), and some mild procedures have been
developed. Some years later, Tiedemann and Yang [22]
presented a milder procedure which consisted in heating the
yarn with 0.1% H2EDTA in H2O/DMF (1:1, v/v) for 30 min
in a boiling bath and then cooled rapidly. The extraction method was successfully applied on red contemporary wool dyed samples and on red wool historical Peruvian samples. Concentrations of the yarn extracts were measured with the photometry function on the UV–Vis spectrophotometer, and the authors found that although being as powerful as the
conventional HCl method, the H2EDTA/DMF extraction
Fig. 1 Chemical structures of the major chromophores of the studied natural dyes: (1) woad, (2, 3, 4) weld, (5, 6) brazilwood, (7, 8) logwood, (9) cochineal and (10, 11) madder
protocol preserves the fibre structure for further investigation.
In the same period, Kirby and White [23] suggested a
method involving the use of a boron trifluoride/MeOH mixture for the extraction of lake pigment dyestuffs from paintings, and the same procedure was used a few years later
[24] to extract dyestuffs from purple samples in a fifteenth
century velvet panel. As Sanyova and Reisse [25] pointed
out, one drawback of this method is the esterification of carboxyl-containing colourants, such as pseudopurpurin and munjistin. Milder extraction method which would minimize unwanted effects such as acid hydrolysis, decarboxylation or methylation, but still extract alizarin, purpurin and other colourants as quantitatively as possible were desirable. The use of hydrofluoric acid solutions for the extraction of anthraquinones from their aluminium complexes in madder lakes fulfilled the hope of non-destructive extraction of pseudopurpurin, glycosides and other labile molecules, and it proved to be at least as efficient as HCl for alizarin and
purpurin [25].
Strong acid procedures are particularly disadvantageous for yellow dyes, the majority of which are flavonoids, often with glycoside groups. In a way to preserve glycosidic
linkages, Zhang and Laursen [16] presented two different
extraction protocols: an H2EDTA/acetonitrile/MeOH
(1:5:44, v/v/v) mixture kept at 60 °C for 30 min and a formic acid/MeOH (1:19, v/v) mixture kept at 40 °C for
30 min, being the residues redissolved in MeOH/H2O (1:1,
v/v) . The methods were tested on silk dyed with yellow and red natural dyes. For the flavonoid dyes on silk, EDTA method seems to be more efficient, while formic acid procedure is more adequate for the anthraquinone-type dyes. The formic acid and EDTA extraction methods not only gave higher extraction yields than did HCl procedure but also more information about the nature of the original dyestuff can be obtained. With the same goal, Guinot and
Andary [26] proposed a mild method for dye extraction
from wool dyed with weld based on the use of oxalic acid. When indigoids dyestuffs are present in the fibre, the use
of DMF [27], hot pyridine [28], MeOH/DMF [11] or
dimethylsulfoxide (DMSO) [21] for the residue
solubilisa-tion is recommended instead of MeOH or MeOH/H2O,
since indigotin and indirubin are insoluble in these solvents
[11,21].
Long ago, Schweppe [27] identified the natural dyes on
the fibres without taking them up into solution, based on the fact that natural mordant dyes form lakes of various colours with different mordant ions. Concerning the fibres dyed with mixtures of natural dyes and blue indigoid dyes,
Schweppe [27] pointed out that the indigo should be
removed from the fibre by repeated boiling with dimethyl-formamide (DMF) until the solvent remains colourless. Once the indigo has been removed, the yellow or the red dyes are left behind and could be identified by forming the
various coloured lakes. Surowiec et al. [28] in a study of
archaeological Coptic textiles proposed an extraction procedure of alkaline hydrolisis, for samples containing blue dyestuffs (indigotin or its derivatives), based on hot pyridine, while yellow and red dyes were extracted by
acidic hydrolysis with a mixture of 3 mol dm−3 HCl
solution in ethanol (1:1), heated in a water bath at 90 °C for
about 30 min. Later, Surowiec et al. [11], based on the
acidic extraction with a mixture of 37% hydrochloric acid: MeOH:water (2:1:1, v/v/v) in a water bath at 100 °C for 10 min, proposed an additional DMF/MeOH (1:1, v/v) extraction step to enhance the extraction of the vat dye indigotin, a component of the blue dyes woad and indigo, and mordant dyes released during hydrolysis step. The recovery efficiencies for flavonoids, plant-derived anthra-quinones, ellagic acid and indigotin were improved with this additional MeOH/DMF extraction step and, particularly, the recovery of indigotin offered a notable improvement.
Finally, in a recent work, Valianou et al. [21] presented a
systematic comparative study of five different dye extrac-tion procedures based on hydrochloric, citric, oxalic and
trifluoroacetic acids (TFA) and an HCOOH/H2EDTA
mixture. All five extraction methods were tested on dyed wool with red and yellow mordant dyes (madder, cochineal, weld and young fustic), a yellow direct dye (tumeric) and a blue vat dye (woad) and also on historical textile samples. Particular working conditions were established after a vast study, but in general, wool samples were treated in a boiling water bath with a mixture in the adequate proportions of the
respective acid:MeOH:H2O until dryness, being the residue
reconstituted with DMSO. In the case of HCOOH/H2EDTA
mixture, EDTA solution was added to the initial mixture after wool extraction of 5 min with formic acid. The upper solution was then isolated in a second tube and dried, and the procedure was repeated to treat the residue of the first tube. TFA method provided elevated extraction yields for most of the studied dye components and was selected to be used on historical samples, where it was successfully applied in the identification of several colouring com-pounds, some of which could not have been detected if the HCl method was used.
The purpose of this work was to make a systematic evaluation on the efficiency of several currently available extraction procedures used to extract different dye compo-nents from wool dyed fibres. Contemporary dyed samples were used in order to evaluate the different analytical methodologies. The dyes investigated cover a wide range of
chemical structures (Fig.1), and they have been historically
used to obtain a wide array of different hues.
The most effective extraction procedure was then used for the extraction of Arraiolos carpets historical samples. Arraiolos carpets are probably one of the richest artistic Portuguese expressions in terms of textile heritage, being
produced between the seventeenth and nineteenth centuries
[29]. In this work, wool samples were collected from an
eighteenth century carpet belonging to the National Museum of Ancient Arts (MNAA), and after extraction, the natural dyes were identified by LC-DAD-MS.
Experimental Materials and reagents
The following analytical grade reagents were used: nitric acid 65%, N,N-dimethylformamide, 37% hydrochloric acid
and sodium dithionite (Na2S2O4) from Panreac (Barcelona,
Spain); sodium hydroxide (NaOH) from Akzo Nobel (Amsterdam, The Netherlands); EDTA disodium salt from Sigma-Aldrich (Milwaukee, WI, USA); pyridine from Fluka (Buchs, Switzerland); oxalic acid from Riedel-de-Haën (Seelze, Germany) and acetone from Vaz Pereira (Lisbon, Portugal). Methanol, acetonitrile and formic acid (HPLC grade) were purchased from Merck (Darmstadt, Germany). Water purified by a Millipore Simplicity UV system (Billerica, MA, USA) was used for sample preparation and all the analyses. Alum, weld (R. luteola L.), cochineal (Dactylopius coccus Costa), woad (I. tinctoria L.), brazilwood (Caesalpinia spp.), madder (R. tinctorum L.) and logwood (H. campechianum L.) were purchased from Kremer Pigmente GmbH & Co. KG (Aichstetten, Germany). Standards of haematein, alizarin, carminic acid, brazilin, apigenin and indigotin were obtained from Fluka (Buchs, Switzerland); luteolin and haematoxylin were purchased from Sigma (St. Louis, MO, USA) and purpurin was acquired from Eastman Organic Chemicals (Rochester, NY, USA); luteolin 7-O-glucoside was obtained from Extrasynthèse (Genay, France). Undyed industrial Arraiolos sheep wool was acquired from Rosarios4 (Mira de Aire, Portugal).
Contemporary dyed wool samples
A sample (4.0 g) of sheep wool previously spun and scoured was mordanted for 30 min in 200 mL of boiling
water containing 1.0 g of alum (adapted from [30,31]). The
wool was removed, rinsed and left to dry protected from light. Except for woad, all wool samples were dyed in the following way: each dye bath was prepared with 0.5 g of dried material (weld, brazilwood, logwood or madder)
immersed in 50 mL H2O and heated at 90 °C for 2 h and
vacuum filtered. After this, the previously mordanted wool was added to the dye solution and kept at 90 °C for 30 min.
In the case of cochineal, the dye bath was prepared by
soaking 0.5 g of dried insects in 50 mL H2O for 24 h, after
which, the above procedure was followed.
For woad, 0.5 g of dye was mixed in a small amount of warm water, obtaining a blue opaque solution. Two
millilitres of NaOH 4.25 mol dm−3plus 2.0 mL of Na2S2O4
0.86 mol dm−3 was added, and after 15 min, the solution
turned to a translucent green–yellow colour. Woad solution was diluted to 50 mL (pH adjusted to 10). Non-mordanted wool was dyed for 30 min at 50 °C and then removed and oxidized by exposure to air.
After the dyeing procedure, all wool samples were removed, rinsed and left to dry protected from light. Extraction procedures
For wool dyed with cochineal, weld, madder, brazilwood and logwood, six extraction methods were evaluated. Woad dyed wool was extracted using eight different procedures. Glass vials of 1.5 mL capacity were used in all extractions. Five samples of each dyed fibre were extracted per method, and three replicate LC-DAD analyses were performed on
each extract. All dried residues were dissolved in 500μL of
MeOH/H2O (1:1, v/v) solution, except for those of woad
and HCl-2 methods which were reconstituted in 500μL of
MeOH/DMF (1:1, v/v) solution. All solutions were filtered through a 0.45-μm PTFE prior to LC analysis.
HCl-1 method
Two milligrammes of dyed wool was placed in capped vials
with 400μL of 37% HCl/MeOH/H2O (2:1:1, v/v/v) solution
and heated at 100 °C for 10 min [5]. Vials were cooled to
room temperature, and the solvent was evaporated under vacuum.
HCl-2 method
The procedure was the same as in HCl-1 method, but after
the drying process, 400 μL of MeOH/DMF (1:1, v/v)
solution was added to the residue, and the solution was
heated at 100 °C for 5 min [11]. Vials were cooled to room
temperature, and the solvent was evaporated under vacuum. Formic acid method
Two milligrammes of dyed wool was placed in capped vials
with 400 μL of HCOOH/MeOH (1:19, v/v) solution and
heated at 40 °C for 30 min [16]. After being cooled to room
temperature, the solvent was evaporated under vacuum. EDTA-1 method
Samples of 2 mg of dyed wool were placed in capped vials,
and 400 μL of 0.001 mol dm−3 aqueous Na2EDTA/
(adapted from [16]). The vials were kept at 60 °C for 30 min. After being cooled to room temperature, the solvent was evaporated under vacuum.
EDTA-2 method
Two milligrammes of dyed wool was placed in vials, and
1.0 mL of 0.1% Na2EDTA in H2O/DMF (1:1, v/v) solution
was added [22]. The vials were capped and kept at 100 °C
for 30 min. Vials were cooled to room temperature, and the solvent was evaporated under vacuum.
Oxalic acid method
Two milligrammes of dyed wool was placed in capped vials
with 400 μL of 2 mol dm−3 oxalic acid/MeOH/acetone/
H2O (1:30:30:40, v/v/v/v) solution and heated at 60 °C for
30 min [26]. Vials were cooled to room temperature, and
the solvent was evaporated under vacuum. Pyridine method
Two milligrammes of woad dyed wool was placed in capped vials with 0.5 mL of pyridine and heated at 100 °C
for 15 min [28]. Vials were then cooled and solvent
evaporated under vacuum. DMF method
Two milligrammes of woad dyed wool was placed in capped vials with 0.5 mL of DMF and heated at 100 °C for
15 min [27]. Vials were then cooled and solvent evaporated
under vacuum. LC-DAD analysis
An Agilent 1100 system (Agilent Technologies, Waldbronn, Germany) equipped with a diode-array detector and an HP Chem-Station (Agilent Technologies) was used for LC-DAD analyses. The analytical column was a reversed-phase Lichrocart Purospher Star RP-18, 250 mm length×4.6 mm i.
d. and 5μm particle size (Merck, Darmstadt, Germany),
set at a temperature of 30 °C. The mobile phase consisted of acetonitrile (A) and 2.5% of aqueous acetonitrile (v/v) containing 0.5% HCOOH (v/v) (B). A
flow of 1.0 mL min−1 was used with the following
gradient: 0–100% A from 0 to 10 min, 100% A from 10
to 15 min. Between sample injections, a 5-min run of solvent B was used for column equilibration. The injection
volume was 20μL, and DAD detection was set between
200 and 700 nm. Chromatographic profiles were recorded at 600, 265, 450, 445, 495 and 290 nm for indigo, weld, brazilwood, logwood, cochineal and madder, respectively.
SEM analysis
A Hitachi S-3700N variable pressure scanning electron microscope (Tokyo, Japan) interfaced with a Bruker X-ray energy dispersive spectrometer was used for morphological characterization of the samples. Samples were mounted in aluminium holders with double-sided adhesive carbon tape and coated with an Au–Pd layer. The analyses were done using an acceleration voltage of 15.0 kV.
Statistical data analysis
Statistical treatment (one-way ANOVA, P<0.05, SPSS® 15.0 for Windows) was performed on the data to determine significant differences whenever they occurred.
Arraiolos historical samples Sampling
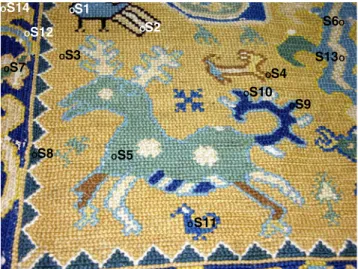
An eighteenth century historical carpet was selected from the National Museum of Ancient Arts (MNAA, Lisbon, Portugal) collection (catalogue number 36). Different portions of embroidery wool yarns between 3 and 5 mm with the same hue were sampled in distinct parts of the carpet with fine point tweezers and spring bow scissors from thread ends in damaged areas or in the back side. Samples from 14 different hues (referred as S1 to S14,
Fig.2) were collected and individually stored in Eppendorf
tubes protected from the light. Colourimetric studies
A portable spectrophotometer equipped with a Xenon lamp and a photodiode sensitive to the 360–700-nm spectral
OS1 OS2 OS3 OS4 OS9 OS10 OS11 OS5 OS7 OS8 OS12 S6O S13O OS14
Fig. 2 Arraiolos carpet (MNAA collection, catalogue number 36) with fibre sampling (S1–S14) location
range from Datacolor (Zurich, Switzerland) was used for colourimetric studies (L*, a* and b*, CIELab space defined
by Commission Internationale de l’Eclairage in 1976).
Black and white standards were used for calibration, and analyses were done with standard illuminant/observer CIE D65/10° and specular component excluded. Analyses were performed on three different points of each wool sample, with the average value used for data interpretation. Extraction procedure
Samples of approximately 2.0 mg were extracted following the EDTA-2 methodology. All samples were vacuum-dried,
dissolved in 250 μL MeOH/H2O (1:1, v/v) and filtered.
The remaining threads of blue and green samples were
redissolved in 250μL MeOH/DMF (1:1, v/v) and filtered.
LC-DAD-MS analysis
An LCQ Advantage Thermo Finnigan mass spectrometer equipped with an ESI source, using anion trap mass analyzer and a PDA detector was used (San Jose, CA, USA). The conditions of MS analysis were capillary temperature of 300 °C, source voltage of 5.0 kV, source
current of 100.0μA, and capillary voltage of −20.0 V in
negative ion mode and 22.0 V in positive ion mode. Analytes were detected in full MS mode (m/z 100–800): in negative ion mode, two segments were used, 10% CID from 0 to 15 min and 30% CID from 15 to 30 min; in positive ion mode, 30% CID was used from 0 to 30 min. All samples were injected in negative and positive ion modes. Column temperature was set at 30 °C, and tray temperature was set at 24 °C. PDA detector was set at 200– 800 nm. The MS and PDA equipment were coupled to an LC system with auto sampler (Surveyor Thermo Finnigan). The analytical column was a reversed phase Fortis-C18
(Fortis Technologies; C18, particle size 3.0 μm, 150×
2.1 mm). The mobile phase consisted of acetonitrile (A) and water acidified with 0.1% formic acid (B). The gradient used was 0–90% A from 0 to 20 min, then 90% A from 20
to 30 min. Injection volume was set to 10μL.
ICP-MS analysis
Measurements were carried out using a ThermoScientific Element XR ICP-MS instrument, equipped with a sector field mass spectrometer of reverse Nier-Johnson geometry. Sample introduction was accomplished by means of a
MicroMist nebulizer (sample uptake rate of 200μL min−1;
Glass Expansion), mounted onto a cyclonic spray chamber (Glass Expansion). Typical instrument settings and data acquisition parameters used were Rf power, 1,250 W;
auxiliary gas flow, 0.800 dm3 min−1; cooling gas flow,
16.000 dm3 min−1; sample gas flow, 0.993 dm3 min−1;
resolution, 4,000 m/Δm; segment duration, 200 ms; sample time, 10 ms; E-scan type and 36 sweeps and total measure-ment time per sample, 126 s. Concentrations for all elemeasure-ments (Al, Fe, Cu and Zn) were determined via external calibration
versus a standard solution containing 35 μg dm−3 of the
analyte elements. This standard solution was prepared by
dilution of commercially available 1 g dm−3single element
standard solutions (Merck) with 0.14 mol dm−3HNO3. High
purity water (purified by means of a Milli-Q system
(Millipore)) and HNO3 (purified by sub-boiling distillation
in a PFA equipment) were used for dilution.
For sample preparation, historical fibres of 0.1–2.0 mg were placed in polypropylene tubes and digested with
0.5 mL of concentrated HNO3 in an ultrasound bath
without temperature control. Acidic digestion proceeded until complete fibre dissolution (approximately 2 h). The solution was then diluted to 5 mL using ultrapure water.
Results and discussion
Evaluation of the extraction procedures
In this work, we have evaluated six extraction procedures (referred as HCl-1, HCl-2, formic acid, EDTA-1, EDTA-2 and oxalic acid methods) to extract wool samples dyed with madder, weld, cochineal, logwood, brazilwood and woad, and two additional extraction procedures (pyridine and DMF methods), which were only used to extract wool dyed with woad.
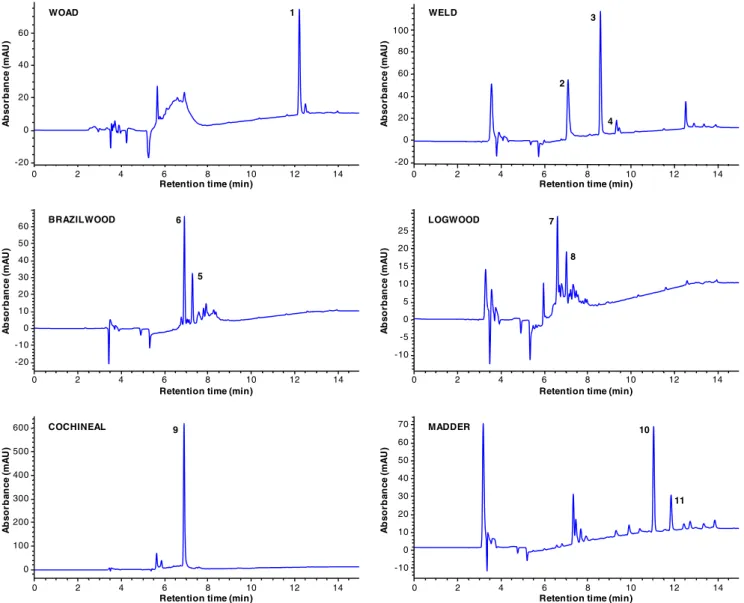
Five samples of each dyed fibre were extracted per extraction method, and three replicate analyses were per-formed on each extract. The chromatographic analysis of the wool extracts was done using reverse-phase liquid chroma-tography coupled with a DAD detector (LC-DAD). The identification of the dye chromophores was done based on their UV spectra and by comparison with authentic standards. Representative chromatograms of all the wool extracts obtained with the EDTA-2 extraction method are shown in
Fig.3. The evaluation of the extraction methods efficiency
was based on the comparison of the chromatographic peak areas obtained from LC-DAD analyses for the main
chromophores in each dye (Table 1). One-way ANOVA
statistics was used to identify significant differences among the extraction procedures whenever they occurred.
The HCl-1 and HCl-2 methods are the most aggressive extraction methods available, leading to the almost com-plete destruction of the fibre structure. SEM analysis performed on fibres subjected to HCl-based extraction procedures showed that the main wool fibre structure is almost completely lost and, whenever maintained, the fibres
main difference between the tested HCl methods is the addition of an extraction step with MeOH/DMF on the
HCl-2 method. Contrary to previously reported results [11],
with the exception of brazilein (6, Table1) and haematein
(7, Table1), no significant improvement in the natural dyes
extraction yields was obtained with the HCl-2 procedure when compared to those obtained with HCl-1.
Hot pyridine and DMF are described in the literature for
the extraction of indigo dyes from textile samples [27,28].
Nevertheless, indigotin (1, Table1) was not observed in the
DMF extract, and only a small chromatographic peak with
tr=12.5 min was detected (data not shown), likely
indir-ubin, a compound which is normally present at variable concentration in the indigo dyes.
HCl-1 was the most effective method to extract indigotin. However, researchers should be aware that
yellow flavonoid dyes were commonly used together with indigo dyes to obtain green hues. These originally green colours tend to become bluish when subjected to light due to the faster photodegradation of the flavonoid dyes. HCl-based methods are not suitable for the extraction of the yellow flavonoid dyes due to hydrolysis
of the O-glycosidic bonds [16,21]. Being so, caution is
needed when they are used to extract bluish samples since relevant information regarding the source of other natural dyes could be lost.
For the indigoids extraction, one-way ANOVA analysis showed that the results obtained with the milder method EDTA-2 are not significantly different from those obtained
with pyridine (P <0.05, Table 1). The former method
enables efficient extraction of other dye components. In fact, when the EDTA-2 procedure is used, residual amounts
0 2 4 6 8 10 12 14 0 100 200 300 400 500 600 0 2 4 6 8 10 12 14 -10 0 10 20 30 40 50 60 70 0 2 4 6 8 10 12 14 -20 0 20 40 60 80 100 0 2 4 6 8 10 12 14 -10 -5 0 5 10 15 20 25 2 4 6 8 10 12 14 -20 -10 0 10 20 30 40 50 60 0 0 2 4 6 8 10 12 14 -20 0 20 40 60 A b so rb an ce (mA U ) A b so rb an ce (mA U ) A b so rb an ce (mA U ) A b so rb an ce (mA U ) ) U A m( e c n a br o s b A ) U A m( e c n a br o s b A
Retention time (min)
Retention time (min) Retention time (min)
Retention time (min) Retention time (min)
Retention time (min)
1 3 4 5 7 8 9 10 11 6 WOAD WELD BRAZILWOOD LOGWOOD COCHINEAL MADDER 2
Fig. 3 LC-DAD chromatograms of the dyed wool extracts obtained with the EDTA-2 extraction method. Chromatographic profiles recorded at 600, 265, 450, 445, 495 and 290 nm for woad, weld, brazilwood, logwood, cochineal and madder, respectively. For peak identification, see Fig.1
of yellow glycosilated chromophores from weld can sometimes be extracted and identified together with indigo in samples which present nowadays a blue hue (historical samples analyses).
The yellow chromophores of weld behaved slightly differently when the different extraction procedures were
applied. Luteolin (3, Table 1) was extracted with a similar
efficiency by the HCl-1, HCl-2, EDTA-2 and oxalic acid
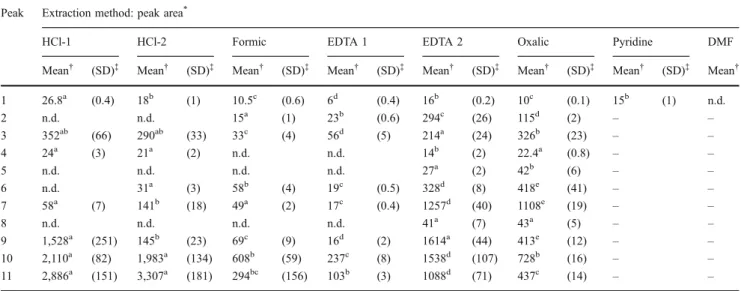
Table 1 LC-DAD peak areas (mAU ×min) of the natural dyes major chromophores extracted from wool dyed samples by the different extraction procedures (see Fig.1for peaks identification)
Peak Extraction method: peak area*
HCl-1 HCl-2 Formic EDTA 1 EDTA 2 Oxalic Pyridine DMF
Mean† (SD)‡ Mean† (SD)‡ Mean† (SD)‡ Mean† (SD)‡ Mean† (SD)‡ Mean† (SD)‡ Mean† (SD)‡ Mean†
1 26.8a (0.4) 18b (1) 10.5c (0.6) 6d (0.4) 16b (0.2) 10c (0.1) 15b (1) n.d. 2 n.d. n.d. 15a (1) 23b (0.6) 294c (26) 115d (2) – – 3 352ab (66) 290ab (33) 33c (4) 56d (5) 214a (24) 326b (23) – – 4 24a (3) 21a (2) n.d. n.d. 14b (2) 22.4a (0.8) – – 5 n.d. n.d. n.d. n.d. 27a (2) 42b (6) – – 6 n.d. 31a (3) 58b (4) 19c (0.5) 328d (8) 418e (41) – – 7 58a (7) 141b (18) 49a (2) 17c (0.4) 1257d (40) 1108e (19) – – 8 n.d. n.d. n.d. n.d. 41a (7) 43a (5) – – 9 1,528a (251) 145b (23) 69c (9) 16d (2) 1614a (44) 413e (12) – – 10 2,110a (82) 1,983a (134) 608b (59) 237c (8) 1538d (107) 728b (16) – – 11 2,886a (151) 3,307a (181) 294bc (156) 103b (3) 1088d (71) 437c (14) – – n.d. not detected
*Normalized to milligrammes of dyed wool extracted by each method, samples dried and redissolved in 500 μL of solvent, 20 μL injection.
Chromatographic profiles recorded at (nanometres): 600 (woad: 1), 265 (weld: 2, 3 and 4), 450 (brazilwood: 5 and 6), 445 (logwood: 7 and 8), 495 (cochineal: 9) and 290 (madder: 10 and 11)
†The values represent the mean of three replicate measurements on five different extracts. For each compound, means followed by different index letters
are significantly different (one-way ANOVA, P<0.05)
‡Standard deviation
Fig. 4 SEM micrographs of a untreated, undyed wool; b, c dyed wool extracted with HCl-1 and EDTA-2 methods, respectively
methods, while significantly lower yields were obtained with the EDTA-1 and formic acid procedures. Apigenin (4,
Table1) amounts are, as expected, much lower and could
not be detected when the EDTA-1 and formic acid methodologies were used, while the other tested methods
performed equally well. Surowiec et al. [11] compared the
two HCl procedures for the extraction of weld dye aglycones, concluding also that they result in very similar LC peak areas. However, the known hydrolysis of the flavonoid glycosides should be taken into consideration for the apparent good yields obtained with the HCl methods for
the studied aglycones [21]. In fact, luteolin-7-O-glucoside
(2, Table 1) is absent in chromatograms of the HCl
methods, being only detected when milder extraction procedures were used. LC-DAD-MS analysis of the extracts obtained with the milder extraction methods enabled also the identification of up to seven flavone glycosides (data not shown), which have already been
identified in weld [32], and it is of major importance for the
historical samples analysis.
Brazilwood and logwood chromophores (5–8, Table 1)
are neoflavonoids which were overall poorly recovered with exception for EDTA-2 and oxalic acid extraction methods. Statistic analysis indicates that both methods are not equally effective in the extraction of the neoflavonoid dyes. In fact, oxalic acid yields slightly higher peak areas
for the brazilwood chromophores (5 and 6, Table1), while
EDTA-2 is more effective in the extraction of the haematein
(7, Table 1). Neoflavonoids are very sensitive to light
degradation [33], and only very small amounts of intact
chromophores are expected to be present in historical textiles requiring, therefore, very effective extraction methods for their recovery.
The mild methods, formic acid, EDTA-1 and oxalic acid, perform very poorly in the extraction of the anthraquinone
dyes (9–11, Table1). Unexpectedly, carminic acid (9, Table1)
was very poorly extracted by the HCl-2 method, but no significant differences were observed between the extraction yields obtained with EDTA-2 and HCl-1 methods. Valianou
et al. [21] evaluated both HCl-1 and oxalic acid methods in
the extraction of carminic acid but did not report a considerable difference between them.
Madder dye components (10 and 11, Table 1) were
extracted with higher efficiency by both HCl methods. The EDTA-2 extraction procedure also performed reasonable well and, for the reasons presented above, this method should be considered whenever the presence of yellow
flavonoid dyes is suspected. Surowiec et al. [11] reported
higher extraction yields for the madder dye components when HCl-2 was used compared to HCl-1, which we could
not confirm. Valianou et al. [21] also observed that milder
extraction methods, like oxalic acid, were less effective in the extraction of the madder anthraquinones.
One of the most striking differences observed in this study is the difference in the peak areas for the same dye obtained with the two procedures involving EDTA
(Table 1). EDTA is a very good chelating agent, and it is
expected to displace the dye molecule, binding the
mordant metal ion which is attached to the fibre [16,22].
An important difference between the two tested methods is the solvent used to solubilise the displaced dye. According
to the results presented in Table 1, and for all the
chromophores investigated, the solvent DMF appears to be a much more effective solvent than the more polar mixture of acetonitrile/MeOH. The differences in EDTA concentration and temperature between the two methods might also play a role in the different extraction yields obtained.
A main feature of the EDTA methods is their mildness. In fact, SEM images confirmed that the wool fibre scale structure is practically intact after the extraction procedure
with Na2EDTA/DMF (Fig. 4a, c).
An overall appreciation of the tested extraction methods indicates that the most effective procedures were the HCl-1, EDTA-2 and oxalic acid. Considering the already referred shortcomings of the HCl methods and the poor anthraqui-none extraction yields obtained with the oxalic acid procedure, authors believe that, among the tested methods, EDTA-2 is the most suitable method to extract unknown dyes from an historical sample.
Arraiolos historical samples analyses
To test the previous assumption about EDTA-2 as the best extraction method, historical samples were collected from an Arraiolos carpet from the eighteenth century (MNAA collection, catalogue number 36). This is a large rectangular carpet (169×112 cm) with a yellow background and a typical animal pattern, and the blue border presents a design
with oriental motifs (Fig. 2) [29].
Historical references concerning the usage of natural dyes in Arraiolos carpets are scarce and indicate only the use of indigo, weld, spurge flax (Daphne gnidium L.),
logwood and brazilwood as the colour sources [29,34–36].
Samples from 14 different hues were collected from the embroidery work, and their L*a*b* coordinates of the
CIELab colour space measured by colourimetry (Table2).
The identification of the natural dyes was carried out by LC-DAD-MS analysis of wool samples extracts obtained
using the EDTA-2 procedure (Table2).
Weld was reportedly used in Arraiolos carpets to obtain
yellow hues [34] and, in fact, it has already been detected in
another carpet [37]. The analysis of the samples collected in
the MNAA carpet enabled the identification of weld in yellow samples S3, S12 and S14, in green samples S5, S7 and S8, in light brown sample S4, and surprisingly, in black
T able 2 Identification of the natural dyes in wool samples collected from an Arraiolos carpet with catalogue number 36 from MNAA collection Sample Rt (min) LC-DAD data (nm) LC-MS data (m /z ) Identification Possible dye source ID Colour CIEL*a*b* coordinates ESI − ESI + L* a* b* S1 Bk 15.77 0.74 1.20 15.99 243, 277, 323 609, 447, 285 – Luteolin di-O -glucoside W eld 16.45 243, 277, 323 609, 447, 285 – Luteolin 3,7 ′-di-O -glucoside 17.37 250, 267, 346 447, 285 – Luteolin 7-O -glucoside 18.12 244, 265, 324 431, 269 – Apigenin 7-O -glucoside 20.62 250, 267, 347 285, 243, 217, 199, 151, 133 – Luteolin S2 Br 26.29 3.91 10.51 –– – – – – S3 Y 53.90 7.39 32.66 16.47 242, 280, 324 609, 447, 285 – Luteolin 3,7 ′-di-O -glucoside W eld + Brazilwood 17.32 250, 267, 347 447, 285 – Luteolin 7-O -glucoside 18.12 246, 263, 329 431, 269 – Apigenin 7-O -glucoside 18.80 259, 307, 333 243 245 T ype C compound S4 LBr 38.61 9.57 24.78 Same as S3 S5 Gr 39.01 − 6.40 17.21 15.95 245, 268, 334 609, 447, 285 – Luteolin di-O -glucoside W eld + Isatis or Indigofera tinctoria 16.47 245, 268, 334 609, 447, 285 – Luteolin 3,7 ′-di-O -glucoside 17.38 249, 255, 348 447, 285 – Luteolin 7-O -glucoside 18.12 244, 267, 335 431, 269 – Apigenin 7-O -glucoside 18.25 247, 269, 341 461, 299 – Chrysoeriol 7-O -glucoside 20.60 251, 267, 347 285, 199, 175, 133 – Luteolin 26.55 245, 286, 331, 606 – 263, 235, 219 Indigotin S6 W 60.39 3.48 20.21 –– – – – – S7 Gr 37.64 − 7.68 8.47 Same as S5 S8 Gr 31.07 − 7.25 1.40 Same as S5 S9 Bl 24.41 − 3.79 − 9.78 26.53 245, 286, 332, 606 – 263, 235, 219 Indigotin Isatis or Indigofera tinctoria S10 Bl 40.62 − 6.81 0.39 Same as S9 S1 1 B l 29.80 − 5.93 − 10.88 Same as S9 S12 Y 56.61 7.67 42.44 15.94 245, 267, 335 609, 447, 285 – Luteolin di-O -glucoside W eld 16.43 245, 267, 335 609, 447, 285 – Luteolin 3,7 ′-di-O -glucoside 17.33 254, 267, 348 447, 285 – Luteolin 7-O -glucoside 18.07 245, 268, 335 447, 285 – Luteolin 4′ -O -glucoside 18.19 246, 263, 328 431, 269 – Apigenin 7-O -glucoside 18.30 247, 269, 341 461, 299 – Chrysoeriol 7-O -glucoside 18.47 246, 267, 339 447, 285 – Luteolin 3′ -O -glucoside 21.58 253, 266, 348 285, 243, 241, 217, 199, 175, 151, 133 – Luteolin 22.24 249, 267, 336 269, 225, 201, 181, 149, 1 1 7 – Apigenin S13 Bg 52.45 6.78 27.77 18.80 259, 307, 333 243 245 T ype C compound Brazilwood S14 Y 57.97 1 1.47 38.09 15.59 243, 277, 323 609, 447, 285 – Luteolin di-O -glucoside W eld + Brazilwood 16.05 243, 277, 323 609, 447, 285 – Luteolin 3,7 ′-di-O -glucoside 17.37 250, 267, 346 447, 285 – Luteolin 7-O -glucoside 18.12 244, 265, 324 431, 269 – Apigenin 7-O -glucoside 18.80 259, 307, 333 243 245 T ype C compound 20.62 250, 267, 347 285, 243, 217, 199, 151, 133 – Luteolin Bg beige, Bk black, Bl blue, Br brown, Gr green, LBr light brown, W white, Y yellow
sample S1. The phenolic compounds extracted from these samples absorb in the region of spectra below 350 nm, confirming their flavone structure, and their elution pattern and mass spectra correspond to the luteolin, apigenin and
chrysoeriol derivatives reported in weld extracts [18, 32,
37]. Usually, not all the compounds identified in weld plant
extracts can be identified in the historical textile samples. However, and despite the widely distribution of these compounds in the plant kingdom, weld is frequently
pointed out in the literature [38–40] as the yellow colour
source in the historical textiles, sometimes based only in the identification of very few flavone derivatives.
The chromatographic profile of sample S12 presented in
Fig. 5 is unusually comprehensive for a historical sample,
as nine flavone derivatives, which were previously identi-fied in weld plant extracts, could be identiidenti-fied based on the comparison of their UV–Vis and mass spectra data with
those reported in the literature (Table2) [18,32, 37]. The
negative ESI mass spectra of luteolin-di-O-glucosides
yielded a deprotonated ion, [M–H]−, at m/z 609 which
gives rise to Y1−(m/z 447) and Y0−(m/z 285), ions formed
by the sequential loss of two hexose residues (162 amu).
The compounds with rt= 15.94 and 16.43 min were
identified as luteolin-di-O-glucoside and luteolin-3,7′-di-O-glucoside based on their UV spectra and elution order
[32,37].
Several flavone-O-glucosides could be identified in S12
sample (Fig.5 and Table 2). The presence of
luteolin-O-glucosides was suggested by the loss of a hexose residue
(162 amu) from the deprotonated ion, [M–H]− (m/z 447),
with the formation of Y0−at m/z 285. Compounds with rt=
17.33, 18.07 and 18.47 min were identified as luteolin-7-O-glucoside, luteolin-4′-O-glucoside and luteolin-3′-O-gluco-side, respectively, based on their UV spectra and elution
order [32, 37]. The latter two compounds could only be
identified on sample S12. The chromatographic peak with
rt=18.19 min was attributed to apigenin-7-O-glucoside, as
[M–H]− (m/z 431) was detected along with the Y0−ion at
m/z 269, which results from the loss of a hexose unit from the original deprotonated ion.
The chromatographic peak at rt=18.30 min was
attrib-uted to the methoxyflavone glycoside chrysoeriol 7-O-glucoside, which has already been detected in historical
samples dyed with weld [18]. The [M–H]− (m/z 461) was
detected along with the Y0− ion at m/z 299, which results
from the loss of a hexose unit from the original deproto-nated ion. Chrysoeriol 7-O-glucoside was only identified in samples S5 and S12.
The flavone aglycones luteolin and apigenin were identified
with rt=21.58 and 22.24 min, respectively, in S12. The
deprotonated molecular ion of luteolin was detected at m/z 285 along with the fragments derived from the retro-Diels-Alder
(RDA) reaction,1,3A− at m/z151 and1,3B−at m/z133, which
provide information on the number and substituents of
rings A and B of the flavonoid structure [12,41]. Further
fragmentation yielded fragments at m/z 243 [M–H–
C2H2O]−, m/z 241 [M–H–CO2]−, m/z 217 [M–H–C3O2]−,
m/z 199 [M–H–C2H2O–CO2]− and m/z 175 [M–H–C3O2–
C2H2O]− [41]. Similar fragmentation was observed for
apigenin, and the deprotonated molecular ion was detected
at m/z 269 along with the RDA fragments1,3B−at m/z 117
and 1,4B− +2H at m/z 149. Further fragmentation yields
ions detected at m/z 181 [M–H–2CO2]−, m/z 201 [M–H–
C3O2]−and m/z 225 [M–H–CO2]− [41].
Despite the fact that sample S3 presents nowadays a yellowish hue, it is thought to have been originally dyed in an orange/reddish hue. This conclusion is supported by the fact that the base of the embroidery stitches, which is less exposed to the effects of light, still presents a faded orange/ reddish hue. Neither brazilin or brazilein were detected.
Nevertheless, a compound with rt= 18.80 min in the
chromatographic profile of this sample extract is tentatively
identified as Type C compound (Table 2), an analyte
previously described by Karapanagiotis et al. in samples
collected from Cretan icons [42] and post-Byzantine
textiles [43]. The authors [42, 43] did not suggest an
explanation for the nature of this compound. However, preliminary results obtained by our group on light artifi-cially aged wool samples dyed with brazilwood and
extracted by the Na2EDTA/DMF method suggest that Type
C compound is likely to be a photodegradation product of this natural dye (unpublished data). The presence of both weld and brazilwood in sample S3 could explain the orange/reddish colour observed in the base of the embroi-dery stitches. Type C compound was identified together with several weld chromophores in the light brown sample S4 and in yellow sample S14. Brazilwood is known for its
fast light degradation [33], and the colour fading in
10 12 14 16 18 20 22 24 26 28 30 Time (min) 0 10 20 30 40 50 60 70 80 90 100 Relative Absorbance 1 2 3 4,5 6 8 9 7
Fig. 5 LC-DAD-MS chromatogram of sample S12. Identification of the chromatographic peaks based on UV and mass data (Table2) as follows: (1) luteolin di-O-glucoside; (2) luteolin 3,7′-di-O-glucoside; (3) luteolin 7-O-glucoside; (4) luteolin 4′-O-glucoside; (5) apigenin 7-O-glucoside; (6) luteolin 3′-O-glucoside; (7) chrysoeriol 7-O-gluco-side; (8) luteolin; (9) apigenin
Arraiolos carpets has already been described by Pessanha
[35], who stated that some areas originally dyed in red hues
became brownish with time. Sample S3 was taken from the filling colour of the studied carpet, and sample S14 belongs
to the border and fringe (Fig. 2). Brazilwood dye
photo-degradation has a tremendous impact in the actual perception of this carpet when compared to what it might have originally been intended by its makers. Despite the referred use of brazilwood in the Arraiolos historical dyeing
recipes [34], it is now for the first time tentatively identified
in these carpets.
Indigo, together with weld, was identified in green samples S5, S7 and S8 and in blue samples S9, S10 and
S11. Green dyes are rare [2], and green hues were usually
obtained by sequentially dyeing the fibre with blue and yellow dyes. Arraiolos recipes refer the use of weld and
indigo to dye wool fibres in green hues [34]. The
identification of indigotin as the chromatographic peak eluting at approximately 26.50 min was done based on its
characteristic UV–Vis and mass spectra [12, 44, 45]. As
reported in the literature [12, 45], indigoids are generally
detected in the ESI positive mode, presenting low intensity signals. The samples yielded the protonated molecular ion
[M+H]+at m/z263 and the characteristic fragment ions [M
+H−28]+ at m/z235 and [M+H−44]+ at m/z219, which
correspond to the subsequent loss of CO and NH2.
As stated before, indigo was obtained throughout a fermentation process of I. tinctoria L. (commonly known as woad and widely available in Southern and central Europe, North Africa and West Asia) or I. tinctoria L. (a native of
tropical Asia) [2]. The indigo made from I. tinctoria was of
superior quality and was widely available in Europe in the
eighteenth century [2]. Despite the historical interest, it is
not possible to identify the plant species based solely on the indigotin identification in the textile fibres.
Extraction of brown sample S2 and white sample S6 did not yield any recognizable dye on the chromatogram.
The colour hue of a fibre is known to be dependent on the
overall dyeing process [1,2]. Apart from the used natural dye
and dyeing method, the concentration and chemical nature of
the mordant strongly affects the fibre colour [46]. When the
mordant used is an inorganic salt, the metal ion combines with the fibre and dye via a lasting chemical bond (forming a coordination compound), ensuring that the colour stand fast against washing but also having a great influence on the final
colour obtained [1, 2]. Despite the reported use of other
metal salts, alum, an aluminium sulphate, has always been the most used mordant for the red and yellow flavonoid dyes, recognized for the brilliance of the colours obtained
[46]. Alum is also the only mordant referred in the Arraiolos
historical dyeing recipes [34].
In order to account for the mordant effect in the colours seen in the Arraiolos carpet studied, mordant metal ion
identification and quantification in the collected samples
were accomplished by ICP-MS (Fig.6). Analysis of Al, Fe,
Cu and Zn contents in blank solutions was below the limit of detection (LOD) of the analytical method (data not shown). Metal ion quantification was also performed on several samples of actual untreated sheep wool, and the amounts detected were much lower than those detected in the samples of the historical carpet (data not shown).
Overall, the results showed that Al, Fe and Zn are detected in higher concentration than Cu, which is only detected in very residual amounts. The amounts of Zn are relatively high in several samples. Zn salts have been seldom referred as mordants, with exception of some reports on their use together with weld to obtain yellow
hues in Coptic textiles [47, 48]. Sometimes the
identifica-tion of moderate amounts of metallic ions other than Al on fibres has been attributed to several unintended factors, like the use of metallic containers in the dyeing process (the usual acidic conditions of the dye bath can lead to selective leaching), contaminations from the alum used or the
presence of accumulated dirt [49–52]. We cannot know
for sure the source of Zn in the Arraiolos samples but, considering the available literature and the historical sources on the making of these carpets, it is unlikely that zinc salts have been used as mordants.
Al was identified as the most abundant metal ion in most of the samples, confirming the wide use of alum as mordant. An unusual find was the detection of Al in the
blue samples, S9–S11 (Fig.6), along with indigo (Table2).
Indigo is a vat dye which does not require the use of
mordant in the dyeing process [1, 2] and, as expected,
Arraiolos historical recipes also do not refer the use of
mordants for the blue hues [34].
0.0 1.0 2.0 3.0 S1 S2 S3 S4 S5 S6 S7 S8 S9 S10 S11 S12 S13 S14 Mor d ant m e ta l ion ( M e ) conce n tr at ion (mg Me /gwo o l ) Sample
Mordant metal ion Al
Fe Cu Zn
Fig. 6 ICP-MS mordant metal ion (Me) quantification (mgMe/gwool) in the Arraiolos carpet historical samples
Sample S6 is white, and no dye component could be
extracted from it (Table2) which led us, initially, to assume
that natural sheep wool had been used for this embroidery area. However, mordant analysis detected a significant
amount of Al in this sample (Fig. 6), an unusual finding
considering the extremely lower amounts of Al obtained nowadays for untreated wool.
Whenever used, iron salts are known to substantially alter the resulting colours, with a shift towards dark shades
[46]. In some regions of Europe, dyers learned early how to
combine natural dyes with mud or silt rich in iron salts, which worked as mordants and darkened the fibre colours
[53]. High amounts of iron were detected in black sample
S1 and brown sample S2 (Fig.6). The use of iron mordant
partially explains the S1 fibre hue which would be unexpected based solely in the chromophore analysis. However, it is possible that the fibre black hue was also attained by the use of naturally dark coloured wool. Mordant analyses indicate that S2 sample presents high
amounts of Fe and Zn (Fig. 6) despite the fact that no
chromophore could be identified in it (Table2). It is likely
that dark brown wool was also used in this sample.
Conclusions
Natural dyes are chemically very different, making their effective extraction from textile fibres a complex and difficult task. Despite different extraction yields within the classes of natural dyes, the evaluation of eight extraction procedures available in the literature led us to conclude that the most adequate procedure to extract the tested natural dyes from dyed wool fibres is the use of a mixture of
Na2EDTA/DMF (EDTA-2 method) [22].
The Na2EDTA/DMF procedure was used to extract
samples collected from an eighteenth century Arraiolos carpet. The procedure proved to be very effective as several dye components could be recovered from most of the samples. The effectiveness of the extraction procedure was most evident in the extraction of up to nine different flavone derivatives from different samples, enabling the identification, with a high degree of certainty, of the usage of weld in the making of these carpets.
Despite being referred in the historical literature concerning Arraiolos carpets, the use of brazilwood dye was for the first time described, based on the extraction of a degradation product of the dye.
Mordant analysis also showed that apart from alum, which was referred in the historical literature, iron salts have also been used as mordants in the Arraiolos making. The identification of significant amounts Al in blue samples came as a surprise considering the nature of the indigo dye.
Acknowledgements This work was funded by the Portuguese Foundation for Science and Technology (FCT) (grant no. FCOMP-01-0124-FEDER-010482). A. Manhita also acknowledges FCT for a Ph.D. Fellowship (SFRH/BD/22411/2005). The authors acknowledge architect Teresa Pacheco Pereira from the National Museum of Ancient Arts, Institute of Museums and Conservation for the Arraiolos carpet selection and Mr. Luis Pedro from the Conservation and Restoration Department, Institute of Museums and Conservation for his help in collecting the historical samples. The authors also wish to thank Prof. Pat Sandra and Dr. Lieve Balcaen for the ICP-MS analyses.
References
1. Bechtold T, Mussak R (2009) Handbook of natural colorants. Wiley, West Sussex
2. Ferreira ESB, Hulme AN, McNab H, Quye A (2004) Chem Soc Rev 33:329–336
3. Gilbert KG, Cooke DT (2001) Plant Growth Regul 34:57–69 4. Colombini MP, Andreotti A, Beraldi C, Degano I, Łucejko JJ
(2007) Microchem J 85:174–182
5. Wouters J, Verhecken A (1989) Stud Conserv 34:189–200 6. Wouters J, Rosario-Chirinos N (1992) J Am Inst Conserv 31:
237–255
7. Novotná P, Pacáková V, Bosáková Z, Štulik K (1999) J Chromatogr A 863:235–241
8. Orska-Gawrys J, Surowiec I, Kehl J, Rejniak H, Urbaniak-Walczak K, Trojanowicz M (2003) J Chromatogr A 989:239–248 9. Ahn C, Obendorf SK (2004) Tex Res J 74:949–954
10. Surowiec I, Nowick W, Trojanowicz M (2004) J Sep Sci 27:209–216 11. Surowiec I, Quye A, Trojanowicz M (2006) J Chromatogr A
1112:209–217
12. Rosenberg E (2008) Anal Bioanal Chem 391:33–57
13. Petroviciu I, Albu F, Medvedovici A (2010) Microchem J 95:247–254 14. Szostek B, Orska-Gawrys J, Surowiec I, Trojanowicz M (2003) J
Chromatogr A 1012:179–192
15. Ackacha MA, Połeć-Pawlak K, Jarosz M (2003) J Sep Sci 26:1028–1034
16. Zhang X, Laursen RA (2005) Anal Chem 77:2022–2025 17. Balakina GG, Vasiliev VG, Karpovam EK, Mamatyuk VI (2006)
Dyes Pigm 71:54–60
18. Zhang X, Good I, Laursen RA (2008) J Archaeol Sci 35:1095–1103 19. Zhang X, Laursen RA (2009) Int J Mass Spectrom 284:108–114 20. Rafaëlly L, Héron S, Nowik W, Tchapla A (2008) Dyes Pigm
77:191–203
21. Valianou L, Karapanagiotis I, Chryssoulakis Y (2009) Anal Bioanal Chem 395:2175–2189
22. Tiedemann EJ, Yang YQ (1995) J Am Inst Conserv 34:195–206 23. Kirby J, White R (1996) Natl Gallery Tech Bull 17:56–80 24. Campbell L, Dunkerton J, Kirby J, Monnas L (2001) Natl Gallery
Tech Bull 22:29–41
25. Sanyova J, Reisse J (2006) J Cult Herit 7:229–235
26. Guinot P, Andary C (2006) Molecules involved in the dyeing process with flavonoids. Oral presentation, 25th Meeting of Dyes in History and Archaeology, Suceava, Romania
27. Schweppe H (1979) J Am Inst Conserv 19:14–23
28. Surowiec I, Orska-Gawrys J, Biesaga M, Trojanowicz M, Hutta M, Halko R, Urbaniak-Walczak K (2003) Anal Lett 36:1211–1229 29. Pacheco Pereira T (1997) Tapetes de Arraiolos. Estar Ed, Lisboa 30. Park JH, Gatewood BM, Ramaswamy GN (2005) J Appl Polym
Sci 98:322–328
31. Ferreira ESB, Quye A, McNab H, Hulme AN, Wouters J, Boon JJ (1999) In: Bridgland J (ed) Preprints of the 12th triennial meeting
of the ICOM committee for conservation. James and James (Science) Publishers, London
32. Moiteiro C, Gaspar H, Rodrigues AI, Lopes JF, Carnide V (2008) J Sep Sci 31:3683–3687
33. Hulme AN, McNab H, Peggie DA, Quye A (2005) Phytochem-istry 66:2766–2770
34. Rivara JHC (1985) Memorias da Villa de Arrayolos. Câmara Municipal de Arraiolos, Arraiolos
35. Pessanha DS (1917) Tapetes de Arrayollos. Annuario Commercial, Lisboa
36. Oliveira FB (1973) História e Técnica dos Tapetes de Arraiolos. Sociedade Astória, Lisboa
37. Marques R, Sousa MM, Oliveira MC, Melo MJ (2009) J Chromatogr A 1216:1395–1402
38. Ferreira ESB, Quye A, McNab H, Hulme AN, Wouters J, Boon JJ (2001) Dyes Hist Archaeol 16(17):179–186
39. Rodríguez ES, Rodríguez AA, Rodriguéz MAG, del Egido M, Cámara C (2010) e-Conservation Magazine 15:32–45
40. Mathias C, Moffatt E, Murray A (2004) J Can Assoc Conserv 29:26–41
41. Fabre N, Rusta I, de Hoffmann E, Quetin-Leclercq J (2001) J Am Soc Mass Spectrom 12:707–715
42. Karapanagiotis I, Minopoulou E, Valianou L, Daniilia S, Chryssoulakis Y (2009) Anal Chim Acta 647:231–242
43. Karapanagiotis I, Lakka A, Valianou L, Chryssoulakis Y (2008) Microchim Acta 160:477–483
44. Pawlak K, Puchalska M, Miszczak A, Rosłoniec E, Jarosz M (2006) J Mass Spectrom 41:613–622
45. Puchalska M, Połeć-Pawlak K, Zadrozna I, Hryszko H, Jarosz M (2004) J Mass Spectrom 39:1441–1449
46. Mussak R, Bechtold T (2009) In: Bechtold T, Mussak R (eds) Handbook of natural colorants. Wiley, West Sussex
47. Taylor GW (1986) Rev Prog Color 16:53–61
48. Trojanowicz M, Orska-Gawrys J, Surowiec I, Szostek B, Urbaniak-Walczak K, Kehl J, Wróbel M (2004) Stud Conserv 49:115–130
49. Dussubieux L, Ballard MW (2005) Mater Res Soc Symp Proc 852:291–296
50. Siva R (2007) Curr Sci 92:916–925
51. Koestler RJ, Sheryll R, Indictor N (1985) Stud Conserv 24:110–115 52. Schweitzer PA (2003) Metallic materials—physical, mechanical,
and corrosion properties. Marcel Dekker, Inc., New York 53. Pastoreau M (2008) Black: the history of a color. Princeton