i
COMPARING
THE
PERFORMANCE
OF
OVERSAMPLING TECHNIQUES FOR IMBALANCED
LEARNING IN INSURANCE FRAUD DETECTION
María Fernanda Osorio Moreno
Dissertation report presented as partial requirement for
obtaining the Master’s degree in Advanced Analytics
i
COMPARING THE PERFORMANCE OF OVERSAMPLING TECHNIQUES FOR IMBALANCED LEARNING IN INSURANCE FRAUD DETECTION
María Fernanda Osorio Moreno
MAA
ii
NOVA Information Management School
Instituto Superior de Estatística e Gestão de Informação
Universidade Nova de Lisboa
A COMPARISON OF OVERSAMPLING TECHNIQUES FOR
IMBALANCED DATA SETS FOR MODELING COMPULSORY
INSURANCE FRAUD DETECTION
by
María Fernanda Osorio Moreno
Dissertation report presented as partial requirement for obtaining the Master’s degree in Advanced Analytics
Advisor / Co Advisor: Fernando Bação
iii
ABSTRACT
Although the current trend of data production is focused on generating tons of it every second, there are situations where the target category is represented extremely unequally, giving rise to imbalanced datasets, analyzing them correctly can lead to relevant decisions that produces appropriate business strategies. Fraud modeling is one example of this situation: it is expected less fraudulent transactions than reliable ones, predict them could be crucial for improving decisions and processes in a company. However, class imbalance produces a negative effect on traditional techniques in dealing with this problem, a lot of techniques have been proposed and oversampling is one of them.
This work analyses the behavior of different oversampling techniques such as Random oversampling, SOMO and SMOTE, through different classifiers and evaluation metrics. The exercise is done with real data from an insurance company in Colombia predicting fraudulent claims for its compulsory auto product. Conclusions of this research demonstrate the advantages of using oversampling for imbalance circumstances but also the importance of comparing different evaluation metrics and classifiers to obtain accurate appropriate conclusions and comparable results.
KEYWORDS
iv
INDEX
Contenido
1.
Introduction ... 1
2.
Literature review ... 3
2.1.
Fraud Modeling ... 3
2.2.
Compulsory auto insurance ... 3
2.3.
Imbalanced datasets... 4
2.3.1.
Sampling strategies ... 4
2.3.2.
Cost sensitive learning ... 5
2.3.3.
Algorithmic classifier modifications ... 5
2.3.4.
Ensemble methods ... 5
2.4.
Sampling strategies ... 5
2.4.1.
Random oversampling ... 5
2.4.2.
SMOTE ... 5
2.4.3.
SOMO ... 6
3.
Experimental methodology ... 7
3.1.
The data ... 7
3.2.
Methodology ... 7
3.2.1.
Evaluation metrics review ... 7
4.
Results and discussion ... 10
4.1.
Step 1: no sampling strategy ... 10
4.2.
Step 2: Comparing different oversampling techniques ... 11
5.
Conclusions and future work ... 14
v
LIST OF FIGURES
Figure 1 Roc Curve ... 8
Figure 2 Results for non oversampling strategy ... 10
Figure 3 Results for comparison between overampling techiniques - Mean cv score ... 12
vi
LIST OF TABLES
1
1. INTRODUCTION
The use of analytics in financial enterprises has risen through time; nowadays it is more common to base decisions and strategies on data and not only on instinct. Increment of available data which allows identifying trends and patterns to help companies to improve their relationship with clients and effectiveness of marketing campaigns, optimize processes, have a better administration of resources and maximize earnings. Applying predictive models for forecasting fraud is one of the most challenging tasks in which organizations are facing in this context.
Identifying fraudulent behavior is meaningful for financial companies due to the disastrous consequences it brings with it: economic losses, affectation on its public image, client’s forfeiture and wastage of processes are some of them.
In Colombia, exists a huge problem related to this situation, insurance companies are dealing with a fraud giant presented in compulsory auto insurance. Millions of dollars in losses force the search of methodologies to have answers against this situation where predictive models have been considered as one of them.
Unfortunately for prediction aspects, because of the nature of this phenomenon the data found for fraudulent transactions is considerably less than the whole existing ones which has as a consequence low performance of traditional predictive methodologies leading us to a problem of skewed distribution type. For this reason, academic community has proposed different solutions to mitigate this problem. One of them, consist in preprocessing the data to rebalance data either creating new individuals with the characteristic of interest –Oversampling -or deleting instances from the majority class - Undersampling - (Haixiang, Yijing, Shang, Mingyun, & Yuanyue, 2016).
This paper is focused on comparing different oversampling strategies for fraud prevention based on different measures for an insurance company in Colombia. The rest of this paper is structured as follows: in the first part, an overview of the context which gives rise to the motivation of this study is given, in section 3 a general review related with oversampling techniques and imbalanced problem is presented. In section 4 research methodology is explained followed by results and discussion in section5. Finally, conclusions and future work are expressed on section6.
3
2. LITERATURE REVIEW
2.1.
FRAUD MODELINGAlthough companies’ efforts for fighting against fraud has increased over time and more sophisticated methodologies have been used, its consequences are still evident in economic enterprises losses, according to (2016 Global Economic Crime Survey, 2016) in the insurance context this numbers are noticeable in approximately $80 billion losses a year across all lines of insurance in U.S (Coalition Against Insurance Fraud, n.d.). (Global Fraud Report) Germany, through the insurance association (GDV) estimates (Hartley, 2016) In Colombia, the National Institute for Investigation against Fraud (INIF) ensures that (Chacón, 2017).
It is important to remark that repercussions transcend to economic injuries and are visible also in savings losses, premiums increase for users, distrust in insurance sector and insurer’s image discredit. This problem, has produced the need for the insurance sector to improve their business processes control, unfortunately, it can be traduced in tedious operational tasks which represent a lot of budget and execution time.
For this reason, statistical methods and models have been developed, used and improved in order to find patterns which establish fraud behavior and allow acting opportunely. (Decker, 1998)
According to Forbes magazine (Skeels & Pan, 2016) “For executives seeking to increase the competitiveness of their business, preventing fraud and its impacts in a cost efficient and effective way presents a major opportunity to grow the bottom line.”
A lot of research can be found in the fraud prevention context (Phua & Alahakoon, 2004) (Wei, Jinjiu, Longbing, Yuming, & Jiahang, 2012) (Barnarescu, 2016) (Ibrahim Hassan & Abraham Ajith, 2015) (Kim, Baik, & Sungzoon, 2016) (Sahin, Bulkan, & Duman, 20132), the main goal is to find the best statistical model that allows the identification of fraud transactions or events obtaining more gain and less operative procedures time.
2.2. COMPULSORY AUTO INSURANCE
The Compulsory Auto insurance (SOAT) formed in Colombia in 1986 legislated by the national low as a response to automotive accidents increment with 1.3 million of fatal victims and more than 50 million of injured people which leads to a public health problem, its “social” purport consists in guarantee a basic medical attention to all the victims of this type of accident occurred in the country. Unfortunately, because of the mismanagement carried out by the government, health entities and users, most of the cases related with fraud, and the impossibility to determine the premium according to the risk, the insurance companies which provide this coverage had state annual losses for more than 54 million dollars.
The SOAT (according to its acronym in Spanish) is highly sensitive to fraud; the actions made by fraudsters can be enumerated as follows:
4 Charging the same bill to different insurance companies
Using the policy to charge medical treatments resulting from different situations than car accidents.
Health companies can charge bills related to nonexistent patients or apply unnecessary treatments like surgeries to the injured person.
Nonexistent health entities charge fake bills to the insurance companies Use of fake policies
Inflation of treatments and medicines costs.
2.3. IMBALANCED DATASETS
Fraud is an unusual event in most industries, for insurance industry it is supposed to expect fewer fraudulent claims than non-fraudulent cases. Also, the cost of misclassified a fraudulent claim is higher than a considered rightful claim as a counterfeit claim. Hence, fraudulent claims prediction can be defined as an imbalanced classification task.
Imbalanced datasets can be defined as datasets in which the existing classes are not represented in the same proportion and where the misclassification costs are not equal. Therefore, learning from it for classification purposes becomes a very difficult task:
Most of classifiers (Regression models, Support Vector Machine (SVM), Decision tress or Neural Networks) present a poor performance when they are facing with unbalanced data: they can have a good accuracy for majority class but poor results for the class of interest. This, since they were created precisely assuming a balanced distribution or equal misclassification costs. (Haibo, 2009) Additionally, differentiate between rare cases and the minority class is challenging: examples belonging to the lesser class can be identified by the algorithm as noise or outliers, and in the same way noisy individuals can be treated as the individuals of interest. (Beyan & Fisher, 2015)
Because of the relevance of this situation and the importance of treat it the best way, a lot of research has been developed for deal with it, (Haixiang, Yijing, Shang, Mingyun, & Yuanyue, 2016) presents a review from 527 papers where the work of 10 years of study are shaped.
There exist four main groups were the proposed solutions can be categorized:
2.3.1. Sampling strategies
This kind of approach is applied before any classification algorithm, the goal is to reduce the skewed distribution that exist in the data either introducing synthetic individuals to the minority class (resampling) or deleting instances from the majority class (undersampling).
5
2.3.2. Cost sensitive learning
This method consists in define a cost values of misclassification, most of times defined based on business knowledge, and introducing it in the sampling stage (Cost Curves) or in the classification algorithm (Cost matrices).
2.3.3. Algorithmic classifier modifications
As it was presented, traditional methodologies suppose a balanced distribution, changing them to improve their learning ability is the goal of this result. Kernel and activation function transformation applied to Support Vector Machine (Chen, Fan , & Sun, 2012) and Neural Networks (Perez-Godoy, Fernandez, Rivera, & del Jesus, 2010) are some examples.
2.3.4. Ensemble methods
The main idea of this solution is to merge different classifiers to increase prediction accuracy by using several independent algorithms at the same time. Bootstrap aggregating and boosting are the most common ensemble types. The first one is a parallel base method while in the second, each model is run after obtain the results of the previous one. For fraud prevention (Phua & Alahakoon, 2004) combine bagging and stacking to achieve more cost savings.
2.4. SAMPLING STRATEGIES
Oversampling strategies are probably the method with a more extended research because for being intuitive and with easy application , through years, a lot of research had been developed not only in the theoretical context (Sun, Song , Zhu, Xu, & Zhou, 2015) (Nekooeimhr & Lai-Yuen, 2016) (Menardi & Torelli, 2014) (Bowyer, Hall, Kegelmeyer, & Chawla, 2002) (Douzas & Bação, 2018) (Last, Douzas, & Bacao, 2017) (Douzas & Bação, 2017) but also in the practical one (Zhang , Ma, Ji, Niu, & Xu , 2015) (Yang , Xu, Zhou, Zhang, & Zomaya, 2009) (Li, Fong , Wong, Mohagmmed, & Fiaidhi , 2016). Different methods have been proposed to reach a balanced data based by adding new individuals belonging to the minority class (Haixiang, Yijing, Shang, Mingyun, & Yuanyue, 2016) (Solberg & Solberg, 1996).
2.4.1. Random oversampling
As it is described in its name, this technique, which is the easiest to perform, balance the data by taking individuals from the minority class and replicating them according to the existing skewness. However, it increases the performance of the classifiers and is independent algorithm (del Rio, Benítez, & Herrera Franciso, 2015) (Zhou, 2013) (Lopez, Fernandez, García, Palade, & Herrera, 2013) (Loyola- Gonzalez, Martinez-Trinidad, Carrasco - Ochoa, & Garcia-Boroto, 2016) (Napierala & Stefanowski, 2015), it can also produce oversampling based on the fact of replying exact copies of the real instances.
2.4.2. SMOTE
SMOTE formed in order to deal with the previous enumerated problem (Bowyer, Hall, Kegelmeyer, & Chawla, 2002) by randomly selecting each time an instance from the minority class and identify some of the nearest neighbors of it, based on the Euclidean distance, and create new individuals based on
6 linear interpolations between the selected item and its neighbors, it is important to remark that the overlap between the two cases can be increased due to the generation of the same number of artificial instances for each minority individual (Zhu, Baesens, & Vanden Broucke, 2017).
2.4.3. SOMO
Self-Organizing Map Oversampling (SOMO) is an informed oversampling method focused on having a better minority class selection by avoiding the election of noisy individuals and obtaining a better distribution in the data space of the synthetic examples generated. The algorithm was designed in three stages: 1) separate the initial dataset into clusters that are obtained after applying Self Organizing maps algorithm. Due to the topology preservation of the SOM algorithm (Bação & Lobo, 2010), points that are close to each other in the input space are graphed on adjacent map units (Kohonen, 2001) 2) generate synthetic individuals for the minority class using individuals that belong to the same cluster 3) reproduce synthetic individuals for the minority class based on instances that belong to adjacent clusters in the two-dimensional grid. The density of the cluster is considered for the distribution of the intracluster and intercluster data distribution (Douzas & Bacao, 2017).
This algorithm counteracts some of the problems that traditional oversampling methodologies present:
1. Overfitting; when a lot of instances belonging to the minority class are replicated, the data set could become too specific, lead to a high accuracy in the train data but to a poor classification capability on the test data (Holte, Acker, & Porter, 1989), this could happen using random oversampling (Mease, Wyner, & Buja, 2007) . However, using methodologies based on K nearest neighborhoods as SMOTE could also lead to generate noisy samples: nearly duplicates samples which have the same result, there is not generation of new information but increasing dense minority class areas (Douzas & Bacao, 2017). Additionally, SMOTE algorithm can lead to an increase of overlap between classes since it generates the same number of synthetic minority individuals for each original minority example and does not take into consideration neighboring instances belonging to the majority class (Zhu, Baesens, & Vanden Broucke, 2017).
2. Generation of noisy examples in the majority class; for the same reason explained above, K nearest neighborhood based methodologies, can introduce noisy examples that penetrate around majority class examples area (Douzas & Bacao, 2017). This could bring as a consequence a reduction in the accuracy of both, the minority but also de majority class (Kotsiantis, Kanellopoulos, & Panayiotis, 2006).
3. Assume a simple manifold structure for the input space; the use of methods based on the Euclidean distance for determine the minority instances neighbors can have troubles when the dimensionality increases and the data become sparse (Beyer, Goldstein, & Ramakrishnan, 1999).
7
3. EXPERIMENTAL METHODOLOGY
3.1. THE DATA
The main goal of this paper is to compare the behavior of different oversampling techniques through different classifiers and evaluation metrics with real data. For this, a dataset from a global insurance company in Colombia regarding its three previous year’s compulsory auto insurance claims is used. Imbalance phenomenon is presented with only 3.7% of fraudulent cases from 48.570 examples. The database has 32 independent variables that describe the nature about the accidents and the behavior of the actors in the company such as: injured person, insurance policy and vehicle, date of accident, insured person, accident location and hospital characteristics. These variables are going to classify between fraudulent and non-fraudulent claims.
3.2.
METHODOLOGYThe execution of this experimental research is based on the comparison of four methodologies used for treat imbalanced datasets: random oversampling, SMOTE, SOMO and none-oversampling technique; we will compare them through different classifiers: Decision threes, k- nearest neighbors and logistic regression and distinct evaluation metrics: F1 score, geometric mean score and ROC curve analysis.
The use of different classifiers and evaluation metrics is motivated on having robust results: independent from the classifier or metric used. Every experiment (oversampling methodology – evaluation metric) is repeated 5 times and consists of a 5-fold cross validation procedure. For this reason, results are reported over the mean coefficient of variation and standard deviation coefficient of variation across the experiments.
3.2.1. Evaluation metrics review
The use of the confusion matrix in order to validate classifiers performance is common. The main goal of this tool is to compare predicted values (columns) vs the actual ones (rows) as is illustrated in Table 1.
Predicted:N
Predicted:P
Actual:N
TN
FP
Actual:P
FN
TP
Table 1 Confusion Matrix
Values in the diagonal represents those individuals whose classification was correct: True negatives (TN) and true positives (TP). On the other hand, FN (False negatives- Positive individuals classified as negative) and FP (False Positive – Negative individuals classified as positive) are those instances with a wrong classification. Based on this, the predictive accuracy is defined as a performance evaluation measure:
8 However, when imbalance is presented predictive accuracy is not as convenient as in a balanced dataset. For this reason, different evaluation metrics are considered to develop this analysis.
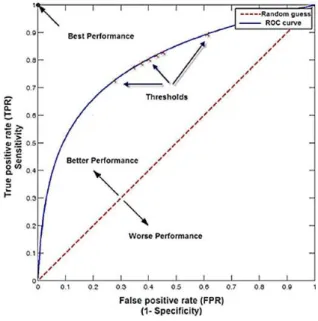
3.2.1.1. Roc curve analysis
Receiver operating characteristic (ROC) curve analysis is usually used as the criterion of evaluation in problems with dichotomic response variable and apply it on imbalance datasets problems is also common. It works by summarizing classifier performance over a range of tradeoffs between true positive and false positive error rates (Chawla, 2005).
Defining TP as the true positive classified examples, TN as the true negative, FP as the false positive and FN as the false negative instances; false positive and true positive rates are expressed as follows:
ROC curve is obtained by plotting false positive rates (x-axis) versus true positives rates (y-axis), thus, the point (0,100) represents the ideal scenario in terms of misclassification costs: all positive examples are classified correctly and no negative examples are misclassified as positive. Area under the ROC curve (AUC) aggregates the performance of a classification model into a single number and not only allows comparing different ROC curves. (Zhu, Baesens, & Vanden Broucke, 2017). It is remarkable from Figure 1 than for a pure random classification model the AUC values is equal to 0.5, thus, a good classifies should reach an AUC larger than 0.5.
9
3.2.1.2. F1 score
Based on the confusion matrix (Table 1), precision and recall can be defined (Buckland & Gey, 1994):
The F1 score or F-value is based on these two concepts. Working with imbalanced datasets imply to reach a recall improvement without affecting the precision, this goal is very difficult to achieve since increasing the true positive for the minority class the number of false positives could be also increased, reducing the precision (Chawla, 2005).
Although Roc curve represents the tradeoff between TP and FP values, the F score seeks to represent the trade-off among different values of TP, FP and FN. (Buckland & Gey, 1994). This evaluation metric can be expressed as follows:
It is common to assume that precision and recall have the same meaningfulness, this means β=1.
3.2.1.3. Geometric mean score
Geometric mean score is defined as the geometric mean of the true positive rate (*) and the true negative rate (Douzas & Bacao, 2017). This las one is defined as:
This evaluation metric has been widely used for testing the performance of models applied to imbalanced datasets. It is calculated as follows:
10
4. RESULTS AND DISCUSSION
This research work is accomplished in two main steps to compare the impact of oversampling the data on imbalanced datasets. Firstly, comparison between different classifiers and evaluation metrics is executed with the original data. After this, different oversampling techniques are executed for evaluating the impact on the evaluation metrics results through the different classifiers used.
4.1.
STEP 1: NO SAMPLING STRATEGYAs a first step, different classifiers and evaluation metrics are going to be tested on the original data, this means, imbalanced data with no oversampling. As it can be seen in Figure 2 defining the best classifier depends on the chosen evaluation metric, if we analyze the geometric mean or the F-score, the best classification methodology would be the decision tree, however, considering the AUC from the ROC curve, a logistic regression should be the selected classifier. Notice that this last predictive model obtained more stable results, which is evident on a standard deviation results.
11
4.2.
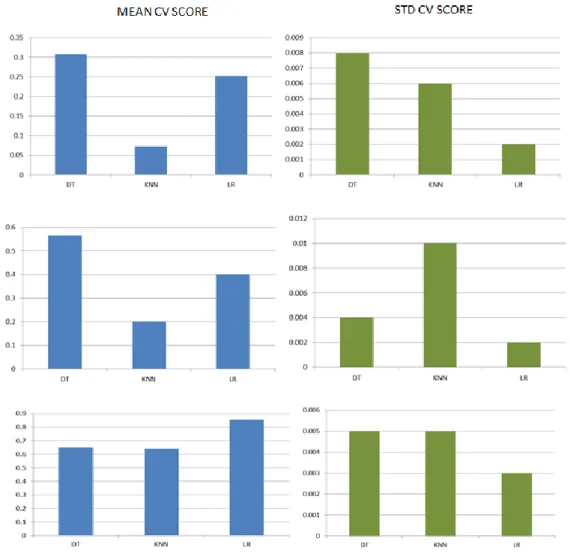
STEP 2: COMPARING DIFFERENT OVERSAMPLING TECHNIQUESAfter comparing different classifiers with the original dataset, research is now focused on test different oversampling techniques on the defined models. Figure 3 and Figure 4, shows the results for each classification methodology (Decision trees, k nearest neighbor and Logistic regression) using the selected oversampling techniques (Random oversampling, SMOTE and SOMO) and evaluation metrics.
As the main objective of this analysis is to evaluate different procedures used for balance skewed datasets, results are going to be presented for each classifier, evaluating the impact of creating a proportionated-class data. This, by comparing the results with those achieved in step 1, considering this last one as the base of the analysis.
Firstly, for decision trees, we can observe by comparing the F-score outputs that the use of SOMO and random oversampling generated better results, while Geometric mean presented an improvement only with SOMO algorithm. Contrary to this, ROC AUC score didn’t show a better performance. It is remarkable that among the different evaluation metrics results were more stable. On the other hand, outputs for k-nearest neighbor classifier, evidence that the use of any oversampling techniques will increase its performance no matter the evaluation metric used, however, SOMO algorithm results are significantly better. The improvement in outputs was superior not only on classifier performance but also in the stability of the results.
Finally, for logistic regression is noticeable that only when the evaluation metric is the geometric, meaning score results are greatly better with any oversampling technique, nonetheless, with F score measure results seems to be worst, by its side. ROC AUC score presents similar values between the data-balancing methodologies but with more solid results for SOMO.
After comparing these results, SOMO is outlined as the oversampling technique with better results through the different classifiers and evaluation metrics. It is remarkable that ROC AUC score presented the smallest difference between the different methodologies more specifically for linear regression.
12 Figure 3 Results for comparison between overampling techiniques - Mean cv score
13 Figure 4 Results for comparison between overampling techiniques - SD cv score
14
5. CONCLUSIONS AND FUTURE WORK
Mining from imbalanced datasets is indeed a very important problem from both algorithmic and performance perspective (Chawla, 2005), however, finding the correct methodology for doing it, brings important knowledge for companies decisions such as detecting fraud claims in the insurance context.
Taking into account the damage that fraud has done to the compulsory auto insurance in Colombia in terms of financial losses, use predictive analytics in order to create preventive strategies detecting fraud claims reaches as a crucial solution. In this work we compare different oversampling techniques across different classifiers obtaining as a conclusion that SOMO technique had better performance results in the majority of cases but also that not in all cases oversampling methodology achieve better results, these outcomes are meaningful thanks to having different evaluation metrics which lead us to comparable conclusions in each step of the research.
For future work it is necessary to carry these results to the business operation in the insurance world in order to determine the possible financial savings that analyzing imbalanced datasets can bring. This, taking into account that methodologies that produces better performance in classification tasks are found, contributing to fighting against the traditional problems that this type of situation bring with it.
15
6. BIBLIOGRAPHY
Skeels, A., & Pan, M. (11 de 2016). Combating Fraud Creates Opportunity: Increase The Bottom Line
With Fraud Detection. Obtenido de Forbes Magazine:
https://www.forbes.com/sites/riskmap/2016/11/16/combatting-fraud/#6ff129ae23d8 (2016). 2016 Global Economic Crime Survey. (Pwc.com, Entrevistador)
Bação, F., & Lobo, V. (2010). Introduction to Kohonen's Self-organizing Maps. Universidade Nova de
Lisboa.
Barnarescu, A. (2016). Detecting and preventing fraud with data Analytics. Procedia economics and
finance, 1827-1836.
Beyan, c., & Fisher, R. (2015). Classifying imbalanced data sets using similarity based hierachical decomposition . Pattern Recognition, 1653- 1672.
Beyer, K., Goldstein, J., & Ramakrishnan, R. (1999). When is nearest neighbor' meaningful? Database
theory - ICDT99, 217-235.
Bowyer, K., Hall, L., Kegelmeyer, P., & Chawla, N. (2002). SMOTE: Synthetic Minority Oversampling Techinque. Journal of artificial intelligence research, 321-357.
Buckland, M., & Gey, F. (1994). The relationship between recall and precision. Journal of amercian
society for information science , 12-19.
Chacón, L. (2017). Detección del Fraude, una Estrategia Interdisciplinaria. INIF. Bogotá.
Chawla, N. (2005). Data Mining for imbalanced datasets: An overview. En O. Maimon, & L. Rokach,
Data Mining and Knowledge Discovery Handbook (págs. 853-857). Springer.
Chen, Z.-Y., Fan , Z.-P., & Sun, M. (2012). A hierarchical multiple kernel support vector machine for customer churn prediction using longitudinal bahvioral data . European Journal of
Operational Research , 461-472.
Coalition Against Insurance Fraud . (s.f.). Obtenido de http://www.insurancefraud.org/statistics.htm
Decker, P. (1998). Data Mining's Hidden Dangers. Banking Strategies. 6-14.
del Rio, s., Benítez, J., & Herrera Franciso. (2015). Analysis of Data Preprocessing Increasing the Oversampling Ratio for Extremely Imbalanced Big Data Classification. Finland: IEEE. Douzas, G., & Bação, F. (2017). Geometric SMOTE: Effective oversampling for imbalanced learning
through a geometric extension of SMOTE. arXiv preprint arXiv 1709.07377.
Douzas, G., & Bacao, F. (2017). Self-Organizing Map Oversampling (SOMO) for imbalanced data set laerning. Expert systems with Applications, 40-52.
Douzas, G., & Bação, F. (2018). Effective data generation for imbalanced learning using conditional generative adversarial networks. Expert Systems with applications 91, 464-471.
16
Global Fraud Report. (s.f.). Obtenido de Association of Bristish Insurers:
http://anticorruzione.eu/wp-content/uploads/2015/09/Kroll_Global_Fraud_Report_2015low-copia.pdf
Haibo, H. (2009). Learning from Imbalanced Data. IEEE Transactions on knowledge and data
engineering, 1263-1284.
Haixiang, G., Yijing, L., Shang, J., Mingyun, G., & Yuanyue, H. (2016). Learning from class-imbalanced data: Review of methods and applications. Expert systems and applications, 220-239. Hartley, D. (2016). Global best practice and customer cases in insurance antifraud. Data Mining's
Hidden Dangers. Russia: SAS.
Holte, R., Acker, L., & Porter, B. (1989). Concept learning and the problem of small disjuncts. Porc Int'l
Conferencial Artifical Intelligence, 813-818.
Ibrahim Hassan, A., & Abraham Ajith. (2015). Modeling Insurance Fraud detection using imbalanced data classification. Adcances in nature and biologically inspired technology, 117-127.
Kim, Y., Baik, B., & Sungzoon, C. (2016). Detecting financial misstatements with fraud intention using multi-class cost-sensitive learning. Expert systems with applications, 32-43.
Kohonen, T. (2001). Self-Organizing maps. Springer series in information sciences, 501.
Kotsiantis, S., Kanellopoulos, D., & Panayiotis, P. (2006). Handling Imbalanced datsets: A Review.
Science, 25-36.
Last, F., Douzas, G., & Bacao, F. (2017). Oversampling for Imbalanced Learning Based on K-Means and SMOTE. arXiv preprint arXiv 1711.00837.
Li, J., Fong , S., Wong, R., Mohagmmed, S., & Fiaidhi , J. (2016). Adaptive swarm balancing algortihms for rare event prediction in imbalanced healtcare data. Computarized Medical Imaging and
graphics .
Lopez, V., Fernandez, A., García, S., Palade, V., & Herrera, F. (2013). An insight into classification with imbalanced data: Empirical results and current trends on using data intrisic characteristics .
Information sciences, 113-141.
Loyola- Gonzalez, O., Martinez-Trinidad, J., Carrasco - Ochoa, J., & Garcia-Boroto, M. (2016). Study of impact of resampling methods for contrast pattern based classifiers in imbalanced databases.
Neurocomputing, 935-947.
Mease, D., Wyner, A., & Buja, A. (2007). Boosted Classification trees and class probability / Quantile Estimation . Machine learning Research, 409-439.
Menardi, G., & Torelli, N. (2014). Training and assesing classification ruls with imbalanced data. Data
Mining and knowledge discovery, 92-122.
Napierala, K., & Stefanowski, J. (2015). Types of minority class examples and their influence of learning classifiers from imbalanced data. Journal of Intelligent Information systems, 1-35.
17 Nekooeimhr, I., & Lai-Yuen, S. (2016). Adaptive semi-unsupervised weigthed oversampling (A-SUO)
for imbalanced datasets . Expert systems with applications , 405-416.
Perez-Godoy, M., Fernandez, A., Rivera, A., & del Jesus, M. (2010). Analysis of an evolutionary RBFN design algortihm , CO 2 RBFN for imbalaced data sets. Pattern recognition letters, 2375-2388. Phua , C., & Alahakoon, D. (2004). Minority report in fraud detection:classification of skeweeddata .
SIGKDD Explorations, 6.
Sahin, Y., Bulkan, S., & Duman, E. (20132). A cost-sensitive decision tree approach for fraud detection. Expert systems with Applications, 5916-5923.
Salman Haydar , D., Al Mahmud Mostafa , S., & Al Helal, M. (2016). Algorithms efficiency
measurement on imbalanced data using Geometric mean and Cross Validation. International
Workshop on Computational Intelligence. Dhaka, Bangladesh.
Solberg, A., & Solberg, R. (1996). A Large-Scale Evaluation of Features for Automatic Detection of Oil Spills in ERS SAR Images. International Geoscience and Remote Sensing Symposium, 1484-1486.
Sun, Z., Song , Q., Zhu, H., Xu, B., & Zhou, Z. (2015). A novel ensemble method for classifying imbalanced data. Pattern Reconition , 1623-1637.
Wei , W., Jinjiu, L., Longbing, C., Yuming, O., & Jiahang , C. (2012). Effective detection of sphisticated online banking fraud on extremely imabalnced data. World wide web, 449-475.
Yang , P., Xu, L., Zhou, B., Zhang, Z., & Zomaya, A. (2009). A particle swarm based hybrid system for imbalanced medical data sampling. BMC genomics, 10.
Zhang , D., Ma, J., Ji, J., Niu, X., & Xu , X. (2015). An ensemble method for unbalanced sentiment classification. 11th internation conference on IEEE.
Zhou, L. (2013). Performance of corporate bankruptcy prediction models on imbalanced dataset: The effect of sampling methods. Knowledge bases Systems , 16-25.
Zhu, B., Baesens, B., & Vanden Broucke, S. (2017). An empirical comparison of techniques for the class imbalance problem in churn prediction. Information sciences, 84-99.