Relatório Final de Estágio
Mestrado Integrado em Medicina Veterinária
ELECTROCARDIOGRAPHIC CHARACTERISTICS IN THE CASTRO
LABOREIRO DOG
Ana Filipa Costa Calejo
Orientadora:
Professora Doutora Ana Patrícia Fontes de Sousa Co-Orientador:
Professor Doutor Luis Lima Lobo (Hospital Veterinário do Porto)
Relatório Final de Estágio
Mestrado Integrado em Medicina Veterinária
ELECTROCARDIOGRAPHIC CHARACTERISTICS IN THE CASTRO
LABOREIRO DOG
Ana Filipa Costa Calejo
Orientadora:
Professora Doutora Ana Patrícia Fontes de Sousa Co-Orientador:
Professor Doutor Luis Lima Lobo (Hospital Veterinário do Porto)
AGRADECIMENTOS
À Profª. Doutora Ana Patrícia Fontes de Sousa, um muito obrigada, por toda a orientação, dedicação e sábios conselhos durante a realização deste estudo, sem a sua colaboração o sucesso não teria sido o mesmo.
Ao Prof. Doutor Luis Lobo, o meu “orientador honorário”, não tenho palavras para agradecer a forma como me recebeu e a oportunidade que me deu de o ver a trabalhar, durante os últimos anos, e pelo amigo em que se tornou. É, de facto, o grande responsável pelo meu interesse em Cardiologia, muito Obrigada!
A toda a equipa do Hospital Veterinário do Porto e aos meus colegas por terem feito deste estágio uma experiência fantástica, tanto a nível da aprendizagem como do companheirismo. Em especial à Joana Guimarães, Catarina Ferreira, Tiago Marcelino e Hélder Craveiro por me ajudarem na realização dos eletrocardiogramas.
À Profª. Doutora Alexandra Muller, pela orientação na área da estatística.
À Servive, em especial ao Sr. Alfredo Pinho, por me ter disponibilizado o eletrocardiógrafo para a realização deste estudo.
A todos os proprietários e criadores que voluntariamente permitiram a realização deste estudo.
Aos meus amigos, pela força e palavras amigas, em especial à Débora Guimarães.
A toda a família, avós, primos e tios.
Ao meu mano, Heitor, que sem saber, os seus beijinhos e carinhos davam-me força para continuar.
Aos meus pais, o vosso apoio e amor incondicional foram essenciais para chegar hoje aqui, não apenas a nível académico mas principalmente a nível pessoal.
Ao meu namorado, Bruno, pelo apoio, carinho e amizade durante os últimos anos. Pela ajuda na realização dos eletrocardiogramas, que até já sabe as cores dos eléctrodos. Sabes que sem ti não seria o mesmo.
À minha irmã, Nina, que sempre esteve do meu lado, sempre a “zelar” por mim ao longo da minha vida e principalmente pela ajuda direta e pela paciência durante a realização deste trabalho, sem ti não teria conseguido.
Sem esquecer, a Cutxi minha fiel companheira, o Limão e o Gigs, que me lembram que é por eles que vale a pena.
ABBREVIATIONS
% - percentage A-V - atrioventricular BP - blood pressure bpm - beats per minute
DAP - diastolic arterial pressure DCM - dilated cardiomyopathy DNA - deoxyribonucleic acid ECG - electrocardiogram HR - heart rate
HRV - heart rate variability Kg - kilogram
Ln - logarithm
MAP - mean arterial pressure Max - maximum
MEA - mean electrical axis Min - minimum mm - millimetres mmHg - millimeter of mercury mV - millivolts ºC - degrees Celsius r - correlation coefficient rpm - respiration per minute RR - respiratory rate
R-R interval - interval between R waves
RRmax/RRmin - ratio between the maximum and minimum of R-R interval s - seconds
SA - sinus arrhythmia
SAP - systolic arterial pressure SD - standard deviation
VAR - variance
ABSTRACT
OBJECTIVE: The main goal of this study was to determine the electrocardiographic characteristics of healthy Castro Laboreiro Dog and compare them with the reference values to the general dog population. We also studied the influence of gender and age on the ECG parameters and evaluated the cardiac rhythm. Additionally, the heart rate variability was assessed and the sinus arrhythmia level, by calculating the vasovagal tonus index and the ratio between the maximum and the minimum value of R-R interval, and studied their relationship with the heart and respiratory rate.
MATERIALS AND METHODS: The study included 20 Castro Laboreiro Dogs (7 males, 13 females), between 14-110 months old (mean 54 months) and weighing 32-60 kg (mean 43 kg). All dogs underwent a physical and cardiac examination (auscultation, electrocardiography and blood pressure recordings).
RESULTS: The mean values of the ECG parameters observed in Castro Laboreiro Dog were within the range of the reference values reported for the general dog population. No significant differences (P>0.05) were observed between genders, however, some ECG parameters were affected by age. The dogs > 60 months old had a significant (P<0.05) increase in the QT interval and ST segment and a significant decrease in Q and R waves amplitude and MEA, when compared to younger dogs. The majority of the dogs (70%) had sinus arrhythmia. The mean vasovagal tonus index and the RRmax/RRmin were 8.76±1.19 and 1.80±0.60, respectively. A tendency to a negative linear correlation was found between the RRmax/RRmin and the heart rate, and when the VVTI was compared to the heart and respiratory rates.
CONCLUSION: The clinical significance of this study lies in the fact that it could be used as a helpful and valuable tool in the diagnostic of cardiovascular diseases, to which Castro Laboreiro Dog are possibly predisposed, similarly to other large breeds.
RESUMO
OBJETIVO: O principal objetivo deste trabalho foi determinar as características eletrocardiográficas do Cão de Castro Laboreiro e compará-las com os valores de referência para a população canina geral. Estudamos também como o género e a idade influenciavam os parâmetros do ECG e avaliamos o ritmo cardíaco. Adicionalmente, foi determinada a variabilidade da frequência cardíaca e o grau de arritmia sinusal, mediante o cálculo do índex do tónus vasovagal e do rácio entre o valor máximo e mínimo do intervalo R-R, e de que forma a frequência cardíaca e a frequência respiratória influenciavam estes parâmetros.
MATERIAIS E MÉTODOS: O estudo incluiu 20 cães da raça Cão de Castro Laboreiro (7 machos e 13 fêmeas), entre 14-110 meses de idade (média 54 meses) com peso entre 32-60 Kg (média 43 Kg). Todos os cães foram sujeitos a um exame físico e cardíaco (auscultação, medição das pressões arteriais e realização de um ECG).
RESULTADOS: A média dos valores dos parâmetros do ECG observados no Cão de Castro Laboreiro estavam dentro do intervalo de referência publicado para a população canina geral. Não foram observadas alterações significativas (P>0,05) em relação ao género, contudo, alguns parâmetros do ECG foram afetados pela idade. Os animais com idade superior a 60 meses apresentaram um aumento significativo do intervalo QT e do segmento ST e uma diminuição significativa da amplitude das ondas Q e R e do eixo elétrico, quando comparados com os cães mais jovens. A maioria dos cães (70%) apresentou uma arritmia sinusal. A média do índex do tónus vasovagal e do RRmax/RRmin foi 8,76±1,19 e 1,80±0,60, respetivamente. Observou-se uma tendência para a ocorrência de uma correlação linear negativa entre o RRmax/RRmin e a frequência cardíaca, e quando o VVTI foi comparado com a frequência cardíaca e respiratória.
CONCLUSÃO: O valor clínico deste estudo baseia-se no facto de o mesmo poder ser usado como uma ferramenta útil e valiosa no diagnóstico de doenças cardiovasculares, às quais possivelmente o Cão de Castro Laboreiro está predisposto, à semelhança do que ocorre em outras raças grandes.
TABLE OF CONTENTS
I. INTRODUCTION
... 1
II. ELECTROCARDIOGRAPHY- LITERATURE REVIEW
... 2
1.
The cardiac conduction system and genesis of the ECG
... 2
2.
Cardiac rhythm and heart rate variability
... 4
3.
Recording the ECG
... 6
III. AIMS OF RESEARCH
... 7
IV. MATERIALS AND METHODS
... 9
1.
Animals
... 9
2.
Arterial
Blood
Pressure
Measurement
... 9
3.
Electrocardiographic
Examination
... 10
4.
Data Analysis
... 10
V. RESULTS AND DISCUSSION
... 12
1.
Physical examination
... 12
2.
Blood pressure measurements – comparison with reported reference values
.. 12
3.
ECG measurements - comparison with reported references values
... 13
4.
ECG measurements - influence of gender
... 16
5.
ECG measurements - influence of age
... 18
6.
Evaluation of cardiac rhythm
... 21
7.
Heart rate variability and level of sinus arrhythmia
... 22
VI. CONCLUSIONS
... 27
VII. REFERENCES
... 28
VIII. ATTACHMENT
... 31
LIST OF FIGURES
Figure 1 Illustration of P- QRS –T complex 4
Figure 2 Duration of ECG parameters in female and male Castro Laboreiro Dog
17
Figure 3 Amplitude of ECG parameters in female and male Castro Laboreiro Dog
18
Figure 4 Duration of ECG parameters in the two age groups of Castro Laboreiro Dog
19
Figure 4 Amplitude of ECG parameters in the two age groups of Castro Laboreiro Dog
20
Figure 6A Percentage of sinus respiratory arrhythmia observed with auscultation and with ECG
22
Figure 6B Example of a trace with sinus respiratory arrhythmia 22 Figure 6C Example of a trace with regular sinus rhythm 22 Figure 7A Linear correlation between VVTI and the HR 24 Figure 7B Linear correlation between VVTI and the RR 24 Figure 8 Linear correlation between HR and the ratio between the maximum
and minimum values of R-R interval
25
Table 1 Values of arterial blood pressure in 20 Castro Laboreiro Dogs 12 Table 2 Electrocardiographic values in lead II-comparison with reference
data
14
Table 3 Percentages of wave’s deflections in 20 Castro Laboreiro Dogs 15 Table 4 VVTI, RRmax/RRmin, heart rate and respiratory rate values, for each
Castro Laboreiro Dog
I. INTRODUCTION
My professional training period of the Master Degree in Veterinary Medicine was performed at Hospital Veterinário do Porto, and at the same time I carried out a study in order to establish electrocardiographic characteristics in the Castro Laboreiro Dog.
The electrocardiography is the most precise method to diagnose arrhythmias, but has limited value in the diagnosis of this cardiac disease. However, it also has an important role in evaluating the evolution of arrhythmias (Dukes-McEwan et al., 2003; Tilley, 1995). The electrocardiographic technique is also being used to identify dogs with risk of developing ventricular arrhythmias or dilated cardiomyopathy (DCM), by assessing the heart rate variability (Dukes-McEwan et al., 2003).
The Castro Laboreiro dog is a large breed originated from the northwest of Portugal. This autochthonous Portuguese breed is increasing and also spreading all over Europe (CPC, 2012). Large breeds of dogs are the most predisposed to develop cardiac diseases, such as, DCM (Dukes-McEwan et al., 2003). This disease is frequently associated with electrocardiographic abnormalities, including an increase in the duration or amplitude of the P wave or QRS complex, which might indicate chamber enlargement or conduction abnormalities, and the most common arrhythmia diagnosed in large breed dogs with DCM is atrial fibrillation (Dukes-McEwan et al., 2003). So, the aim of the present study was to contribute to the establishment of electrocardiographic parameters in Castro Laboreiro Dog, allowing an earlier and easier identification of ECG parameters abnormalities in this breed.
At the Hospital Veterinário do Porto my internship main goal was to enrich my theoretical knowledge and deepen my practical skills in several areas related to small animal practice, by witnessing the daily routine of the hospital. I had the opportunity to follow several clinical cases in different medical areas, from admission, through additional diagnostic tests, until the initiation of treatment and the responses to it. Furthermore, it was also my intention to increase my knowledge in canine electrocardiography. This internship allowed me to develop the ability of working integrated in a team and to learn to communicate with the animal owners. Also, I have learned how to react and solve different clinical situations that commonly happen in a clinic, by developing my reasoning abilities and skills.
II. ELECTROCARDIOGRAPHY- LITERATURE REVIEW
The electrocardiograph, invented in the late 1800s, works as a galvanometer (voltmeter), recording the electrical fields in the body, generated by the heart. This information is given as a graphic trace that represents the cardiac electrical activity – electrocardiogram (ECG) (Martin, 2008). In 1856, Kolliker and Muller demonstrated, for the first time, that the heart generates electric currents; however, it was only in the late 1880s that Water and Einthoven recorded the electrical impulses of the heart and first used the term ECG. The electrocardiography was first used on dogs from a clinical point of view in 1922, but was just in the 1950s that veterinarians expanded clinical and research application for ECG (Fox et al., 1999; Tilley, 1995).
In Veterinary Medicine, the ECG is commonly performed on dogs in clinical practice and is a valuable tool in the identification and characterization of cardiac arrhythmias and conduction disturbances, and also provides information regarding cardiac chamber enlargement (Coleman & Robson, 2005; Tilley et al., 2008). It can also be used as an indicator of myocardial and pericardial disease, ischemia, certain electrolyte imbalances, particularly hyperkalemia, and drug toxicity (Nelson & Couto, 2008).
An ECG is an essential diagnostic tool in evaluating heart disease and is required to individualize therapy. However, the ECG has limitations and is only a test that must be interpreted in conjunction with the entire data base (e.g. history, physical examination, radiographs, clinical pathology profile and echocardiogram). The ECG does not give information about the mechanical status of the heart, since an animal with congestive heart failure may have a normal ECG while a perfectly normal animal might show nonspecific ECG abnormalities (Tilley, 1995).
1. The cardiac conduction system and genesis of the ECG
The cardiac conduction system is responsible for organizing the sequence of depolarization of the heart (Edwards, 1998). The conduction system consists of the sinoatrial node, the inter atrial bundles, the atrioventricular node (A-V node), the common bundle of His, the right and left branches of the bundle of His, and the Purkinje fibers (Fox et al., 1999).
The sinoatrial node is the cardiac pacemaker because it has the most rapid rate of automatic or spontaneous discharge. Once the A-V node has initiated depolarization the electrical impulse spreads across the atria to the atrioventricular node, producing the first component of the ECG, the P wave. It represents the sum of all the electrical forces produced during the depolarization of both atria, and it produces a small upright deflection on the ECG in leads I, II, III, and aVF and a negative deflection in leads aVR and aVL (Edwards, 1998; Tilley, 1995).
As the atrial impulse enters the A-V node, conduction velocity is slowed, preventing the impulse from entering the ventricles too soon. This allows the atria time to discharge their complement of blood into the ventricles before ventricular contraction occurs. The delay at the atrioventricular node is recorded electrocardiographically as a straight line (isoelectric period) following the P wave, and is called the P-R segment. The total amount of time required for both atrial depolarization and the delay in the A-V node is measured as the P-R interval. This interval is measured from the beginning of the P wave to the beginning of the QRS complex (Tilley, 1995).
The bundle of His leaves the A-V node and courses into the ventricular septum, where it divides into right and left bundle branches. Although many electrical forces are produced during ventricular depolarization, three major waves of electrical activity are usually recorded on the ECG, the QRS complex. The Q wave is the first negative (downward) deflection on lead II of the ECG. It represents the first phase of ventricular depolarization, the septal activation. Then the electrical impulse travels through the ventricular myocardium, producing a positive deflection on lead II of the ECG, the R wave. This is normally the greatest force produced, and indicates ventricular free wall myocardial activation. The third phase of ventricular depolarization produces the S wave, which is the first negative (downward) deflection that occurs following the R wave on lead II of the ECG. This deflection occurs as the muscle fibers at the base of the heart are activated in an apicobasilar direction (Martin, 2008). The direction of the main force (the R wave) varies only slightly, but the Q and S waves are usually quite small deflections that do not appear consistently on lead II in every normal ECG (Edwards, 1998). Following depolarization, the ventricles repolarize and produce the T wave on the ECG (Kittleson & Kienle, 1998; Martin, 2008). The T wave is highly variable in size and polarity (Fuentes et al., 2010).
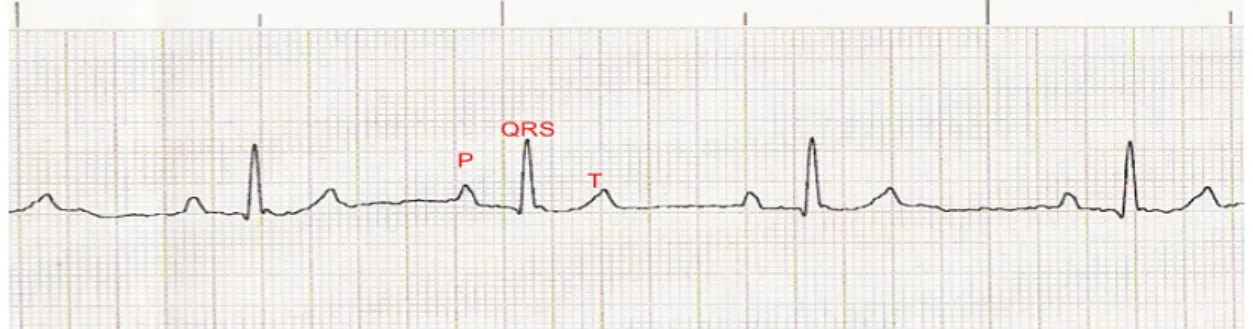
The ST segment represents the slope between the end of the QRS complex and beginning of the T wave. The ST segment can be elevated or depressed from the baseline. This occurs whenever regional myocardial hypoxia is present (Kittleson & Kienle, 1998). The QT interval is the distance between the beginning of the Q wave and the end of the T wave. It represents total electrical systole and is markedly affected by heart rate. In Veterinary Medicine, the QT interval alone is not helpful in the diagnosis, but a useful rule is that the QT interval should be less than half of the preceding RR interval (Fox et al., 1999; Tilley, 1995). Figure 1 shows an example of an ECG from a normal dog, with the representation of P wave, QRS complex and T wave.
Figure 1: ECG tracing illustrating the P wave, QRS complex and T wave recorded from a normal Castro Laboreiro Dog with standard bipolar II lead. The paper speed is 50 mm/s and the calibration is 10 mm = 1 mV.
The mean electrical axis (MEA) considers the average direction of the depolarisation waves during the cardiac cycle. This can be estimated in the frontal plane by using the six limb leads and the different angles at which they record the heart’s electrical activity (Tilley, 1995). The significance of MEA is to establish criteria for ventricular enlargement and conduction defects. In a normal canine heart, the axis is between +40o and +100o, if it becomes less than +40o or greater than +100o is called left axis or right axis deviation, respectively (Tilley, 1995).
The sinus rhythm is featured by an electrical stimulus that is generated at constant rate from the sinoatrial node and spreads through the atria and the ventricles. This is represented by a normal P wave followed by a normal QRS complex and T wave, with a regular rhythm and a rate within the normal range for age and breed. On the other hand, when the rhythm is irregular, despite being generated in the sinoatrial node, it is called sinus arrhythmia (SA). This rhythm irregularity could be related to the variations in the autonomic tonus, which is often synchronous with respiration, since it increases on inspiration and decreases on expiration – respiratory sinus arrhythmia (Martin, 2008).
2. Cardiac rhythm and heart rate variability
Healthy hearts beats are not absolutely regular, as a result of the fluctuating autonomic influences on the sinoatrial node. The variations of heart rate, and consequently the intervals between normal sinus beats represented by the R-R wave intervals on the surface ECG, result from several factors, such as blood pressure regulation, respiration cycle, thermoregulation, the action of the renin-angiotensin system, circadian rhythms, exercise and stress (Stein et al., 1994).
Over the last decades, the analyse of the heart rate variability (HRV), an indirect technique for assessing autonomic input to the sinoatrial node, has been used to measure autonomic nervous system activity (Piccirillo et al., 2009). The sympathetic and parasympathetic systems influence the heart rate by increasing or decreasing it, respectively. An increase in sympathetic system or a decrease in parasympathetic system leads to a
decrease in the HRV. On the contrary, an increase in parasympathetic system or a decrease in sympathetic tone reflects an increase on the HRV values (Stein et al., 1994). Previous studies documented that myocardial failure in humans occurs when sympathetic and parasympathetic tone increase and decrease, respectively, which are associated with the depression of baroreceptor function (Panina et al., 1995). It was also confirmed that HRV and norepinephrine concentration are reduced in patients with myocardial failure (Hasking et al., 1986). HRV has become an important indicator of the cardiac-autonomic nervous system and also a prognostic indicator of myocardial failure, in human medicine (Pieper & Hammill, 1995).
The HRV that occurs on a beat-to-beat basis or every few seconds is mentioned as short-term or high frequency variability, and is strongly influenced by the respiration and vagal tone. Contrarily, long-term or low frequency occurs on a longer than seconds-to-seconds basis and is affected by many factors, such as the sympathetic and the parasympathetic tone (Calvert & Jacobs, 2000).
The HRV could be measured by time- and frequency-domain analysis. The frequency domain analysis is mathematically more complex and requires a Holter system with an accurate timing track, contrary to time domain that is relatively easy to calculate (Stein et al., 1994). The HRV can be determined thought the vasovagal tonus index (VVTI), a time domain indicator that provides information about high-frequency variation in the heart rate. The VVTI is calculated as the natural logarithm of the variance of the R-R interval measured over 20 consecutive heart cycles on an ECG (Doxey & Boswood, 2004; Haggstrom et al., 1996). This is a reliable indicator of HRV in dogs, even though it does not consider all the factors that influence the HRV, such as, blood pressure regulation, thermoregulation, the action of the renin-angiotensin system and circadian rhythms, but the major vagal influence, the respiratory sinus arrhythmia, is taken into consideration (Doxey & Boswood, 2004; Haggstrom et al., 1996).
In the last years, the HRV was associated with several diseases and it is clinically most useful as a risk predictor after acute myocardial failure and as an early warning sign of diabetic autonomic neuropathy (Doxey & Boswood, 2004). HRV has been investigated in dogs with heart disease, such as Dobermans with dilated cardiomyopathy (Calvert & Jacobs, 2000; Calvert & Wall, 2001), Cavaliers King Charles Spaniels with mitral regurgitation (Haggstrom et
al., 1996), Boxers with arrhythmogenic right ventricular cardiomyopathy (Spier & Meurs, 2004),
and various dog breeds with dilated cardiomyopathy (Martinez Pereira et al., 2008). Moreover, there are also studies of HRV in clinically healthy dogs, including Beagles (Matsunaga et al., 2001) and Dachshunds (Olsen et al., 1999). The VVTI has a limitation, as it can only be calculated in animals with a sinus rhythm (Doxey & Boswood, 2004).
The ratio of the maximum and minimum values of RR interval (-max/RRmin) can be useful to assess the level of sinus arrhythmia. Specifically, the level of the respiratory sinus arrhythmia
(SA) can be quantified by calculating the ratio of maximum to minimum R-R interval (RRmax/RRmin) measured over a 10 s period (Hanton & Rabemampianina, 2006).
3. Recording the ECG
The standard position for recording an ECG is placing the patient in right lateral recumbence, with the forelegs and rear legs held perpendicular to the long axis of its body and parallel to each other. If tachypnea or dyspnoea is present, ECG should be recorded with the animal standing or in the sternal position, in order to reduce stress (Fox et al., 1999). It should be noted that in dogs, many ECG reference range values for right lateral recumbence are not valid for ECGs obtained in the sitting position or sternal recumbence (Coleman & Robson, 2005).
Electrocardiographic electrodes (leads) sample cardiac potentials at the body surface. These are measured by the electrocardiograph and recorded on standardized graph paper. The electrocardiograph can combine the electrodes on the body (right and left arms, left leg, and exploring electrode). They include bipolar standard limb leads I, II, and III, unipolar limb leads aVR, aVL, and aVF, and unipolar precordial (thoracic) leads CV6LL (V2), CV6LU (V4), CV5RL (rV2), and V10.
III. AIMS OF RESEARCH
Information on the normal ECG of the dog is sometimes inaccurate because of the general use of mixed breeds and the fact that age and gender of the animals are not taken into account. Several factors, such as the size, chest conformation, weight, gender, age and the dog’s ability can influence the cardiac size and function, and consequently the ECG parameters (Bernal et al., 1995; Della Torre et al., 2000; Fuentes et al., 2010). For example, one factor that greatly influences the amplitudes of ECG values is chest depth. Dogs with deep chests have waves with higher amplitude than dogs with a wide chest or fat dogs (Tilley, 1985).
Significant differences have been established in ECGs of different dog breeds (Kovacevic et al., 1999). In fact, over the last years, several studies have been conducted in order to determine ECG reference values for specific breeds such as the Whippet (Bavegems et
al., 2009), Beagle (Hanton & Rabemampianina, 2006), Doberman Pincher (Kovacevic et al.,
1999), Spanish Mastin (Bernal et al., 1995), Kangal Dog (Atmaca & Emre, 2010), German Shepherd (Rezakhani et al., 1990; Upeniece, 2004), Golden Retriever (Pellegrino et al., 2010), Cocker Spaniel (Upeniece, 2004), and Rottweiler (Upeniece, 2004).
The Castro Laboreiro Dog is an autochthonous Portuguese breed and owes their name to the Castro Laboreiro village, in the Melgaço municipality, in the Northwest of Portugal. This Portuguese breed is a mastiff type lupoide and is one of the most ancient dogs breeds in the Iberian Peninsula (van Asch et al., 2005). During these last years the number of dogs of this Portuguese guarding breed has been increasing, with 231 dogs registered in Portugal, as reported by the Portuguese Dog Breeding Club in 2012 (CPC, 2012). Although there are no reports in literature concerning the occurrence of cardiovascular diseases in the Castro Laboreiro Dog, as a large breed, it could be predisposed to cardiac diseases, such as dilated cardiomyopathy.
There are no reference values for ECG parameters in the Castro Laboreiro Dog. In this context, the main goal of this study was to evaluate the ECG characteristics in this Portuguese breed, which might be useful for the researcher and the veterinary clinician. Moreover, the other objectives were to compare the obtained ECG values with the published reference values for a general dog population and to study the influence of gender and age on the ECG parameters. Additionally, we evaluated the cardiac rhythm, by analysing the EGC recordings and also by cardiac auscultation in the physical examination. It was also our purpose to measure the arterial blood pressure in the Castro Laboreiro Dog and then compare it with the reference values published for a general dog population. As previously referred to in the introduction, over the last years, HRV has been used to identify dogs at risk to develop acute heart failure
(Dukes-McEwan et al., 2003). So, it was also our intention in this study to determine the HRV and the level of sinus arrhythmia, by calculating the vasovagal tonus index and the ratio between the maximum and the minimum values of the R-R interval in Castro Laboreiro Dog, and comparing it with other breeds.
IV.
MATERIALS AND METHODS
1. Animals
Privately owned Castro Laboreiro Dogs were recruited voluntarily through contacts with breeders and owners. All dogs underwent a complete physical examination, with particular attention to the cardiovascular system, as well as arterial blood pressure measurement and ECG recordings. Examinations were done at their homes and kennels, while the owner stood by the dog’s head and kept the animal calm, so no restraining drugs were used during the study. The investigation included 20 apparently healthy dogs (13 females and 7 males), with ages between 14 and 110 months and weighting 32-60 Kg. The study was approved by the ethics committee of ICBAS/UP.
A general anamnesis was obtained by an interview with the owner, with the intention to know more information about the dog’s habitat, nutrition, general information (deworming/vaccination) and past medical history. We assessed that all the dogs included in this study were vaccinated/dewormed, living outdoor and mostly fed Royal Canin®.
The general physical examination included the assessment of the attitude, body temperature, the mucous membranes, the hydration state, the peripheral lymph nodes and abdominal palpation (Rijinberk & van Sluijs, 2009). Special attention was given to femoral pulses, and cardiopulmonary auscultation. The last one allowed the assessment of heart rate and rhythm, intensity of heart sounds and the presence of additional or abnormal sounds such as murmurs and clicks (Fuentes et al., 2010).
2. Arterial Blood Pressure Measurement
Systolic, diastolic and mean arterial pressures were measured using a high definition oscillometric method (MemoDiagnostic, S+B MedVET GmbH, Germany).
Cuffs were selected to achieve a ratio between cuff width and limb circumference of approximately 40 to 60 %, on the left hind limb (Brown et al., 2007). Blood pressure measurements were taken on the left hind limb at the level of the metatarsus, with the dogs in right lateral recumbence (Bodey & Michell, 1996). After the cuff was applied, the dog was allowed five minutes to calm down. Arterial blood pressure was measured after a constant heart rate was determined. Blood pressures were measured five times at one minute intervals, with the dog accompanied by its owner. The mean of the five readings were calculated, of which the first and outliers were discarded (Bodey & Michell, 1996). Blood pressure readings of the trembling or excited dogs were rejected, and the measurements were repeated when the animals became comfortable again.
3. Electrocardiographic Examination
The unsedated dogs were positioned and manually restrained in right lateral recumbence, with the forelimbs and hind limbs held perpendicular to the long axis of the body and parallel to each other (Figure 2) (Tilley et al., 2008). All ECGs were recorded by using a Cygnus Cardio III Vet electrocardiograph. The ECG leads were attached to the skin by alligator clips at the palmar aspect of the left and right foreleg over to the olecranon, and at the cranial aspect of the left and right hind limb over the patellar ligament. The red, yellow, green and black alligator clips were placed on right forelimb, left forelimb, left hind limb and at right hind limb, respectively. All electrodes were wet with 70% isopropyl alcohol to ensure electrical contact (Fuentes et al., 2010; Tilley et al., 2008).
The animals were allowed some time to acclimatize sothat the ECG could be taken from dogs that were relaxed. When stable, leads I, II, III, aVR, aVL, aVF were printed at 50 mm/s and 10 mm/mV. The cardiac rhythm was observed for about 5 min to detect arrhythmias.
Five representative consecutive beats in lead II were used to measure various ECG variables manually. Variables measured in lead II recordings were heart rate (HR) in beats per minute (bpm), rhythm (regular rhythm, respiratory sinus arrhythmia, pathological arrhythmias), P-wave amplitude and duration, PR interval, Q-wave amplitude, R-wave amplitude, S-wave amplitude, QRS-complex duration, ST-segment deflection, T-wave amplitude and QT interval, with amplitudes in mV and durations in seconds. The heart rate was calculated by counting the number of complex in 6 seconds and multiplied by 20 (Tilley, 1995).
The MEA was determined by calculating the algebraic sum of the QRS deflection in lead I and III, and using the tables from Tilley (Tilley, 1995).
ECGs from each case were used to calculate the VVTI. Only tracings, which were of good quality and had a continuous run of sinus rhythm for at least 20 R-R intervals were used. Only one value of VVTI per patient was calculated. To calculate VVTI, 21 consecutives normal P-QRS-T complex were selected in lead II and the R-R intervals were measured in milliseconds (Z1 to Z20). It was calculated from the formula (LN: natural logarithm, VAR: variance): VVTI = LN [VAR(Z1-Z20)] was used (Martinez Pereira et al., 2008).
The ratio of the maximum to minimum values of the R-R interval (RRmax/RRmin) was calculated as a measure of the level of sinus arrhythmia.
4. Data Analysis
All the analysis was performed using Excel, and the results were reported as the mean ± standard deviation (SD), and maximum and minimum values. To compare the ECG parameters of Castro Laboreiro Dog with the reference values given by Tilley (Tilley, 1995) we determined
the percentage of animals that fell out of the reference range values. The different ECG parameters were compared considering the dogs’ gender (female and male) and age (< 60 and > 60 months) using the T-test, once the normal distribution was confirmed. The Mann-Whitney Rank sum test was used for the parameters, which the normality was rejected according to Shapiro-Wilk test. The relationship between RRmax/RRmin, HR, respiratory rate (RR) and VVTI was evaluated by the linear correlation (Pearson test) and the regression. The level of significance was defined as P < 0.05.
V. RESULTS AND DISCUSSION
1. Physical examination
All the animals were considered apparently healthy as no abnormalities were found in the physical examination. The mean body temperature was 38.65º C, while the mean respiratory and heart rates were 29.68 respirations per minute (rpm) and 115.15 beats per minute (bpm), respectively.
2. Blood pressure measurements – comparison with reported reference values
Systemic arterial blood pressure is a fundamental cardiovascular parameter clinically used to assess haemodynamic status (Ward et al., 2012). Normal blood pressure values differ significantly among various breeds of dog and within breed groups (Bodey & Michell, 1996; Bodey & Rampling, 1999).
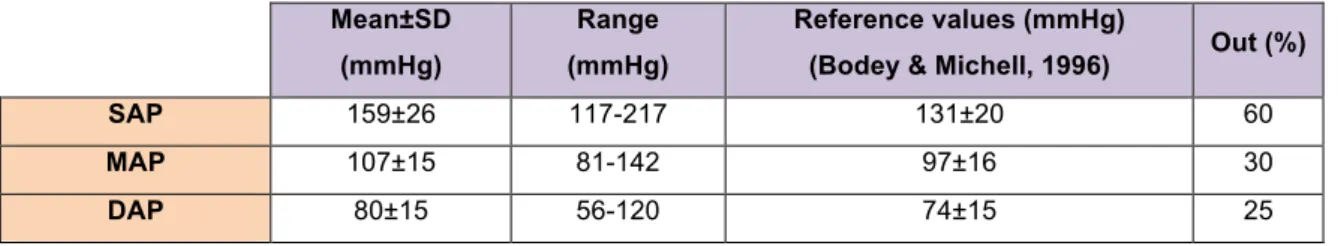
Blood pressure values were obtained in Castro Laboreiro Dog for the systolic arterial pressure (SAP), the mean arterial pressure (MAP) and the diastolic arterial pressure (DAP). The mean SAP for the group was 159±26 mmHg (range from 117 to 217 mmHg), the MAP had values between 81 and 142 mmHg (mean of 107±15 mmHg), and the mean DAP was 80±15 mmHg (range from 56 to 120 mmHg) (Table 1).
Mean±SD (mmHg)
Range (mmHg)
Reference values (mmHg)
(Bodey & Michell, 1996) Out (%)
SAP 159±26 117-217 131±20 60
MAP 107±15 81-142 97±16 30
DAP 80±15 56-120 74±15 25
Table 1: Values (mean±SD and range) for SAP, MAP and DAP from a total of 20 Castro Laboreiro Dogs.
The mean blood pressure values in Castro Laboreiro Dog, measured by high definition oscillometric method, were higher than those previously reported (Bodey & Michell, 1996). SAP values were above the reference value (159±26 versus 131±20 mmHg) in 60% of the dogs, 30% of them had the MAP values higher than the reference ones (107±15 versus 97±16 mmHg) and 25% of the dogs had the DAP values above the reference for the general dog population 80±15 versus 74±15 mmHg).
In the present study, although the blood pressure was measured in a home setting, we could not rule out the presence of some degree of stress responsible for these higher values of
blood pressure in Castro Laboreiro Dogs. In fact, the restraint of the animals and the simple attachment of the equipment could induce stress and limit the accuracy of the blood pressure measurements.
Previous studies reported that blood pressure values measured using non-invasive methods in client-owned dogs at home differed significantly from values determined in a clinical setting (Vincent et al., 1993). However, some authors believe that such difference do not exist because dogs are under stress in both situations (Remillard et al., 1991). The presence of a strange person can lead to a fast increase of blood pressure, caused by a change of the sympathetic tone (Vincent et al., 1993). So, considering this, the stress cannot be the only justification for the observed high values of blood pressure.
If we compare the results with the ones for other large breeds, also using an indirect oscillometric method, the blood pressure values in Castro Laboreiro Dogs were similar or higher than those reported earlier (Bright & Dentino, 2002; Remillard et al., 1991; Sanan & Arslan, 2007). In a recent study, another Portuguese dog breed, the Estrela Mountain Dog, also presented similar high values of blood pressure (mean SAP of 148.84±18.69 mmHg; mean MAP of 106.87±13.39 mmHg, and mean DAP of 82.10±13.73 mmHg) (Lobo et al., 2008). However, it is difficult to make direct comparisons with other breeds because these studies were carried out using different methods and under different conditions. This finding might be a breed characteristic of the Castro Laboreiro Dog, but this needs to be confirmed in future studies.
3. ECG measurements - comparison with reported references values
The ECGs were analysed and the wave’s durations and amplitudes were determined according to what is described in materials and methods section.
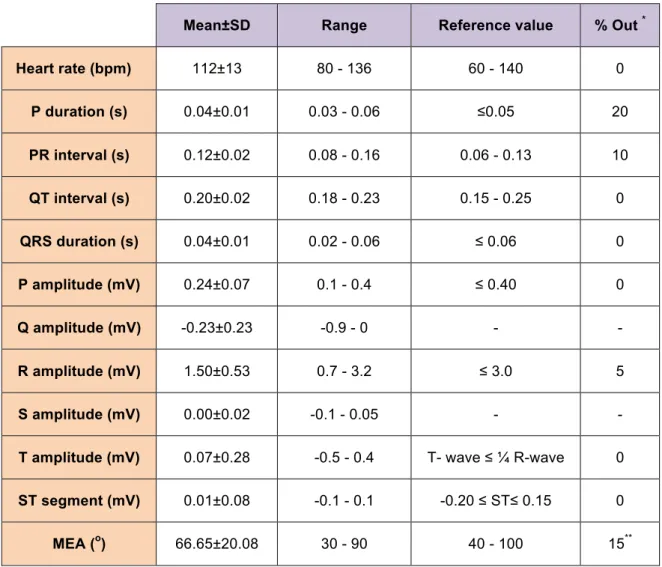
The mean heart rate in Castro Laboreiro Dog was 112±13 bpm, ranging from 80 to 136 bpm, which were within the reference values for large breeds (60-140 bpm) (Tilley, 1995) (Table 2). The others ECG parameters obtained in the Castro Laboreiro Dog are also represented in Table 2, and include the P wave duration and amplitude; PR interval, QT interval and QRS duration; Q, R, S and T waves and ST segment amplitudes; and MEA. No atrial or ventricular premature beats or ventricular conduction disturbances, were observed in any of the dogs in the study.
Mean±SD Range Reference value % Out * Heart rate (bpm) 112±13 80 - 136 60 - 140 0 P duration (s) 0.04±0.01 0.03 - 0.06 ≤0.05 20 PR interval (s) 0.12±0.02 0.08 - 0.16 0.06 - 0.13 10 QT interval (s) 0.20±0.02 0.18 - 0.23 0.15 - 0.25 0 QRS duration (s) 0.04±0.01 0.02 - 0.06 ≤ 0.06 0 P amplitude (mV) 0.24±0.07 0.1 - 0.4 ≤ 0.40 0 Q amplitude (mV) -0.23±0.23 -0.9 - 0 - - R amplitude (mV) 1.50±0.53 0.7 - 3.2 ≤ 3.0 5 S amplitude (mV) 0.00±0.02 -0.1 - 0.05 - -
T amplitude (mV) 0.07±0.28 -0.5 - 0.4 T- wave ≤ ¼ R-wave 0 ST segment (mV) 0.01±0.08 -0.1 - 0.1 -0.20 ≤ ST≤ 0.15 0 MEA (o) 66.65±20.08 30 - 90 40 - 100 15**
Table 2: Electrocardiographic values (mean±SD and range) in lead II obtained from the 20 studied Castro Laboreiro Dogs, and its comparison with reference data reported by (Tilley, 1995).*The percentage of values outside maximum reference value.** Left electrical axis deviation. Values are expressed in seconds (s) and millivolts (mV).
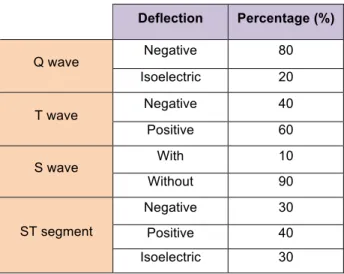
The mean P wave duration and amplitude was 0.04±0.01 s and 0.24±0.07 mV. The mean Q wave amplitude was -0.23±0.23 mV, from which 80% had negative amplitude and 20% were isoelectric (Tables 2 and 3). The mean R wave amplitude was 1.50±0.53 mV, while the S wave was only present in two dogs (0.05 mV and -0.10 mV). The T wave had a mean of 0.07±0.28 mV where 40% and 60% were negatively and positively deflected (Table 3), respectively. The mean ST segment amplitude was negative in 30%, positive in 40% and isoelectric in 30% of the studied animals, with a mean of 0.01±0.08 mV (Tables 2 and 3). The means of the PR interval, QT interval and QRS wave were 0.12±0.02 s, 0.20±0.02 s and 0.04±0.01 s, respectively (Table 2). Finally, Table 2 also shows that the mean of the MEA was
The mean values of the ECG parameters observed in Castro Laboreiro Dog were within the range of the reference values previously reported by Tilley (Tilley, 1995). However, we observed that in a small percentage of dogs the values were above the maximum reference value. This could be due to the low number of evaluated dogs, which could be misrepresentative.
To facilitate the comparison between the obtained data and the reference values reported by Tilley (Tilley, 1995), we determined the percentage of Castro Laboreiro dogs with values outside the maximum reported value (% Out; Table 2). We observed that the higher outer range was found for the P wave duration, where 20% of the animals had a value above 0.05 s. This could be due a to a left atrial dilatation/hypertrophy (which is most often associated with mitral valvular disease) or to an individual characteristic of the animals, but only echocardiographic an examination would have confirmed this hypothesis (Tilley, 1995).
The MEA depends of the position, size and the conduction system of the heart. A left electrical axis deviation (MEA < 40º) was seen in 3 dogs (15%). One of the dogs (dog nr 4; table in attachment) presented an increase of the P wave amplitude, besides the left electrical axis deviation. The other two animals had all ECG parameters within the reference values, with the exception for the MEA value. This axis deviation might be due to an individual characteristic and is not clinically relevant (Tilley, 1995).
Deflection Percentage (%) Q wave Negative 80 Isoelectric 20 T wave Negative 40 Positive 60 S wave With 10 Without 90 ST segment Negative 30 Positive 40 Isoelectric 30
Table 3: Percentages of wave’s deflections in 20 Castro Laboreiro Dogs.
Outside values were also observed for the PR interval duration (10%) and R wave amplitude (5%) (Table 2). In two dogs (10%), the PR interval duration was above 0.13 s (reference value: 0.06 < PR < 0.13 s). One of these dogs (animal nr 3, table in attachment) might have a first-degree atrioventricular block, with P wave values within the reference range
(Tilley, 1995). The other dog (animal nr 4, table in attachment) also showed an increase of the P wave amplitude and a left electrical axis deviation, as stated above, which could be due to a left cardiac dilatation/hypertrophy with a first-degree atrioventricular block. Yet, in both cases this increase in the PR interval could be attributed to individual characteristic. Additional exams are needed to confirm if this is pathological or a characteristic of the breed.
In one dog (5%), the amplitude of the R wave was slightly higher than the value described in the literature (3.2 mV, versus 30.0 mV). This finding could be attributed to a ventricular dilatation/hypertrophy or this is an individual characteristic, however, further cardiovascular exams would be necessary to confirm this (e.g. echocardiography, radiography) (Tilley, 1995).
The mean duration for the QT interval and the QRS complex were within the reference values previously reported (Tilley, 1995). Both the Q wave and the S wave amplitudes were within the reported reference values (Tilley, 1995), as the ST segment amplitude (-0.20 ≤ ST ≤ 0.15 mV). According to Tilley (1995), the T wave should be ≤ ¼ of the R wave, which was observed in our study.
4. ECG measurements - influence of gender
After having compared all the ECG parameters of the total studied population of Castro Laboreiro Dogs, one of our objectives was to understand if gender could influence the ECG parameters.
The first group was composed out of 13 females with mean age of 56.15±25.62 months (14 to 110 months) and mean weight of 43.08±7.99 Kg (32 to 60 Kg); the male group included 7 dogs with mean age of 50.43±20.66 months (24 to 79 months) and mean weight of 43.71±7.13 Kg (36 to 55 Kg). There was no significant difference in age between groups (P = 0.32), and no significant difference in weight (P = 0.43).
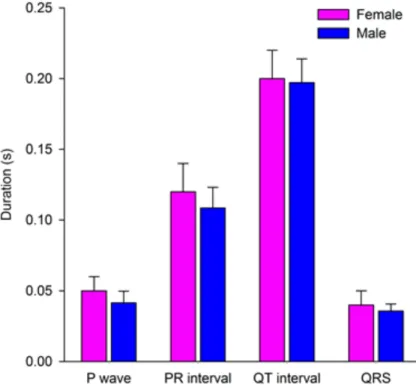
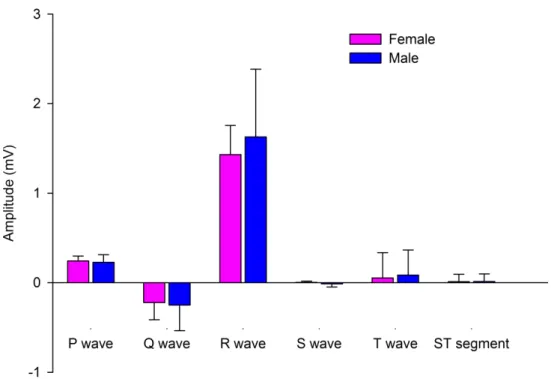
There were no major differences in the ECG parameters between males and females. We observed that P wave duration, PR and QT interval duration, and QRS were quite similar between genders, since no significant differences (P > 0.05) were detected (Figure 2). We also determined the differences between genders regarding the amplitudes of the waves (Figure 3). In a similar manner, there were no significant differences (P > 0.05) between genders.
The heart rate and MEA in females and males Castro Laboreiro Dogs were also assessed (data not shown), and no significant differences (P > 0.05) were observed between the two groups (113±14 bpm for females and 111±10 bpm for males; 65.08±19.62º for females and 69.57±20.58º for males).
Based on our results, it seems that gender has no impact on the ECG parameters of the Castro Laboreiro Dog breed. This is in accordance with others studies previously published in
Beagle (Hanton & Rabemampianina, 2006; Osborne & Leach, 1971), Mastin Espanol (Bernal et al., 1995) and Kangal Dog (Atmaca & Emre, 2010). The exception was the Whippet, where it was observed that the amplitude of the R wave was higher in the males than in the females (Bavegems et al., 2009). However, this difference was no longer significant when considering the weight of the two groups, as males weighed more than females (Bavegems et al., 2009).
Figure 2: Duration of ECG parameters in females and males Castro Laboreiro Dog. The wave’s duration
Figure 3: Amplitude of ECG parameters in females and males Castro Laboreiro Dog. The wave’s
amplitude values are represented as mean±standard deviation.
5. ECG measurements - influence of age
The next objective was to assess if the ECG parameters were affected by the age of the animals. According to the age range of our population of 20 animals, the dogs were divided into two groups in order to maintain the balance of the sample. However, the groups were very heterogeneous, since there was a big range of ages in each group. One group was composed of dogs with an age below 60 months (< 60) and included 10 dogs and the other group with dogs older than 60 months (> 60) with the other half.
The group of dogs with < 60 months had a mean age of 33.90±12.36 months, ranging from 14 to 49 months, and a mean weight of 41.00±7.31 Kg (ranging from 32 to 55 Kg), whereas the group that was > 60 months had a mean age of 74.40±13.93 months between 60 and 110 months and a mean weight of 45.60±7.41 Kg (ranging from 35 to 60 Kg).
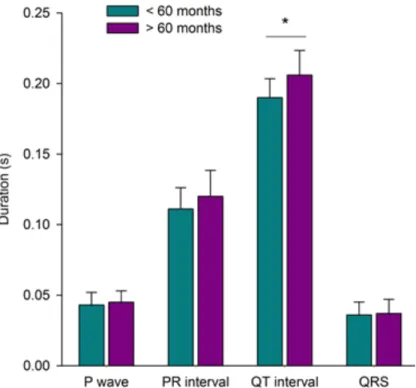
In Figure 4 we present the obtained results from the two age groups regarding the duration of the ECG waves. Similar to what was observed for genders most of the observed parameters (P wave, PR and QT interval and QRS complex) were very similar. Nevertheless, Castro Laboreiro Dogs aged more than 60 months had higher QT interval (P<0.05) than the younger dogs (0.21±0.02 s and 0.19±0.01 s, respectively) (Figure 4).
Figure 4: Duration of ECG parameters in the two age groups of Castro Laboreiro Dog. The wave
duration values are represented as mean±standard deviation. * P<0.05.
These result revealed a parallelism with other reports in: Mastin Espanol (Bernal et al., 1995), Beagles (Osborne & Leach, 1971), Kangal Dogs (Atmaca & Emre, 2010), Cocker Spaniel, Rottweiler and German Shepherds (Upeniece, 2004), where a progressive increase in the duration of the QT interval also occurred with age, which lead to different hypothesis. In Human Medicine, there is clear evidence of the inverse relationship between the QT interval duration and the heart rate (Davidowski & Wolf, 1984),
which also occurred in this study, where in younger animals the heart rate was 117±9 bpm and 107±13 bpm in older dogs. A second explanation, is that the animals’ ageing leads to changes in myocardium affecting the cardiac balance between parasympathetic and sympathetic neuronal system (Upeniece, 2004). Even though this increase was observed in several dog breeds, there is no reference showing the physiological change in QT, like in humans, so this parameter is not particularly helpful in Veterinary Medicine (Tilley, 1995).
Several studies also showed a positive correlation between PR interval and age, such as in Mastin Espanol (Bernal et al., 1995), Mongrel dogs (age<6 months) (Avizeh et al., 2010) and Beagles (Osborne & Leach, 1971). The correlation between the PR interval and age is related to the decrease of heart rate with the age, and the influence of vagal tone (Eckenfels & Trieb, 1979). In this study, even though the mean PR interval duration in both groups was not significantly different (P>0.05), the relationship between the PR interval and the age was still
observed. This might be due to the small number of animals included in the current study or to the fact that the age intervals between the different studies are not overlapping, as some mentioned studies included younger animals (that were almost 3 years old), which is completely different from the age interval in this work (14 to 110 months).
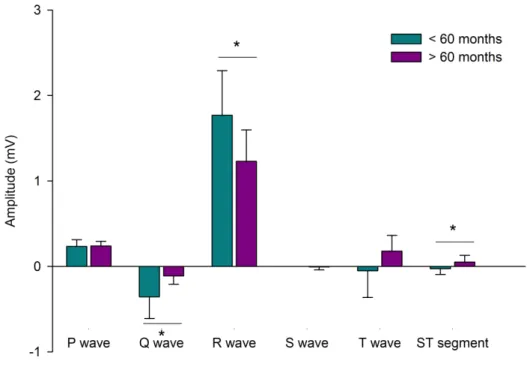
Then, we compared the amplitudes of all ECG parameters considering the age of the Castro Laboreiro Dog. Similarly to what happened before with the duration, significant differences were also observed with amplitudes (Figure 5).
We observed that the Q-wave amplitude was significantly deeper (P<0.05) in the younger group of dogs (mean -0.36±0.26 mV), when compared to older dogs (mean -0.11±0.10 mV). These results are in accordance with what was observed for other breeds, like Kangal Dog (Atmaca & Emre, 2010), Cocker Spaniel, Rottweiler and German Shepherds (Upeniece, 2004). One possible explication for this trend is the fact that the fat rate increases with age, causing a change between the proportion of cardiac and body masses (Upeniece, 2004).
Figure 5: Amplitude of ECG parameters in the two age groups of Castro Laboreiro Dog. The wave duration
values are represented as mean±standard deviation. * P<0.05.
A similar tendency was also observed with the amplitude of R wave. In the dogs younger than 60 months R wave amplitude was significantly higher (P<0.05), as compared to dogs older than 60 months (1.77±0.52 mV versus 1.23±0.37 mV). Besides, the range of the values
amplitude obtained for these waves were quite different in the two groups: in younger dogs Q wave ranged from -0.90 to 0.00 mV (median -0.30 mV) and R wave ranged from 1.30 to 3.20 mV (median 1.55 mV); in older dogs the Q wave ranged from -0.30 to 0.00 mV (median -0.10 mV) and R wave ranged from 0.70 to 2.00 mV (median 1.15 mV). On the contrary, the literature (for Mastino and Beagle dogs) describes that the R wave amplitude increases with age (Bernal
et al., 1995; Osborne & Leach, 1971), notwithstanding, in these studies the age interval was
different. In another study a higher R wave was observed in the group of adults dogs (12 to 96 months; mean = 2.36 mV), comparatively to the puppy group (1 to 12 months; mean = 2.08 mV). However, in the same work, the authors referred lower amplitudes in the group of older dogs (> 96 months), with a mean of 1.67 mV (Upeniece, 2004). The same tendency is observed in Human Medicine, and this phenomenon is mainly explained by general aging.
On the contrary, the ST segment amplitude significantly increased with age (P<0.05; Figure 5), from -0.03±0.07 mV in younger dogs to 0.05±0.08 mV in older ones. These results are in accordance with previous published data in Mastin Espanol (Bernal et al., 1995).
Moreover, we also compared the MEA between the two groups and observed that there was a significant difference (P<0.01), since MEA was 78.6±11.5º for the younger dogs (median = 80.5º) and 54.7±19.7º (median 51.0º) for the older dogs (data not shown). In literature, it was previously demonstrated that the slight fluctuations in the amplitude of the R wave can lead to variations in the direction of the vector (Eckenfels & Trieb, 1979). Therefore, the differences observed in MEA might follow the trend of the R wave amplitude during ageing.
We also determined the heart rate in these two groups, even though no significant differences were observed (P> 0.05), there was a tendency of a decrease in heart rate with ageing, with a mean value of 117±9 bpm in < 60 months dogs, when compared to > 60 months dogs, with a mean of 107±13 bpm (data not shown). Several studies described that the HR is significantly different between age groups, (Atmaca & Emre, 2010; Bernal et al., 1995) because aging leads to changes in the autonomic system, which result in a decrease of HR (Davidowski & Wolf, 1984). That significant difference was not observed in our study, one possible explanation is the smaller number of the dogs used or the age distribution in our sample. However, we observed the same tendency as in the previous studies, where younger animals had higher heart rate, compared to older dogs.
6. Evaluation of cardiac rhythm
The cardiac rhythm was assessed in all 20 Castro Laboreiro Dogs both by analysing the EGC recordings and by cardiac auscultation during physical examination. Accordingly to the ECG analyses we determined that out of the 20 animals, 6 dogs (30%) had regular sinus rhythms while the majority (14 dogs, 70%) had sinus arrhythmia, but both groups had a similar
9
7
Cardiac Auscultation ECG
mean heart rate (113 and 114 bpm, respectively) (data not shown). Moreover, out of the 14 dogs that presented sinus arrhythmia, sinus respiratory arrhythmia was observed in 7 dogs (50%), with a mean heart rate slightly lower (110 bpm) than others, but still within the reference values (data not shown). The respiratory sinus arrhythmia was also a common finding in the ECG of the majority of the German Shepherd (Rezakhani et al., 1990), and it was also observed in 80% of Kangal dogs (Atmaca & Emre, 2010) and in Mastin Napoletano (Ambrosio et al., 2002).
During cardiac auscultation we observed that 9 animals had sinus respiratory arrhythmia, but during ECGs assessment of the heart rhythm this condition was only observed in 7 dogs (Figure 6A). This difference could be explained by the fact that the animals were more stressed during the ECG recordings. Likely, the stress induces the activation of the sympathetic system and the sinus respiratory arrhythmia is attenuated. The physical examination was the last procedure to be carried out, and at this time the animal had adapted to the environment, so the sinus respiratory arrhythmia was detected in more animals, once the vagal tonus was activated.
In Figures 6B and 6C there are two representative ECGs traces recorded in the Castro Laboreiro Dog sample, one example of sinus respiratory arrhythmia and one of regular sinus rhythm.
RFigure 6: Cardiac rhythm in Castro Laboreiro Dogs. (A) Percentage of sinus respiratory arrhythmia observed
with auscultation and with ECG. (B) Sinus respiratory arrhythmia and (C) regular sinus rhythm observed in representative ECG recording, in lead II at 50 mm/s.
7. Heart rate variability and level of sinus arrhythmia
A
B
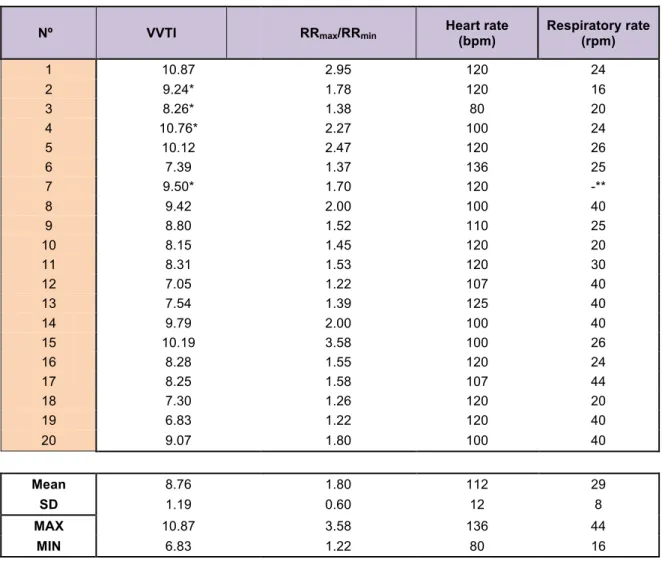
The previously described results on the cardiac rhythm of Castro Laboreiro Dogs were a very interesting finding, which lead us to think that this breed possibly has a pronounced vagal component. In order to understand better the influence of the vagal tone, we measured the level of sinus arrhythmia. In accordance to what was previously described (Doxey & Boswood, 2004; Haggstrom et al., 1996; Hanton & Rabemampianina, 2006; Martinez Pereira et al., 2008), the HRV was measured to assess the level of sinus arrhythmia, by calculating the VVTI and the ratio between the maximum and minimum of R-R interval (as previously explained; Table 4).
Nº VVTI RRmax/RRmin Heart rate (bpm) Respiratory rate (rpm)
1 10.87 2.95 120 24 2 9.24* 1.78 120 16 3 8.26* 1.38 80 20 4 10.76* 2.27 100 24 5 10.12 2.47 120 26 6 7.39 1.37 136 25 7 9.50* 1.70 120 -** 8 9.42 2.00 100 40 9 8.80 1.52 110 25 10 8.15 1.45 120 20 11 8.31 1.53 120 30 12 7.05 1.22 107 40 13 7.54 1.39 125 40 14 9.79 2.00 100 40 15 10.19 3.58 100 26 16 8.28 1.55 120 24 17 8.25 1.58 107 44 18 7.30 1.26 120 20 19 6.83 1.22 120 40 20 9.07 1.80 100 40
Mean
8.76
1.80
112
29 SD 1.19 0.60 12 8 MAX 10.87 3.58 136 44 MIN 6.83 1.22 80 16
Table 4: Values for VVTI, RRmax/RRmin, heart rate and respiratory rate of each studied Castro Laboreiro Dog
represented as mean, standard deviation, maximum and minimum values. *Animals that did not have 21 consecutives complexes. ** Animal with tachypnea.
The mean VVTI was 8.76±1.19 in Castro Laboreiro Dog (Table 4), which was slightly higher than other non-brachycephalic breeds, such like the Labrador retriever (7.83±1.53) and the Cocker Spaniel (8.03±1.46) (Doxey & Boswood, 2004). However, in the study by Doxey and
Boswood, it included both healthy and heart disease dogs. Animals with heart disease had a lower VVTI, which can explain why our mean value was higher than in the other breeds. Interestingly, the VVTI of the Castro Laboreiro Dog was more similar to that observed in brachycephalic breeds (e.g. Boxer, 8.82±1.21; Bulldog, 8.56±1.52). Brachycephalic breeds tend to have higher VVTIs, as described by the same authors. The reason for this is not yet clear but might result of the major inspiratory effort. Kangal dogs, a non-brachycephalic, had also a higher sinus arrhythmia rate (Atmaca & Emre, 2010). When highly stressed, dogs may not have only a decrease in the VVTI but also in the respiratory and heart rate (Haggstrom et al., 1996).
The HRV can be useful as a prognostic indicator in dogs with heart disease, as dogs with higher VVTI values have a worse prognostic (Boswood & Murphy, 2006; Haggstrom et al., 1996; Martinez Pereira et al., 2008; Stein et al., 1994).
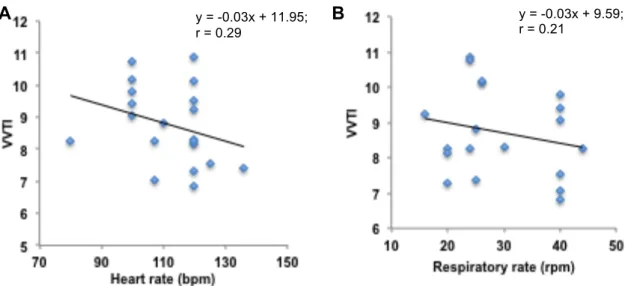
The VVTI was compared to heart and the respiratory rates, which are represented in figures 7A and 7B. A negative correlation between VVTI and heart rate and respiratory rate (r=0.29 and r=0.21, respectively) was found, with the following regression y = -0.03x + 11.95 and y = -0.03x + 9.59, respectively.
Figure 7: Linear correlation between VVTI and the HR (A) and VVTI and RR (B) in 20 Castro Laboreiro Dogs.
The results are in accordance with previously reported data (Doxey & Boswood, 2004; Haggstrom et al., 1996). Even though the correlations, in both cases, were not statistically significant (P>0.05), they showed a negative relationship. The low coefficient between VVTI and heart rate (r = 0.29) can be justified by the fact that the sinus arrhythmia is not only affected by heart rate but also by others factors, such as exercise, stress, blood pressure and thermoregulation (Martinez Pereira et al., 2008; Stein et al., 1994) or once again, it also could
y = -0.03x + 11.95; r = 0.29
B
A
y = -0.03x + 9.59;be due to the lower number of dogs in the sample. There was also a negative correlation between respiratory rate and VVTI, with also a low coefficient of correlation (r = 0.21). The results showed a stronger correlation between the VVTI and the HR, than with the respiratory rate. Similar results were additionally observed for Cavalier King Charles Spaniel, where the HRV was less influenced by the respiratory rate when compared to the HR (Haggstrom et al., 1996).
Next, we studied the relationship between RRmax/RRmin and heart rate. The ratio between the maximum and the minimum value of R-R interval proved to be a good indicator of sinus arrhythmia, because considers the amplitude of R-R fluctuation (Hanton & Rabemampianina, 2006). A linear correlation (r= 0.21; y = -0.01x + 2.95) showed the relationship between the level of sinus arrhythmia and heart rate, in our sample of Castro Laboreiro Dog. The correlation was not statistically significant (P>0.05), but we observed an inverse relationship, which means that when there is a decrease on RRmax/RRmin when heart rate increases (Figure 8).
Figure 8: Linear correlation between HR and the level of SA evaluated as the ratio between the maximum and minimum values of RR interval (RRmax/RRmin) in 20 Castro Laboreiro Dogs.
The same was observed in Beagles (Hanton & Rabemampianina, 2006) and Nigerian Local Dog (Ajibola et al., 2011). The obtained correlation coefficient was low (r = 0.21), which can be explained by the fact that others factors can modify the R-R interval (Hanton &
y = -0.01x + 2,95; r = 0.21
y = -0.01x + 2.95; r = 0.21
Rabemampianina, 2006; Stein et al., 1994), or once again, due to the small number of evaluated dogs.
VI. CONCLUSIONS
The analysis of the ECG of 20 Castro Laboreiro Dogs allowed us to obtain preliminary results in order to establish the electrocardiographic parameters for this breed. The mean values of the ECG parameters observed in Castro Laboreiro Dog were within the range of the reference values previously reported for the general dog population, except for a small percentage of dogs. We have also taken into account factors such as gender and age. No difference was found between the genders; however, their age seems to have a marked effect in some ECG parameters: Castro Laboreiro Dogs older than 60 months had an increased QT interval duration and ST segment amplitude, however, had a decrease in MEA, and Q and R wave amplitudes.
The cardiac rhythm was assessed by analysing the ECG, and by cardiac auscultation, and it was observed that the majority (70%) had sinus arrhythmia and only 6 dogs had a regular rhythm. The level of sinus arrhythmia was measure by calculating the vasovagal tonus index and the ratio between the maximum and the minimum of the R-R interval, with a mean of 8.76±1.19 and 1.80±0.60, respectively. Also, a tendency to a negative linear correlation was found between the RRmax/RRmin and the HR, and the same parallelism occurred when VVTI was compared to the heart rate and respiratory rate.
The values of arterial blood pressure in Castro Laboreiro Dog were similar or higher when compared to the reference values published for other large breeds of dogs.
During this study we were faced with several study limitations. The impossibility to perform an echocardiography and radiographic examination during this study did not allow us to confirm if the 20 Castro Laboreiro Dogs where free of occult cardiac disease. Another limitation was the number of the animals included in the study, which could compromise the statistical analysis. Also, the greatest value of the ECG lies in recognizing arrhythmias; however, in this study we only recorded for few minutes, likely missing or underestimating the underlying arrhythmia. These are more prone to being detected using Holter monitoring, which records for 24 to 48 hours (Petrie, 2005).
It is our intention to continue the present study, by increasing the number of dogs, and consequently getting better and more reliable statistical treatment, in order to establish the electrocardiographic reference values in the Castro Laboreiro Dog. In fact, the Castro Laboreiro Dog as a large breed might be predisposed to cardiac diseases, as dilated cardiomyopathy. Hence this study is needed and has an important clinical significance, as it can be used as a helpful and valuable tool, allowing an earlier diagnosis of cardiac disease in this breed.