GEOFÍSICA E ENERGIA
USING MIDDLE-INFRARED
REFLECTANCE FOR BURNED AREA
DETECTION
RENATA LIBONATI DOS SANTOS
DOUTORAMENTO EM CIÊNCIAS GEOFÍSICAS E DA
GEOINFORMAÇÃO
(METEOROLOGIA)
GEOFÍSICA E ENERGIA
USING MIDDLE-INFRARED
REFLECTANCE FOR BURNED AREA
DETECTION
RENATA LIBONATI DOS SANTOS
DOUTORAMENTO EM CIÊNCIAS GEOFÍSICAS E DA
GEOINFORMAÇÃO
(METEOROLOGIA)
Tese orientada pelos Professores Doutores
Carlos da Camara e José Miguel Cardoso Pereira
to Leonardo and Maria Carolina
É o tempo da travessia: e, se não ousarmos fazê-la, teremos ficado, para sempre, à margem de nós mesmos.
i
Acknowledgements
First and foremost I offer my sincerest gratitude to my supervisor, Prof. Carlos da Camara, who has supported me throughout my thesis with his patience and knowledge whilst allowing me to work in my own way. I attribute the level of my PhD degree to his encouragement and effort and without him this thesis would not have been completed.
I also wish to thank Prof. José Miguel Cardoso Pereira for his assistance, dedication and inspired ideas. The supervision and support that he gave truly help the progression of this work.
I am especially indebted to Dr. Alberto Setzer to whom I thank the support, suggestions; and fruitful discussions, which helped overcoming a lot of difficulties. Moreover I wish to thank him to be responsible for my long stay in the Satellite Division from the Brazilian National Institute for Space Research (DSA/INPE).
I am grateful to DSA/INPE where I have partially developed this thesis, for providing satellite data and giving access to all the related information, as well as for supporting my participation in some scientific conferences and workshops where I have presented scientific
results from this research. A word of acknowledgment is also due to all my colleagues at DSA/INPE who have assisted me one way or another, especially in challenging me with alternative views. Their friendship and professional collaboration meant a great deal to me. In particular I would like to thanks Dr. Fabiano Morelli, whom have contributed in a fundamental way to my understanding of geographic information system.
I am very thankful to my colleagues at CGUL, in particular Dr. Teresa Calado, Dr. Célia Gouveia, Dr. Joana Freire, and Dr. Ricardo Trigo for their friendship, motivation, support, and suggestions that eased and made this work more pleasant. To Célia and Teresa a special thanks, more than ever, at the final stage of this work.
I am indebted to Dr. Wilfrid Schroeder (NOAA) who kindly provided the fire scars from LANDSAT sensor, to Jurandir Ventura (DSA/INPE) for making available some MODIS data, to José Carlos dos Santos (LCP/INPE) for collecting the samples of charcoal in Alta Floresta, to Dr. Simon Hook (JPL/NASA) for performing the charcoal emissivity measurements, to Dr. Alexandre Correia (USP) and Dr. Karla Longo (INPE) for kindly clarify my doubts concerning aerosols.
I can not forget my friends Liliana Madeira, Raquel Marujo and Sónia Domingos for theirs friendship and constant support during my stay in Portugal.
Last, but not the least, a very special word of acknowledgement to my family, family-in-law and close friends for their understanding and help provided during this long path. To my brother and my parents, for all the motivation, encouragement, support they have always provided and for every bit of their love and patient; without it this work would have been impossible. A very special thought towards my mom and my dad, who always believe on me.
To my husband, Leonardo, who has always accompany me along this journey, and whom made me believe that nothing is out of reach, I wish to thank for all his patient, help and unconditional love without which all this effort would never make sense. Moreover I would like to thank all his scientific support and suggestions;that without them this work would not have ever ended.
Finally, to Maria Carolina, who was born during this thesis and who cannot understand yet why mummy has to work so much, I want to thanks for all the happiness she brought to my life and for being my mainly inspiration during this work.
This work was supported by the Portuguese Foundation of Science and Technology (FCT) (Grant No. SFRH/BD/21650/2005).
v
Abstract
A strategy is presented that allows deriving a new index for burned area discrimination over the Amazon and Cerrado regions of Brazil. The index is based on information from the near-infrared (NIR) and middle-infrared (MIR) channels of the Moderate Resolution Imaging Spectroradiometer (MODIS). A thorough review is undertaken of existing methods for retrieving MIR reflectance and an assessment is performed, using simulated and real data, about the added value obtained when using the radiative transfer equation (RTE) instead of the simplified algorithm (KR94) developed by Kaufman and Remer (1994), the most used in the context of burned area studies. It is shown that use of KR94 in tropical environments to retrieve vegetation reflectance may lead to errors that are at least of the same order of magnitude of the reflectance to be retrieved and considerably higher for large values of land surface temperature (LST) and solar zenith angle (SZA). Use of the RTE approach leads to better estimates in virtually all cases, with the exception of high values of LST and SZA, where results from KR94 are also not usable. A transformation is finally defined on the MIR/NIR reflectance space aiming to enhance the spectral information such that vegetated and burned surfaces may be effectively discriminated. The transformation is based on the difference between MIR and NIR in conjunction with the distance from a convergence point in the MIR/NIR space, representative of a totally burnt surface. The
transformation allows defining a system of coordinates, one coordinate having a small scatter for pixels associated to vegetation, burned surfaces and soils containing organic matter and the other coordinate covering a wide range of values, from green and dry/stressed vegetation to burned surfaces. The new set of coordinates opens interesting perspectives to applications like drought monitoring and burned area discrimination using remote-sensed information.
vii
Resumo
O coberto vegetal da superfície da Terra tem vindo a sofrer mudanças, por vezes drásticas, que conduzem a alterações tanto na rugosidade da superfície terrestre como no seu albedo, afectando directamente as trocas de calor sensível e latente e de dióxido de carbono entre a superfície terrestre e a atmosfera (Sellers et al., 1996). Neste contexto, as queimadas assumem um papel de extremo relevo (Nobre et al., 1991; O’Brien, 1996; Xue, 1996) na medida em que constituem uma das mais importantes fontes de alteração do coberto vegetal, resultando na destruição de florestas e de recursos naturais, libertando carbono da superfície continental para a atmosfera (Sellers et al., 1995) e perturbando as interacções biosfera-atmosfera (Levine et al., 1995; Scholes, 1995) através de mudanças na rugosidade do solo, na área foliar e noutros parâmetros biofísicos associados ao coberto vegetal. Ora, neste particular, a Amazónia Brasileira constitui um exemplo notável de mudanças no uso da terra e do coberto vegetal nas últimas décadas, como resultado da desflorestação induzida pelo homem bem como por causas naturais (Gedney e Valdes, 2000; Houghton, 2000; Houghton et al., 2000; Lucas et al., 2000), estimando-se que as
regiões tropicais sejam responsáveis por cerca de 32% da emissão global de carbono para a atmosfera (Andreae, 1991). Neste contexto, a disponibilidade de informações pormenorizadas e actualizadas sobre as distribuições espacial e temporal de queimadas e de áreas ardidas em regiões tropicais afigura-se crucial, não só para uma melhor gestão dos recursos naturais, mas também para estudos da química da atmosfera e de mudanças climáticas (Zhan et al., 2002).
A detecção remota constitui, neste âmbito, uma ferramenta indispensável na medida em que permite uma monitorização em tempo quase real, a qual se revela especialmente útil em áreas extensas e/ou de difícil acesso afectadas pelo fogo (Pereira et al., 1997). Diversos instrumentos, tais como o Land Remote Sensing Satellite/Thematic Mapper (LANDSAT/TM) e o National Oceanic and Atmospheric Administration/Advanced Very High
Resolution Radiometer (NOAA/AVHRR) têm vindo a ser extensivamente utilizados na
gestão dos fogos florestais, em particular aos níveis da detecção de focos de incêndio e da monitorização de áreas queimadas. Mais recentemente, o instrumento VEGETATION a bordo do Satellite Pour l'Observation de la Terre (SPOT) tem vindo a ser utilizado com sucesso na monitorização de fogos. Finalmente, são de referir os sensores da série Along
Track Scanning Radiometer (ATSR) para os quais têm vindo a ser desenvolvidos algoritmos
de identificação de focos de incêndio, e ainda o sensor Moderate Resolution Imaging
Spectroradiometer (MODIS) que tem vindo a demonstrar capacidades óptimas no que
respeita à observação global de fogos, plumas e áreas queimadas.
Neste contexto, os métodos actuais de detecção de áreas ardidas através da detecção remota têm vindo a dar prioridade à utilização das regiões do vermelho (0.64 µm) e infravermelho-próximo (0.84 µm) do espectro eletromagnético. No entanto, tanto a região do vermelho quanto a do infravermelho-próximo apresentam a desvantagem de serem sensíveis à presença de aerossóis na atmosfera (Fraser e Kaufman, 1985; Holben et. al., 1986). Desta forma, em regiões tropicais como a Amazónia, onde existem grandes camadas de fumo devido à queima de biomassa, a utlização destas duas regiões do espectro
eletromagnético torna-se insatisfatória para a detecção de áreas ardidas. Por outro lado, a região do infravermelho médio (3.7 – 3.9 µm) tem a vantagem de não ser sensível à presença da maior parte dos aerossóis, exceptuando a poeira (Kaufman e Remer, 1994) mostrando-se, ao mesmo tempo, sensível a mudanças na vegetação devido à absorção de água líquida.
Com efeito, estudos acerca dos efeitos do vapor de água na atenuação do espectro eletromagnético demonstraram que a região do infravermelho médio é uma das únicas regiões com relativamente pouca atenuação (Kerber e Schut, 1986). Acresce que a região do infravermelho médio apresenta uma baixa variação da irradiância solar (Lean, 1991), tendo-se ainda que a influência das incertezas da emissividade na estimativa da temperatura da superfície é pequena quando comparada com outras regiões térmicas tais como as de 10.5 e 11.5 µm (Salysbury e D’Aria, 1994).
A utilização da radiância medida através de satélites na região do infravermelho médio é, no entanto, dificultada pelo facto de esta ser afectada tanto pelo fluxo térmico quanto pelo fluxo solar, contendo, desta forma, duas componentes, uma emitida e outra reflectida, tendo-se que a componente reflectiva contém os fluxos térmico e solar reflectidos pela atmosfera e pela superfície enquanto que as emissões térmicas são oriundas da atmosfera e da superfície. Ora, a componente solar reflectida é de especial interesse para a detecção de áreas ardidas pelo que se torna necessário isolá-la do sinal total medido pelo sensor. Devido à ambiguidade deste sinal, a distinção dos efeitos da reflectância e da temperatura torna-se uma tarefa muito complexa, verificando-se que os métodos em que se não assume nenhuma simplificação, levando-se, portanto, em consideração todos os constituintes do sinal do infravermelho médio se tornam complexos e difíceis de serem aplicados na prática, na medida em que requerem dados auxiliares (e.g. perfis atmosféricos) e ferramentas computacionais (e.g. modelos de tranferência radiativa). Kaufman e Remer (1994) desenvolveram um método simples para estimar a reflectância do infravermelho médio o qual assenta em diversas hipóteses simplificadoras. Apesar do objectivo primário
que levou ao desenvolvimento do método ser a identificação de áreas cobertas por vegetação densa e escura em regiões temperadas, este método tem sido lagarmente utilizado nos estudos acerca da discriminação de áreas queimadas, algumas das vezes em regiões tropicais (Roy et al., 1999; Barbosa et al., 1999; Pereira, 1999). Na literatura não existe, no entanto, nenhum estudo acerca da exactidão e precisão deste método quando aplicado com o objectivo de detectar áreas ardidas, em especial em regiões tropicais. Neste sentido, no presente trabalho procedeu-se a um estudo de viabilidade do método proposto por Kaufman e Remer (1994) em simultâneo com a análise da equação de tranferência radiativa na região do infravermelho médio, tendo sido realizados testes de sensibilidade dos algoritmos em relação aos erros nos perfis atmosféricos, ruído do sensor e erros nas estimativas da temperatura da superfície. Para tal recorreu-se ao modelo de transferência radiativa Moderate Spectral Resolution Atmospheric Transmittance and Radiance Code (MODTRAN), dando-se especial atenção ao caso do sensor MODIS. Os resultados demonstraram que a utilização do método proposto por Kaufman e Remer (1994) em regiões tropicais para a estimativa da reflectância no infravermelho médio, leva a erros que são pelo menos da mesma ordem de magnitude do parâmetro estimado e, em alguns casos, muito maior, quando ocorre a combinação de altas temperaturas da superfície terrestre com baixos ângulos zenitais solares. A utilização da equação de transferência radiativa mostrou-se uma boa alternativa, desde que estejam disponíveis dados acerca da temperatura da superfíce terrestre assim como dos perfis atmosféricos. Entretanto, nas regiões onde ocorrem altos valores de temperatura da superfície terrestre e baixos ângulos zenitais solares, quaisquer dos dois métodos se mostra pouco utilizável, já que nesta região a estimativa da reflectância constitui um problema mal-posto.
Em paralelo, utilizaram-se informações sobre aerossóis de queimada para efectuar simulações do MODTRAN que permitiram avaliar a reposta do canal do infravermelho-médio à este tipo de perturbação do sinal, muito comum na Amazónia Brasileira. A fim de tornar o estudo o mais realístico possível, procedeu-se à coleta de material resultante de queimadas
na região Amazónica, mais especificamente em Alta Floresta, Mato Grosso, Brasil. Estes resultado foram então integrados nos estudos em questão, possibilitando a caracterização espectral das áreas ardidas.
Com base nos resultados obtido definiu-se uma tranformação no espaço do infravermelho próximo e médio com o objetivo de maximizar a informação espectral de forma a que as superfícies vegetadas pudessem ser efectivamente discriminadas e as áreas ardidas identificadas. A tranformação baseia-se na diferença entre a reflectância nos infravermelhos próximo e médio, em conjunto com a distância a um ponto de convergência no espaço espectral dos infravermelhos próximo e médio, ponto esse representativo de uma área completamente ardida. A tranformação permitiu a definição de um novo sistema de coordenadas, o qual provou ser bastante útil no que diz respeito á identificação de áreas ardidas. Este novo espaço de coordenadas constitui uma inovação na área dos estudos de queimadas, já que permite ao mesmo tempo definir dois tipos de índices, o primeiro dos quais identifica superfícies que contém ou não biomassa e o segundo identifica, de entre as superfícies que contêm biomassa, a quantidade de água presente, podendo variar de vegetação verde (abundância de água) até áreas ardidas (ausência de água). Além de distiguir áreas ardidas, os índices desenvolvidos podem ainda ser aplicados em outros casos como, por exemplo, estudos de estresse hídrico e secas.
xiii
Contents
Acknowledgements
i
Abstract
v
Resumo
vii
Contents
xiii
List of Figures
xvii
List of Tables
xxv
Acronyms
xxvii
Chapter 1. Introduction
1
1.1. Motivation 1 1.2. The Problem 6 1.3. Main Contributions 8 1.4. Publications 9 1.5. Thesis Organization 11Chapter 2. Theoretical background
13
2.1. Fundamentals of Radiation in MIR 13
2.1.2. Radiative transfer equation in MIR 15
2.1.3. Channel equivalent quantities 19
2.2. Retrieval of MIR reflectance 21
2.3. Usage of MIR reflectance for burned area identification 26
Chapter 3. Sensors, datasets and radiative transfer code
37
3.1. Satellite sensors characteristics 37
3.1.1. MODIS coarser resolution sensor 37
3.1.2. ETM+ high resolution sensor 40
3.2. Datasets 41
3.2.1. Satellite data 41
3.2.1.1. MODIS data 41
3.2.1.2. Landsat data 44
3.2.2. Laboratory spectral data on reflectance 46
3.2.2.1. Spectral library data 46
3.2.2.2. Charcoal data 51
3.2.3. Auxiliary information 55
3.2.3.1. AERONET 55
3.2.3.2. Hot spots 56
3.3. MODTRAN radiative transfer code and atmospheric characterization 56
Chapter 4. Retrieving MIR reflectance for burned area mapping in tropical regions
61
4.1. Introduction 61
4.2. Data and methods 63
4.2.1. Theoretical background 63
4.2.2. Retrieval of MIR reflectance 64
4.2.3. Radiative transfer simulations 68
4.3.1. MODTRAN-4 simulations 72
4.3.2. Case study 79
4.4. Concluding remarks 86
Chapter 5. Retrieval of middle-infrared reflectance using the Radiative Transfer
Equation
89
5.1. Introduction 89
5.2. Method and data 91
5.2.1. Radiative Transfer Simulations 91
5.2.2. Sources of errors in the retrieval of MIR reflectance 92
5.2.2.1. Radiometric Noise of MODIS channel 20 93
5.2.2.2. Atmospheric Profiles 94
5.2.2.3. Uncertainty in Surface Temperature 98
5.3. Analysis and Results 99
5.3.1. Error-free case 99
5.3.2. Error case 104
5.3.3. Total MIR Reflectance Error 110
5.4. Concluding remarks 116
Chapter 6. On a new coordinate system for optimal discrimination of vegetation and
burned areas using MIR/NIR information
121
6.1. Introduction 121
6.2. Data 124
6.3. Methods 125
6.3.1. Rationale 125
6.3.2. The
/
space 1296.3.3. The V/W coordinate system 135
6.4. Results and discussion 143
6.4.2. Unsupervised validation 146
6.5. Concluding remarks 150
Chapter 7. Concluding remarks
153
References
159
xvii
List of Figures
Figure 1.1. Spectrum of emission from the Sun and the Earth highlighting the contributions of
both sources of radiation in the MIR domain. Adapted from
http://aerial.evsc.virginia.edu/~jlm8h/class/. 7
Figure 2.1. Radiative transfer at a middle-infrared wavelength
. 17Figure 2.2. Spectral signatures of burned material sample (solid curves), green vegetation (dot curve) and dry vegetation (dashed curve). Gray boxes delimit the VISIBLE (between 0.4 and 0.7), NIR (around 0.8) and SWIR (between 1.0 and 2.0 µm) spectral regions in order to emphasize their contrast. Charcoal signatures were obtained from the USGS Digital Spectral Library as well as from samples provide by the author, whereas vegetation signatures were obtained from the MODIS-UCSB
spectral library (see Chapter 3). 29
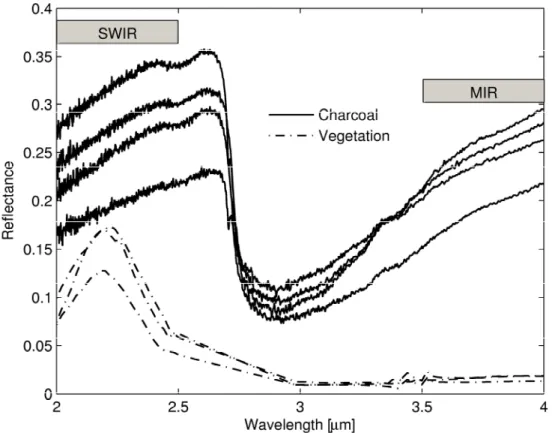
Figure 2.3. Spectral signatures of four charcoal samples (solid curves) and of three vegetation samples (dot-dashed curves). Gray boxes delimit the SWIR (between 2.0 and 2.5 µm) and MIR (between 3.5 and 4 µm) spectral regions in order to emphasize their contrast. Charcoal and vegetation signatures were respectively obtained from samples of fire residues from Alta Floresta (see next Chapter), state of Mato Grosso,
Brazil and from the Advanced Spaceborne Thermal Emission and Reflection
Radiometer (ASTER) spectral library (Baldridge et al., 2009). 30
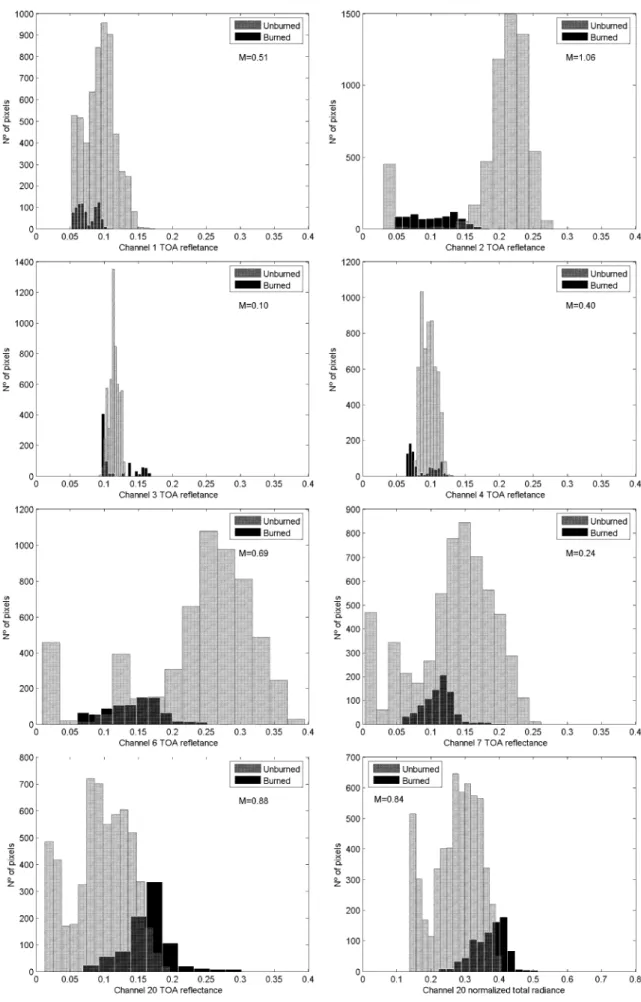
Figure 2.4. Histograms of the burned and unburned classes for MODIS channels. 31
Figure 2.5. Atmospheric transmittance attenuation [%] on MODIS VIS to MIR channels for three different levels of smoke contamination due to biomass burning.
a(
0
.
55
)
indicates the AOD at 0.55 µm and
denotes the Ängstrom parameter, whichcharacterizes aerosol particle size distribution. 33
Figure 2.6. Comparison between MIR (left panel) and TIR (right panel) regions concerning the attenuation by water vapor content throughout the three atmospheric profiles (MLS, MLW and TRO) stored at MODTRAN-4 (see Chapter 3 for details). 33
Figure 3.1. Spectral response function of MODIS channels. 38
Figure 3.2. Spectral response functions of MODIS MIR channels. 44
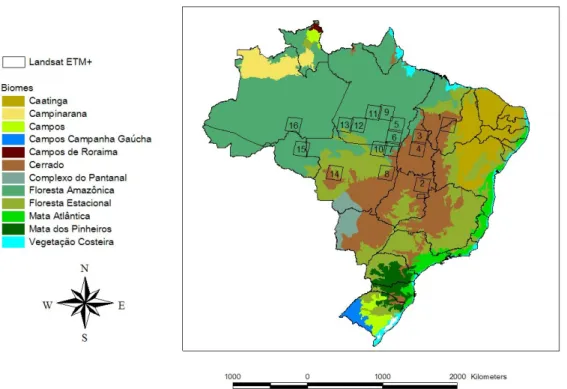
Figure 3.3. IBAMA general biomes classification map for Brazil and the location of the 16
Landsat ETM+ scenes listed in Table 3.3. 45
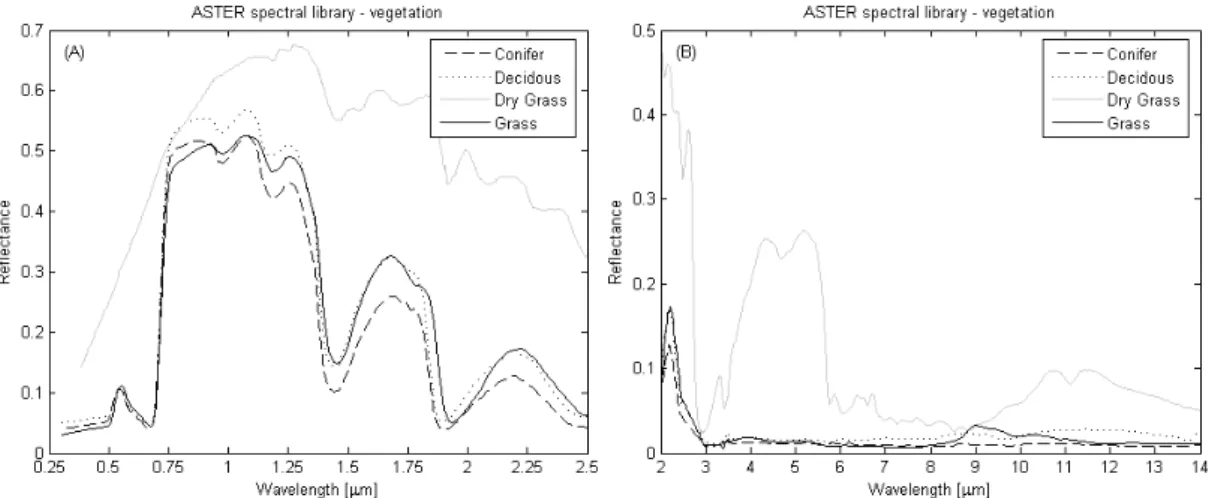
Figure 3.4. Spectral signature of vegetation from ASTER spectral library in (A) the 0.25-2.5
µm and (B) the 2-15 µm spectral ranges. 49
Figure 3.5. As in Figure 3.4, but respecting to soils. 49
Figure 3.6. As in Figure 3.4, but respecting to water. 49
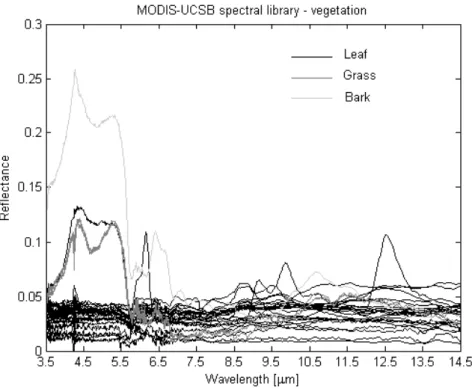
Figure 3.7. Spectral signature of vegetation from MODIS-UCSB spectral library. 50
Figure 3.8. Spectral signature of the five charcoal samples. 53
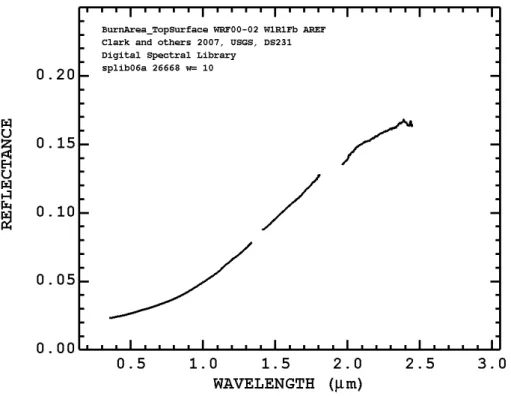
Figure 3.9. Burned area stored at the USGS Digital Spectral Library. Adapted from
http://speclab.cr.usgs.gov/spectral-lib.html 54
Figure 3.10. Computed reflectance values in channels 20 (MIR) and 2 (NIR) for samples belonging to vegetation, water and soil classes as stored in the JHU directory at ASTER spectral library, as well as based on samples of burned materials. 54
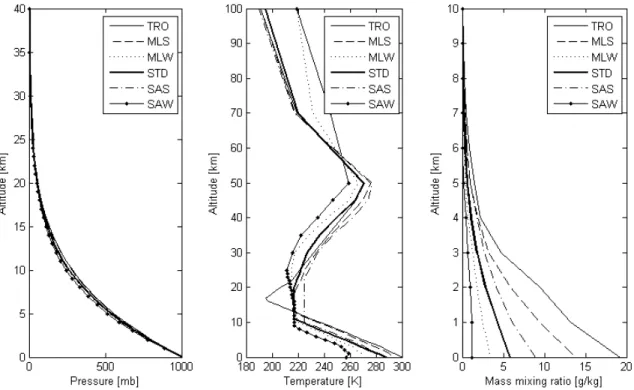
Figure 3.11. Pressure, temperature and humidity profiles of the six standard model
Figure 3.12. Standard deviation (SD) of the MODIS and the three ECMWF (TRO, MLS and MLW) SD profiles of mass mixing ratio (solid curves) and temperature (dashed
curves). 59
Figure 4.1. Contribution to the MIR signal due to surface emission (SE), surface reflection (SR), atmospheric emission (AE) and atmospheric scattering (AS) for TRO
atmospheric profile, considering all simulations. 64
Figure 4.2. Monthly values of P75 of LST during August, 2008 over Brazil. Data were
retrieved from METEOSAT-8/SEVIRI data. 70
Figure 4.3. Monthly values of P75 of SZA as obtained from samples of Aqua/MODIS and Terra/MODIS imagery along the year of 2007 over Brazil. The threshold of 40º for SZA is highlighted by the dotted horizontal line. Dotted vertical lines delimit the fire
season in Amazonia (June to October). 71
Figure 4.4. Relative error [%] on MIR reflectance in the case of MLW for charcoal (left panel) and vegetation (right panel). Solid (dotted) curves indicate positive (negative) errors
and the thick curve highlights the no-error line. 75
Figure 4.5. As in Figure 4.4 but in the case of MLS. 75
Figure 4.6. As in Figure 4.4 but in the case of TRO. 75
Figure 4.7. Plot of the ratio
L
eL
MIR[%] as a function of LST in the case of MLW (left panel)and TRO (right panel). Square (circle) symbols denotes charcoal (vegetation) surface
whereas open (black) symbols characterizes SZA of 0º (60º). 77
Figure 4.8. Diagram of values of reflectance for vegetation and charcoal surfaces for different atmospheric profiles, LST and SZA; a) the two surfaces with prescribed constant values of 0.03 and 0.24 for vegetation (green) and charcoal (orange); b) to d) retrieved values of reflectance using Eq. (4.11) as a function of SZA and LST for
MLW, MLS and TRO profiles. 78
Figure 4.9. Location of the Ilha Grande National Park, between the states of Paraná and Mato Grosso do Sul (upper right panel) in southwestern Brazil (upper left panel) and
Landsat TM image (RGB 543) of the National park before the fire episode, on April 26, 2006 (lower left panel) and after the fire episode on May 12, 2006 (lower right
panel). The outline of the National Park is shown in red. 81
Figure 4.10 MODIS mean profiles (bold curves) of temperature (left panel) and humidity (right panel) over Ilha Grande National Park on May 12, 2006. The TRO profile stored
at MODTRAN-4 is also represented (thin curves). 82
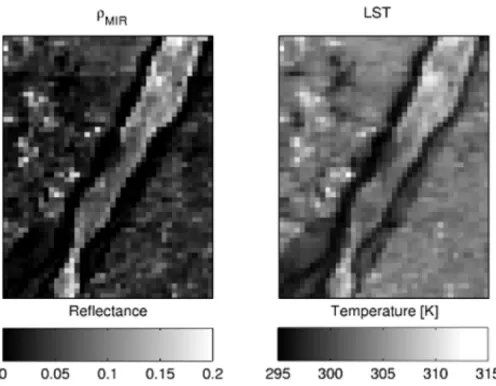
Figure 4.11. Retrieved values of surface MIR reflectance (left panel) and LST (right panel)
over the Ilha Grande National Park on May 12, 2006. 83
Figure 4.12. Histograms of MIR reflectance for burned (black) and unburned (gray) classes as retrieved by means of Eq. (4.11) for May-12 (upper panel), TRO (middle panel)
and TRO-HOT (lower panel) environments. 85
Figure 5.1. Sensitivity of MODIS channel 20 to small changes in temperature. The dashed
line indicates the values of NEΔT and NEΔL. 93
Figure 5.2. Frequency histogram of the satellite radiance perturbations for MODIS channel
20. 94
Figure 5.3. Comparison between the perturbed profiles (black curves) and respective reference profile (white curve) of water vapor mass mixing ratio (upper panel) and temperature (lower panel). Adapted from Peres and DaCamara (2004). 96
Figure 5.4. Distributions of the perturbed atmospheric parameters, namely one-way total atmospheric transmittance, two-way total atmospheric transmittance, atmospheric upward radiance and atmospheric downward radiance, respecting to MODIS channel
20 for TRO standard atmosphere. 97
Figure 5.5. As in Figure 5.4 but for MLS standard atmosphere. 97
Figure 5.6. As in Figure 5.4 but for MLW standard atmosphere. 98
Figure 5.8. Accuracy in the retrieval of MIR reflectance using Eq. (4.2), for TRO, MLS and MLW, three view angles, three solar zenith angles and for charcoal (full lines) and
pine tree (dashed lines). 101
Figure 5.9. Dependence of the logarithm of retrieval error on LST and SZA for TRO profile.
102
Figure 5.10. Dependence of land surface temperature of errors in the retrieval of MIR reflectance of charcoal for TRO, MLS and MLW for nadir view and four solar zenith
angles. 102
Figure 5.11. Dependence on LST of the different terms of Eq. (4.2). 104
Figure 5.12. Error in MIR reflectance using Eq. (4.2) as obtained from each set of imposed perturbations on TRO profile as a function of four solar zenith angles (0º, 30º, 45º and 60º) and three view zenith angles (0º, 30º and 60º) in the case of a charcoal surface.
106
Figure 5.13. As in Figure 5.12 but for a vegetated surface. 106
Figure 5.14. As in Figure 5.12 but for the MLS profile. 107
Figure 5.15. As in Figure 5.13 but for the MLS profile. 107
Figure 5.16. As in Figure 5.12 but for the MLW profile. 108
Figure 5.17. As in Figure 5.13 but for the MLW profile. 108
Figure 5.18. As in Figure 5.9, but for an offset of +1 K in LST. 109
Figure 5.19. As in Figure 5.18, but for the MLW atmosphere. 110
Figure 5.20. Comparison between the total errors when using KR94 (labeled as KFE) and
RTE in the case of TRO. 113
Figure 5.21. As in Figure 5.20 but in the case of MLS. 114
Figure 5.22. As in Figure 5.20 but in the case of MLW. 115
Figure 5.23. MODIS images (02/28/2001) over Los llanos, Venezuela/Colombia, South America: a) MODIS channel 20 radiance; b) MODIS LST product cloud mask; c) RGB
from MODIS channels 7, 2 and 1; d), e) and f) zooms of a burned scar (red square) of
a), b) and c), respectively. Black pixels denote NaN. 118
Figure 6.1. MIR and NIR reflectance bi-spectral space showing the reflectance convergence point of recently burned areas samples extracted from MODIS imagery covering the north, northwest and midwest of Brazil. Dashed-dot lines delimit the upper and lower bounds in MIR and NIR and their intersection is the convergence point. 128
Figure 6.2. Pre- (open symbols) and post-fire (black symbols) mean values of MIR and NIR over 12 selected scars in the Amazon (circles) and Cerrado (squares). Displacement vectors and contour lines of
(left panel) and
(right panel) are represented bysolid and dotted lines, respectively. 129
Figure 6.3. The unit square U in the x-y space and the kite domain U’ in the
/
space, together with a set of points in U and the respective images in U’. 132Figure 6.4. Location in the
/
space of laboratory measurements respecting to five typesof materials. 134
Figure 6.5. Images in the space
/
of the points shown in Figure 6.2. 135Figure 6.6. Coordinate lines V=const (from -1 to 1 with intervals of 0.2) and W=const (from 0
to 1 with intervals of 0.2) over the kite domain U’. 139
Figure 6.7. The spider web (V, W) in the MIR/NIR space. Contour lines of V from -1 to 1 (with intervals of 0.2) and contour lines of W from 0 to 1 (with intervals of 0.1). 139
Figure 6.8. As in Figure 6.4 (left panel) and in Figure 3.10 (right panel) but with representation of coordinate curves of V (thin lines) and of W (thick lines) on spaces
/
and MIR/NIR, respectively. Laboratory measurements include discriminationamong soil types. 141
Figure 6.9. As in Figure 6.8 but respecting to pre- and post-fire pixels as shown in Figure 6.5
(left panel) and in Figure 6.2 (right panel). 141
Figure 6.10. Comparison between RBG (721) from MODIS showing scene number 3 and two
Figure 6.11. Scatter plot (gray points) of MODIS pixels corresponding to scene 3 in the R/NIR space (left panel), in the MIR/NIR space (middle panel) and in the
/
space and respective coordinate lines of V and W (right panel). Selected pixels corresponding to burned surfaces, soil, vegetation and clouds are respectivelyrepresented by red, yellow, green and cyan crosses. 145
Figure 6.12. As in Figure 6.11 but corresponding to scene 4. Selected pixels representative of burned surfaces, soil, vegetation and water are respectively represented by red
yellow, green and blue crosses. 145
Figure 6.13. As in Figure 6.11 but respecting to scene 6. Selected pixels corresponding to burned surfaces, soil, vegetation, sparse vegetation and cloud shadows are respectively represented by red yellow, green brown and black crosses. 146
Figure 6.14. As in Figure 6.11 but corresponding to scene 8. Selected pixels representative of burned surfaces, soil and vegetation are respectively represented by red, yellow,
and green crosses. 146
Figure 6.15. Comparison of results of k-means corresponding to scene 3 in the
/
(left panel) and the geographical (central panel) spaces with the RGB (543) of the corresponding high resolution ETM+ image (right panel). See main text for colorcodes of clusters. 148
xxv
List of Tables
Table 3.1. MODIS channels specifications. 39
Table 3.2. ETM+ channels specifications. 41
Table 3.3. The 16 Landsat ETM+ images used for validation and respective biomes and
locations. 46
Table 3.4. ASTER spectral library – vegetation. 47
Table 3.5. ASTER spectral library – soil. 47
Table 3.6. ASTER spectral library – water. 48
Table 3.7. MODIS spectral library – vegetation. 51
Table 3.8. Description of the five charcoal samples. 52
Table 3.9. Air temperature at the first boundary and total water vapour contents of the six
standard model atmosphere stored at MODTRAN-4. 57
Table 4.1. Typical values of the different terms of Eq. (4.2) in the case of nadir view and for three different SZA considering a MLW atmospheric profile and a surface
temperature equal to 290 K. 66
Table 4.2. Effects of water vapor content [g·cm-2] on atmospheric terms for the three profiles
Table 4.3. Mean values,
u
(b
), and standard deviation,u
(b
), of unburned (burned) surfaces and discrimination indices, M, for retrieved values of surface reflectance inthe case of May-12, TRO and TRO-HOT environments. 86
Table 6.1. Coordinates (x,y) of the considered points in Figure 6.3 (upper panel) and
coordinates (
,
) of the respective images (lower panel). 133Table 6.2. Centroids of clusters as obtained from applying k-means to coordinates V and W
of the 16 scenes described in Table 3.3. 149
Table 7.1. Comparison of the discriminating ability between burned and unburned surfaces (M index) by means of traditional indices and using the new proposed (V,W) index for
xxvii
Acronyms
AE Atmospheric Emission
AERONET Aerosol Robotic Network
AFRL Air Force Research Lab
AOD Aerosol Optical Depth
ARM Atmospheric Radiation Measurement
ARPEGE Action de Recherche Petit Echelle Grande Echelle
AS Atmospheric Scattering
ASTER Advanced Spaceborne Thermal Emission and Reflection
Radiometer
ATBD Algorithm Theoretical Basis Document
ATSR Along Track Scanning Radiometer
AVHRR Advanced Very High Resolution Radiometer
BAI Burned Area Index
BRDF Bidirectional Reflectance Distribution Function
DGI Divisão de Geração de Imagens
DISORT Discrete Ordinates Radiative Transfer Program for a
DSA Divisão de Satélites e Sistemas Ambientais
ECMWF European Centre for Medium-Range Weather Forecast
ENVI Environment for Visualizing Images
EOS Earth Observing System
ETM+ Enhanced Thematic Mapper Plus
ETM Enhanced Thematic Mapper
FAPAR Fraction of Absorbed Photosynthetically Active Radiation
FGV Fraction of Green Vegetation
FOVs Field of Views
FTP File Transfer Protocol
GEMI Global Environmental Monitoring Index
GOES Geostationary Satellite Server
HDF Hierarchical Data Format
IBAMA Instituto Brasileiro do Meio Ambiente e dos Recursos Naturais
Renováveis
INPE Brazilian National Institute for Space Research
ITPP International TOVS Processing Package
JHU John Hopkins University
JPL JET Propulsion Laboratory
KR94 Kaufman and Remer (1994)
LANDSAT Land Remote Sensing Satellite
LCP Laboratório de Combustão
LSE Land Surface Emissivity
LST Land Surface Temperature
LTE Local Thermodynamic Equilibrium
MIR Middle-Infrared
MLW Mid-Latitute Winter
MODIS Moderate Resolution Imaging Spectroradiometer
MODTRAN Moderate Spectral Resolution Atmospheric Transmittance and
Radiance Code
MOD01 MODIS/Terra Level 1A Sensor
MOD07 MODIS/Terra Atmospheric Profiles Product
MOD021 MODI/Terra S Level 1B 1 km V5 product,
MOD35_L2 MODIS/Terra Cloud Mask Level 2
MYD07_L2 MODIS/Aqua Atmosphere Profile Level 2.0 product
MYD11_L2 MODIS/Aqua LST/E 5-Minute L2 Swath 1 km data set
NASA National Aeronautics and Space Administration
NCEP National Center for Environmental Prediction
NDVI Normalized Difference Vegetation Index
NEΔL Noise-Equivalent Radiance Difference
NEΔT Noise-Equivalent Temperature Difference
NIR Near-Infrared
NOAA National Oceanic and Atmospheric Administration
NWP Numeric Weather Prediction
PVI Perpendicular Vegetation Index
P75 Third Quartile
R Red
RGB Red Green Blue
RTE Radiative Transfer Equation
SAS Sub-Arctic Summer
SAVI Soil-Adjusted Vegetation Index
SAW Sub-Arctic Winter
SE Surface Emission
SEVIRI Spinning Enhanced Visible and Infra-Red Imager
SGP Southern Great Plains
SNR Signal-to-Noise Ratio
SPOT Satellite Pour l'Observation de la Terre
SR Surface Reflection
SST Sea Surface Temperature
STD 1976 US Standard
SWIR Short-Wave Infrared
SZA Solar Zenith Angle
TE Thermodynamic Equilibrium
TIR Thermal Infrared
TISI Temperature Independent Spectral Index
TM Thematic Mapper
TOA Top of the Atmosphere
TOVS TIROS Operational Vertical Sounder
TRO Tropical
UCSB University of California, Santa Barbara
USGS U.S. Geological Survey
VI Vegetation Index
VIS Visible
VSBT Space Vehicles Directorate
1
Chapter 1
Introduction
1.1. Motivation
Over the last decade continuous monitoring of vegetation fires from space has greatly contributed to an increased recognition of the major role played by biomass burning in climate change. In fact, biomass burning is a global source of greenhouse gases (e.g. CO2
and CH4) as well as of CO, NO2, NOx, CH3Br and hydrocarbons involved in the formation of
acid rain, in the photochemical production of tropospheric ozone and in the destruction of stratospheric ozone (e.g. Crutzen and Andreae, 1990; Penner et al., 1992). High concentrations of aerosol particles in the atmosphere due to biomass burning decrease the amount of global photosynthetic radiation at canopy levels, affecting sensible and latent heat fluxes at the surface (Eck et al., 1998; Schafer et al., 2002; Procopio et al., 2004). At the regional level, biomass burning may induce changes in atmospheric stability and associated vertical motions, leading to alterations of the hydrologic cycle with significant impacts on
regional climate (e.g. Rosenfeld, 1999; Menon et al., 2002; Koren et al., 2004). Teleconnection processes may also take place, inducing changes e.g. of rainfall and surface temperature patterns across distant parts of the world (Chase et al., 2000; Zhao et al., 2001; Pielke et al., 2002). In particular, the study by Evangelista et al. (2007) suggests that almost half of the aerosol black carbon in the South-West Atlantic may derive from South American biomass burning. In addition, vegetation fires are one of the most important causes of land use/cover dynamics (Lambin and Geist, 2006), destroying and altering vegetation structure and depositing charcoal and ash on the surface. Such changes may, in turn, lead to modifications in the ratio of latent to sensible heat flux, the transfer of momentum from the atmosphere and the flux of moisture through evaporation and transpiration (Sellers et al., 1996; Jin and Roy, 2005).
Accordingly, a considerable number of environmental studies and Earth resources management activities require an accurate identification of burned areas. In addition, the apparent global increase in the incidence, extent, and severity of uncontrolled burning have lead to calls for international environmental policies concerning fire (Stocks et al., 2001). Such concerns support the need to provide reliable fire information to policymakers, scientists, and resource managers. However, due to the very broad spatial extent and the limited accessibility of some of the largest areas affected by fire, instruments on-board satellites are currently the only available operational systems capable to collect cost-effective burned area information at adequate spatial and temporal resolutions (Pereira, 1999). Several studies have been carried out using remote sensing images for burned land mapping, covering a variety of techniques based on different spatial, spectral and temporal resolutions. However an accurate algorithm to detect surface changes caused by fire is still hampered by the complexity of the processes involved, the spectral signature of burned areas depending on the type of vegetation that burns, the completeness of the burn, the post fire evolution and regeneration of the vegetation, and the rate of charcoal and ash dissipation. Even if the persistence of the signal is longer for burned areas, the detection of
active fires benefits from the fact that active fires have a spectral signature strongly contrasting with the environmental context (Eva and Lambin, 1998). Besides, there is another essential aspect of the problem which relates to two different post-fire signals, both commonly designated by fire scar (Robinson, 1991); first, the deposition of charcoal and ash on surface and second the alteration of vegetation structure/abundance. The first type of signal is a unique consequence of vegetation combustion, but has relatively short duration and tends to be almost completely erased by wind and rainfall in a few weeks or months after the fire. The second signal is more stable, although its persistence may vary from 2-3 weeks in tropical grasslands to several years in boreal forest ecosystems. However, the second type of signal is less appropriate to discriminate fire effects, since partial or complete removal of plant canopies may also be due to other factors such as cutting, grazing, wind throw, water stress, or the action of insects and pathogens (Pereira et al., 1994).
In such context, reliable detection of burned vegetation from remote sensing requires the use of spectral bands that are sensitive to changes in radiance in response to burning (Trigg and Flasse, 2000). In this particular, most efforts have relied on spectral channels from coarse resolution sensors such as the National Oceanic and Atmospheric Administration/Advanced Very High Resolution Radiometer (NOAA/AVHRR) (Fraser et al., 2000; Martín and Chuvieco, 1993; Pereira, 1999), Satellite Pour l'Observation de la Terre (SPOT/VEGETATION) (Gregoire et al., 2003; Stroppiana et al., 2002), the Along Track Scanning Radiometer (ATSR) data (Eva and Lambin, 1998) and more recently, the Moderate Resolution Imaging Spectroradiometer (MODIS) (Roy et al., 2002; Chuvieco et al., 2008). A large number of such studies have been undertaken using vegetation indices, in particular those based on the AVHRR sensor (Pereira et al., 1994; Caetano et al., 1996; Frederiksen et al., 1990; Malingreau, 1990; Kasischke et al., 1993; Martín and Chuvieco, 1993; Kasischke et al., 1995). Although the AVHRR sensor has been widely applied for burned area mapping, a number of limitations were identified which make AVHRR a less ideal tool for monitoring fire-effects (Barbosa et al., 1999; Martín and Chuvieco, 1995; Pereira, 1999). In contrast, the
MODIS sensor was designed to enhance fire-mapping capabilities and its spectral bands in near-infrared (NIR) wavelengths provide a better spectral discrimination among burned and unburned surfaces (Loboda et al., 2007). Moreover, MODIS produces full global coverage everyday, with a repeat cycle of approximately 1-2 days which is especially relevant for burned area detection in cloudy and smoky regions since it provides further alternative days for analysis.
Current methods for detecting burned areas mainly rely on information in the red (R) and the NIR regions of the electromagnetic spectrum. In fact, the NIR region appears as especially adequate for burned area detection, since the contrast between healthy vegetation (which are highly reflective) and charred surfaces (which are highly absorbent) tends to be very sharp in NIR region. On the other hand, several studies have shown that the visible (VIS) range is not very effective for discriminating burned surfaces (López and Caselles, 1991; Pereira and Setzer, 1993; Razafimpanilo et al., 1995; Pereira, 1999). and have pointed out a number of reasons for such impairment; 1) several common land cover types, namely water bodies and wetlands, some forest types, especially the dense coniferous ones, and many soil types are as dark in the VIS as recent burns, reducing the usefulness of the VIS range to discriminate burns; 2) since Earth observation satellites were designed to image all types of surface features, ranging from the very bright, such as clouds, snow, and deserts, to the very dark ones, such as water, the dynamic range available for discriminating between different types of surfaces, which are dark in the VIS, is narrow; 3) the VIS domain is especially sensitive to aerosol and water vapor scattering and absorption in the atmosphere and therefore its usage for burned area detection may bring unsatisfactory results, in particular because of the presence of heavy smoke layers due to the biomass burning and as well as in case of very moist atmospheres. It is also worth mentioning that the short-wave infrared (SWIR) domain, from 1.2 to 2.5 µm, has also been widely used for burned area detection, with reasonably good results (Pereira and Setzer, 1993; Trigg and Flasse, 2001; Martin et al., 2006).
More recently the middle-infrared (MIR) spectral domain (around 3.75 – 3.9 µm) has been applied for burned area discrimination, since it may contribute to solving certain ambiguities between burned and unburned surfaces which may occur, for example, when using information from other parts of the electromagnetic spectrum, namely the SWIR, especially between 2.0 and 2.5 µm (França and Setzer, 2001). As shown by Libonati et al. (2010) the increase in reflectance over burned surfaces is higher in MIR than in SWIR, allowing a better discrimination between both surfaces. In addition, the spectral response to fire in the MIR domain is similar to that observed in the VIS region, but with a larger increase in brightness and with an unequivocal reduction of sensitivity to atmospheric effects. In fact, one of the major difficulties encountered in the tropics when discriminating burned areas relates to the ephemeral character of spectral signatures, in contrast with temperate and boreal regions, where it is possible to wait until the end of the fire season to map scars from previous months (Pereira, 2003). This procedure is not feasible in tropical savannas, where combustion products are easily scattered by wind, and the charcoal spectral signal quickly fades out. Burning of converted tropical forest produces a short-lived signal, since fire in this region is closely related to pasture and agriculture practices, which disturb the soil surface. In tropical regions, mapping burned areas with remote sensing data has, therefore, to be performed during the dry season, i.e. simultaneously with the fire episodes. Accordingly, results will be, largely affected by smoke aerosols, which contaminate surface observation and reduce the spectral contrast between distinct land cover types. As pointed out by Kaufman (1995), most of these particles may remain in the atmosphere for around a week. In addition, from July to October, i.e. during the Amazon fire season, a large high pressure system tends to dominate the region, inhibiting precipitation and reducing relative humidity due to the subsidence of dry air from the upper levels of the atmosphere (Nobre et al., 1998).
The associated atmospheric circulation favors the retention over a large horizontal area of smoke emitted by fires, reducing visibility to the point of closing airports during, even up to two or three weeks after the end of the fire season (Reinhardt et al., 2001). Under such
circumstances, the MIR spectral band appears especially adequate for monitoring the land surface during fire episodes, because it is largely unaffected by the presence of most aerosols, a highly desired characteristic in remote sensing.
1.2. The Problem
As mentioned above, the MIR spectral domain potentially appears as an optimal way to mitigate the aerosol effects associated to biomass burning, since it is also affected by vegetation changes but is not sensitive to the presence of most aerosols. Pereira (1999) found that the increase in reflectance over burnt surfaces is higher in the MIR that in the VIS and thus considered the NIR/MIR bi-spectral space as more appropriate for burned area discrimination than the classical VIS/NIR space used in remote sensing of vegetation. However usage of the MIR radiation brings up the difficult problem of distinguishing, in a single measurement, between a diversity of radiance sources, namely the thermal emission and the solar reflection from the atmosphere and the surface, as shown in Figure 1.1.
Boyd and Duane (2001) have pointed out that the use of MIR radiation for studying the Earth’s surface properties at and beyond the regional scale may be unreliable. At such scales, the emitted radiation component of the signal may be subject to additional confounding variables, rather than representing the intrinsic properties of the surface itself (Kaufman and Remer, 1994). Considering the tropical forest environment, emitted radiation, though related to forest canopy properties, may also be influenced by varying localized atmospheric conditions such as wind speed and air vapour conductance (Price, 1989), site-specific factors such as topography and aspect (Florinsky et al., 1994), and soil moisture conditions (Luvall and Holbo, 1991; Nemani et al., 1993). Indeed, such factors have been more strongly related to emitted radiation from tropical forest canopies than to forest properties such as basal area and tree density (Luvall et al., 1990; Wong, 1993; Nichol,
1995). It may be preferable, therefore, to use only the reflected component of the MIR radiation in the study of tropical forests at regional to global scales.
Figure 1.1. Spectrum of emission from the Sun and the Earth highlighting the contributions of
both sources of radiation in the MIR domain. Adapted from
http://aerial.evsc.virginia.edu/~jlm8h/class/.
Methods that take into account the major components of the MIR signal have to rely on information from auxiliary datasets (e.g. atmospheric profiles) and require large computational means (e.g. for radiative transfer computations). Other methods like those proposed by Li and Becker (1993), Nerry et al. (1998) and Petitcolin and Vermote (2002) also require auxiliary datasets and heavy numerical computations. The methodology proposed by Goita and Royer (1997) shows promising potential but need further validation. Schutt and Holben (1991) and Roger and Vermote (1998) proposed the retrieval of MIR reflectance using data provided by the five AVHRR channels but results have significant bias when the surface emissivity in MIR and in thermal infrared (TIR) is not close to unity.
Earth Sun Earth Sun Earth Sun Earth Sun
A simple method was proposed by Kaufman and Remer in 1994 where different assumptions are made to separate the thermal and solar components of the MIR signal. This method does not require heavy numerical computations and present the major advantage of avoiding the use of auxiliary datasets. It was first designed to identify dense, dark vegetation areas in mid-latitude environments and has been widely used in burned area discrimination (Roy et al., 1999; Barbosa et al., 1999; Pereira, 1999). However, to the best of our knowledge, no assessment has been made on the required accuracy of the MIR reflectance retrievals to adequately identify burnt areas in tropical environments.
1.3. Main Contributions
Taking into account the issues discussed in the previous sections, the work developed in the present thesis was organized into the following four main contributions and to the best of our knowledge the last three may be regarded as innovative:
1. To perform, for a wide range of atmospheric, geometric and surface conditions, a quality assessment of MIR reflectance data when retrieved using i) the algorithm proposed by Kaufman and Remer (1994) and ii) the complete radiative transfer equation (RTE);
2. To understand the adequacy and limitations of the above mentioned algorithms when applied to burned area discrimination, in particular in the Amazon and Cerrado regions. Special attention will be devoted to the MODIS sensor;
3. To define a strategy that allows achieving an acceptable accuracy in retrieved MIR reflectances for a wide range of atmospheric and surface conditions occurring within the Amazon and Cerrado regions;
4. To develop a bi-spectral index, based on NIR and MIR information, which allows an optimal discrimination of burned areas.
1.4. Publications
Several parts of the results found in the present thesis were published both in conferences and journals with referee. Theses papers are listed below:
I. Papers published in journals with referees
1) Libonati, R.; DaCamara, C. C.; Pereira, J. M. C.; Peres, L. F. (2010). Retrieving middle-infrared reflectance for burned area mapping in tropical environments using MODIS. Remote Sensing of Environment, v. 114, p.
831-843, 2010. http://dx.doi.org/10.1016/j.rse.2009.11.018.
2) Chuvieco, E.; Opazo, S.; Sione, W.; Valle, h.; Anaya, J.; Bella, C.; Cruz, I.; Manzo, L.; Lopez, G.; Mari, N.; Gonzalez-Alonso, F.; Morelli, F., Setzer, A.; Csiszar, I.; Kanpandegi, J. A., Bastarrika, A., and Libonati, R. (2008). Global burned land estimation in Latin America using MODIS composite data.
Ecological Applications, v. 18, p. 64-79, 2008.
1) Libonati, R.; DaCamara, C. C.; Pereira, J. M. C.; Peres, L. F. (2010). On a new coordinate system for optimal discrimination of vegetation and burned areas using MIR/NIR information. Remote Sensing of Environment.
2) Libonati, R.; DaCamara, C. C.; Pereira, J. M. C.; Peres, L. F. (2010). Retrieval of middle-infrared reflectance using the Radiative Transfer Equation. IEEE
Transactions on Geoscience and Remote Sensing.
III. Papers in conferences
1) Libonati, R., DaCamara, C. C., Pereira, J. M. C., Setzer, A., and Peres, L. F. (2009). Developing an optimal spectral index for burnt scars identification.
2009 EUMETSAT Meteorological Satellite Conference.
2) Libonati, R., DaCamara, C. C., Pereira, J. M. C., Setzer, A., and Peres, L. F. (2009). Retrieval of middle-infrared reflectance using remote sensing data: the tropical point of view. XIV Simpósio Brasileiro de Sensoriamento Remoto.
3) Libonati, R., DaCamara, C. C., Pereira, J. M. C., Setzer, A., and Peres, L. F. (2008). On the use of MIR reflectance for burned area identification. 2008 EUMETSAT Meteorological Satellite Conference.
4) Libonati, R., DaCamara, C. C., Pereira, J. M. C., Setzer, A., and Peres, L. F. (2008). Effects of the geometry of illumination on the retrieval of MIR reflectance. XV Congresso Brasileiro de Meteorologia.
5) Morelli, F., Libonati, R. and Setzer, A. (2007). Refinamento de um método de área queimada, e validação utilizando imagens CBERS no norte de Mato Grosso, Brasil. Simpósio Brasileiro de Sensoriamento Remoto 2007.
6) Libonati, R, DaCamara, C. C., Pereira, J. M. C., Setzer, A., and Morelli, F. (2007). A new optimal index for burnt area discrimination. Satellite Imagery. 2007 EUMETSAT Meteorological Satellite Conference and the 15th Satellite Meteorology & Oceanography Conference of the American Meteorological Society.
7) Libonati, R., Morelli, F., Setzer, A., DaCamara, C. e Pereira, J.M.C. (2006). Assinatura espectral de áreas queimadas em produtos MODIS. XIV Congresso Brasileiro de Meteorologia.
IV. Abstracts in conferences
1) Libonati, R., DaCamara, C. C., Pereira, J. M. C., Setzer, A., and Peres, L. F., (2008). On the use of MIR reflectance for burned area identification. International Radiation Symposium 2008.
2) Libonati, R., DaCamara, C. C., Pereira, J. M. C., Setzer, A., and Peres, L. F.,(2008). On the usage of MIR reflectance to detect burnt areas in tropical regions. EUMETSAT 3rd Training Workshop.
3) Libonati, R., Morelli, F., Setzer, A., DaCamara, C., e Pereira, J.M.C. (2006). Análise da assinatura espectral de áreas queimadas em produtos MODIS. XII Simposio SELPER.
4) Morelli, F., Libonati, R., e Setzer, A. (2006). Avaliação da resposta espectral dos canais 20 e NDVI do MODIS/AQUA na área queimada do parque nacional de Ilha Grande – PR – Brasil. XII Simposio SELPER.
1.5. Thesis Organization
Including the present Introduction, the thesis is organized in seven Chapters. Chapter 2 presents an overview of the fundamentals of radiometric theory in the middle infrared spectral region, as well as of the currently proposed methods aiming to the retrieval of MIR reflectance. The usage of MIR reflectance for burned area discrimination is also discussed in this Chapter. Chapter 3 provides a thorough description of the satellite datasets, sensors used and auxiliary data, and gives a brief overview of the Moderate Spectral Resolution Atmospheric Transmittance and Radiance code (MODTRAN). Chapter 4 deals with the problem of retrieving MIR reflectance by means of the Kaufman and Remer (1994) methodology, and provides an assessment of its advantages and disadvantages for burned area detection. Chapter 5 addresses the problem of inverting the MIR radiative transfer equation and a strategy is defined that allows achieving an adequate accuracy in MIR reflectance retrieval for a wide range of atmospheric and surface conditions occurring within Amazon and Cerrado regions. In this respect, a comparison between RTE and KR94 approaches was carried out, tanking into account the performance, the need for auxiliary data and also the required computing resources. The development of a new coordinate system aiming burned area discrimination is presented in Chapter 6 together with its validation over the study area. Finally, Chapter 7 provides a critical review of the results obtained in this work, focusing on the limitations of the proposed index and pointing out some of the possible directions of future research.
13
Chapter 2
Theoretical background
2.1. Fundamentals of Radiation in MIR
2.1.1.
Blackbody concept
A blackbody is defined as an ideal perfectly opaque material that absorbs all the incident radiation at any wavelength and reflects none. When in thermodynamic equilibrium (TE), the emitted radiance of a blackbody is isotropic and is determined by its temperature,
T, according to Plank’s function given by:
1
1
2
,
2 5 1 5 2
hcK T C Te
C
e
hc
T
B
(2.1)where
B
,
T
is the spectral blackbody radiance at a given wavelength
, K is the Boltzmann´s constant (1
.
381
10
23J
K
1), h is the Planck constant (6
.
626
10
34J
s
),c
represents the speed of light in the vacuum (
2
.
998
10
8m
s
-1) and T is the absolute temperature of the blackbody.C
12hc
2 is given by (1
.
191
10
8W
m
2
µm
4
sr
1) andK
hc
C
2 is given by (1
.
438
10
4µm
K
).A blackbody emits more than any other body in TE at the same temperature. A blackbody is therefore a perfect emitter as well as a perfect absorber. The radiance emitted by a non-blackbody object at a given wavelength from a surface at thermodynamic temperature
T
s is given by multiplying the Planck function by the so-called spectral emissivity
:
,
T
B
,
T
s
.
L
(2.2)The atmosphere is not strictly in TE, but below about 70 km a bulk volume of air behaves approximately as a blackbody, so that its radiant emission may be considered as depending only on the respective local temperature. In fact, some of the energy absorbed by every molecule of each chemical species in that volume of air is transferred by the collisional exchange with nearby molecules during the lifetime of the excited molecular in its vibrational or rotational state. If the mean time between molecular collisions is much shorter than the lifetime of the excited molecular state and diffusion time, then a single kinetic temperature characterizes the emission of the gas, to a good approximation. This condition is referred to as local thermodynamic equilibrium (LTE) and prevails up to height of about 70 km at the wavelength of the infrared radiation (Goody, 1964). The concept of LTE plays a fundamental role in radiative transfer studies since the main radiation laws discussed below, which are strictly valid in TE, may be extended to LTE.
2.1.2.
Radiative transfer equation in MIR
The atmosphere plays an important role both along the Sun-to-target and target-to-sensor paths and as a source of thermal emission. First the atmosphere may reduce the radiance of the beam throughout absorption as well as by scattering. On the other hand, atmosphere may increase the radiance of the beam by emission plus multiple scattering from all other directions into the direction of its propagation (Liou, 1980). Therefore, under clear-sky conditions, absorption, scattering and emission of radiation by atmospheric constituents (gaseous and aerosols) have also to be taken into account.
Contributions to the total MIR radiation measured by a sensor are illustrated in Figure 2.1. Surface thermal emission [1] is expressed by Eq. (2.2) and depends on the temperature and emissivity, on the wavelength and on the view zenith angle. As the Earth’s surface is not a blackbody, the downward radiance emitted by the atmosphere [2] may be reflected by it and propagated up to the sensor together with the downward solar diffuse radiance [3]. During day time, in the MIR spectral domain, part of the direct solar irradiance that reaches the surface is then reflected by it towards the sensor [4].The other part of the radiance emitted and scattered by the atmosphere that reaches the sensor is represented by the atmospheric upward emitted radiance [5] and by the scattering of solar radiation [6]. The surface emission [1], the downward atmospheric radiance [2], the downward solar diffuse radiance [3] and the reflected direct solar irradiance [4], penetrate the atmosphere and part of them reach the sensor after atmospheric absorption and scattering. Therefore, in clear sky conditions and for an atmosphere in LTE, the top of the atmosphere (TOA) radiance,
![Figure 2.5. Atmospheric transmittance attenuation [%] on MODIS VIS to MIR channels for three different levels of smoke contamination due to biomass burning](https://thumb-eu.123doks.com/thumbv2/123dok_br/15657289.1059827/69.892.191.681.127.539/figure-atmospheric-transmittance-attenuation-channels-different-contamination-biomass.webp)
![Figure 4.4. Relative error [%] on MIR reflectance in the case of MLW for charcoal (left panel) and vegetation (right panel)](https://thumb-eu.123doks.com/thumbv2/123dok_br/15657289.1059827/111.892.113.629.121.379/figure-relative-error-reflectance-charcoal-panel-vegetation-right.webp)