arXiv:1305.3118v2 [nucl-ex] 5 Jul 2013
G. Agakishiev7, A. Balanda3, D. Belver18, A. Belyaev7, J.C. Berger-Chen9, A. Blanco2, M. B¨ohmer10,
J. L. Boyard16 , P. Cabanelas18 , S. Chernenko7 , A. Dybczak3 , E. Epple9 , L. Fabbietti9 , O. Fateev7 , P. Finocchiaro1 , P. Fonte2,b, J. Friese10, I. Fr¨ohlich8, T. Galatyuk5,c, J. A. Garz´on18, R. Gernh¨auser10, K. G¨obel8, M. Golubeva13,
D. Gonz´alez-D´ıaz5, F. Guber13, M. Gumberidze5,16,∗, T. Heinz4, T. Hennino16, R. Holzmann4,∗, A. Ierusalimov7,
I. Iori12,e, A. Ivashkin13 , M. Jurkovic10 , B. K¨ampfer6,d, T. Karavicheva13 , I. Koenig4 , W. Koenig4 , B. W. Kolb4, G. Kornakov18, R. Kotte6, A. Kr´asa17, F. Krizek17, R. Kr¨ucken10, H. Kuc3,16, W. K¨uhn11,
A. Kugler17, A. Kurepin13, V. Ladygin7, R. Lalik9, S. Lang4, K. Lapidus9, A. Lebedev14, T. Liu16,
L. Lopes2 , M. Lorenz8,c, L. Maier10 , A. Mangiarotti2 , J. Markert8 , V. Metag11 , B. Michalska3 , J. Michel8 , C. M¨untz8, L. Naumann6, Y. C. Pachmayer8, M. Palka3, Y. Parpottas15,f, V. Pechenov4, O. Pechenova8,
J. Pietraszko4, W. Przygoda3, B. Ramstein16, A. Reshetin13, A. Rustamov8, A. Sadovsky13, P. Salabura3,
A. Schmah9,a, E. Schwab4 , J. Siebenson9 , Yu.G. Sobolev17 , S. Spataro11,g, B. Spruck11 , H. Str¨obele8 , J. Stroth8,4, C. Sturm4, A. Tarantola8, K. Teilab8, P. Tlusty17, M. Traxler4, R. Trebacz3, H. Tsertos15,
T. Vasiliev7, V. Wagner17, M. Weber10, C. Wendisch6,d, J. W¨ustenfeld6, S. Yurevich4, Y. Zanevsky7
(HADES collaboration)
1
Istituto Nazionale di Fisica Nucleare - Laboratori Nazionali del Sud, 95125 Catania, Italy
2
LIP-Laborat´orio de Instrumenta¸c˜ao e F´ısica Experimental de Part´ıculas , 3004-516 Coimbra, Portugal
3
Smoluchowski Institute of Physics, Jagiellonian University of Cracow, 30-059 Krak´ow, Poland
4
GSI Helmholtzzentrum f¨ur Schwerionenforschung GmbH, 64291 Darmstadt, Germany
5Technische Universit¨at Darmstadt, 64289 Darmstadt, Germany 6
Institut f¨ur Strahlenphysik, Helmholtz-Zentrum Dresden-Rossendorf, 01314 Dresden, Germany
7
Joint Institute of Nuclear Research, 141980 Dubna, Russia
8Institut f¨ur Kernphysik, Goethe-Universit¨at, 60438 Frankfurt, Germany 9
Excellence Cluster ’Origin and Structure of the Universe’ , 85748 Garching, Germany
10
Physik Department E12, Technische Universit¨at M¨unchen, 85748 Garching, Germany
11
II. Physikalisches Institut, Justus Liebig Universit¨at Giessen, 35392 Giessen, Germany
12
Istituto Nazionale di Fisica Nucleare, Sezione di Milano, 20133 Milano, Italy
13
Institute for Nuclear Research, Russian Academy of Science, 117312 Moscow, Russia
14Institute of Theoretical and Experimental Physics, 117218 Moscow, Russia 15Department of Physics, University of Cyprus, 1678 Nicosia, Cyprus 16
Institut de Physique Nucl´eaire (UMR 8608), CNRS/IN2P3 - Universit´e Paris Sud, F-91406 Orsay Cedex, France
17
Nuclear Physics Institute, Academy of Sciences of Czech Republic, 25068 Rez, Czech Republic
18LabCAF. F. F´ısica, Univ. de Santiago de Compostela, 15706 Santiago de Compostela, Spain
anow at Lawrence Berkeley National Laboratory, Berkeley, USA balso at ISEC Coimbra, Coimbra, Portugal
c also at ExtreMe Matter Institute EMMI, 64291 Darmstadt, Germany d also at Technische Universit¨at Dresden, 01062 Dresden, Germany e also at Dipartimento di Fisica, Universit`a di Milano, 20133 Milano, Italy
f also at Frederick University, 1036 Nicosia, Cyprus
g now at Dipartimento di Fisica Generale and INFN, Universit`a di Torino, 10125 Torino, Italy ∗ Corresponding authors: R.Holzmann@gsi.de, M.Gumberidze@gsi.de
(Dated: July 8, 2013)
Data on inclusive pion and eta production measured with the dielectron spectrometer HADES in the reaction p+93
Nb at a kinetic beam energy of 3.5 GeV are presented. Our results, obtained with the photon-conversion method, supplement the rather sparse information on neutral-meson pro-duction in proton-nucleus reactions existing for this bombarding energy regime. The reconstructed e+
e−e+
e− transverse-momentum and rapidity distributions are confronted with transport-model
calculations, which account fairly well for both π0
and η production.
PACS numbers: 25.40.Ep, 13.40.Hq
I. INTRODUCTION
The High-Acceptance DiElectron Spectrometer (HADES) experiment at GSI pursues a comprehensive program of dielectron emission studies in few-GeV
nucleon-nucleon [1, 2], proton-nucleus [3], and nucleus-nucleus collisions [4]. Dilepton spectroscopy allows to investigate the properties of hadrons produced, propagated, and decayed in a strongly interacting medium. This is because leptons (electrons and muons)
do not themselves interact strongly when traveling through finite-sized hadronic matter, that is, their kinematics remain basically undistorted. Lepton-pair measurements are hence ideally suited to search for medium modifications of hadrons in nuclear matter [5, 6]. The observed dilepton spectra consist, however, of a complex superposition of various mesonic and baryonic contributions, and their interpretation requires a detailed knowledge of all sources. Indeed, early interpretations of dilepton spectra from relativistic heavy-ion collisions commonly introduced a schematic distinction of (i) hard initial contributions related to Drell-Yan type processes, (ii) the thermal radiation off the fireball, and (iii) the hadronic cocktail from late de-cays following its disassembly (cf. [7]). Transport models supersede this artificial separation as they describe all phases of the collision on an equal footing by following continuously virtual and real photon emission over time. Presently, they are commonly employed in the few-GeV bombarding energy regime to describe particle production and propagation through the medium, in particular, when dealing with the complex dynamics of nucleus-nucleus reactions [8–13]. Comprehensive information on meson production is thereby mandatory to benchmark and constrain those calculations. In this context the neutral pion and eta mesons are of partic-ular interest as they contribute largely to the dilepton spectrum via their Dalitz decays, π0
→ γγ∗ → γe+e−
and η → γγ∗→ γe+e−, respectively.
Although in the few-GeV energy regime a large body of systematic data on pion and, to a lesser extent, on eta production in nucleus-nucleus collisions has been gath-ered over the last decades, mostly at the Bevalac, the AGS, and SIS18 accelerators, there is much less infor-mation available from proton-nucleus reactions. The lat-ter ones are, however, important as an inlat-termediate step between nucleon-nucleon and nucleus-nucleus collisions. Charged pions from p+A have been measured at the Be-valac with proton beams of kinetic energies up to 2.1 GeV [14], at TRIUMF up to 0.5 GeV [15], and recently by the HARP experiment at the CERN PS with proton en-ergies between 2 and 12 GeV [16]. Information on eta production in p+A reactions is even more scarce. Only the PINOT experiment at the SATURNE accelerator in Saclay provided data for proton energies in the range of 0.8 – 1.5 GeV [17].
In this paper we supplement the available body of ex-perimental results on pion (π0, π−) and eta production
in p+A collisions with data obtained with HADES in the p+Nb reaction at 3.5 GeV. Negative pions have been identified via their characteristic energy loss vs. momen-tum signature in the HADES time-of-flight (TOF) sys-tem. The neutral mesons, π0 and η, were reconstructed
with the photon-conversion technique in which meson decay photons are detected via their external conver-sion into an e+e− pair via a Bethe-Heitler process,
pref-erentially in high-Z materials. This method has been developed foremost in high-energy physics experiments
[18–22] to study the radiative decays of the quarkonium states χc into J/Ψ + γ and χb into Υ + γ. It has also
been used in high-energy heavy-ion reactions, namely by the PHENIX experiment at RHIC, studying Au+Au collisions at a nucleon-nucleon center-of-mass energy of √s
N N = 200 GeV [23] and by the ALICE experiment at
the LHC in√sN N = 7 TeV p+p collisions [24]. Making
use of the good momentum resolution of charged-particle trackers, in particular at low energies, the conversion technique offers typically better energy resolution than a photon calorimeter. We demonstrate here the applica-bility of the method with HADES in few-GeV reactions. Our paper is organized as follows. Section II describes the experiment and the employed particle identification procedures. In Sec. III the photon-conversion method is introduced. Pion and eta spectra, as well as meson mul-tiplicities are presented in Sec. IV. In Sec. V we compare the data with transport-model calculations and, finally, in Sec. VI we summarize our findings. A preliminary version of the π− data shown here has already been
pre-sented elsewhere [25].
II. THE EXPERIMENT
The six-sector high-acceptance spectrometer HADES operates at the GSI Helmholtzzentrum f¨ur Schwerionen-forschung in Darmstadt where it takes beams from the heavy-ion synchrotron SIS18. Although its setup was originally optimized for dielectron spectroscopy, HADES is in fact a versatile charged-particle detector with both good efficiency and momentum resolution. Its main com-ponent serving for electron and positron selection is a hadron-blind Ring-Imaging Cherenkov detector (RICH). Further particle identification power is provided by the time of flight measured in a plastic scintillator TOF wall, the electromagnetic shower characteristics observed in a pre-shower detector, and the energy-loss signals from the scintillators of the TOF wall as well as from the four planes of drift chambers serving as tracking stations. Charged particles are tracked through a toroidal mag-netic field provided by a six-coil iron-less superconduct-ing magnet. All technical aspects of the detector are described in [26].
In the experiment discussed here a proton beam with a kinetic energy of Ep= 3.5 GeV and an average intensity
of about 2 × 10⁶particles per second impinged onto a
12-fold segmented niobium (93Nb) target with a total
thick-ness of 5.4 mm and corresponding to 2.8% nuclear inter-action probability. The online event selection was done in two steps: a 1st-level trigger (LVL1) selected events
with at least three charged-particle hits in the TOF wall (Nch ≥ 3) and a 2nd-level trigger (LVL2) fired if an
elec-tron or posielec-tron candidate was recognized. While all LVL2 events were recorded, the LVL1-only events were downscaled by a factor three before being written to data storage. This trigger scheme was in fact primarily opti-mized for studying inclusive e+e− production [3]. To
allow for trigger bias studies also LVL1 events requir-ing only two charged particles were recorded durrequir-ing part of the experiment. The LVL1 triggered on p+Nb reac-tions with 56% efficiency in the Nch ≥ 3 mode and 72%
efficiency in the Nch ≥ 2 mode. These efficiencies
cor-respond to the fraction of reactions that actually fired the LVL1 trigger. In total 4.6 × 10⁹ events – downscaled
LVL1 or LVL2 – were recorded, corresponding to 7.7×10⁹
inspected LVL1 events and 1.3×10¹⁰
reactions in the tar-get.
To study neutral-meson production the off-line data analysis searched for events containing four lepton tracks from which the 4-momentum of π0 and η mesons was
fully reconstructed. Indeed, the electromagnetic decays of the latter, that is mostly π0
, η → γe+
e− (Dalitz) and
π0
, η → γγ, combined with the external conversion of the decay photon(s) on material in the inner region of the HADES detector lead to events with a characteristic 4-lepton signature, namely π0
, η → e+e−e+e−.
Simula-tions show that the Dalitz decay contributes 25% (30%) of the detectable π0
(η) yield. The direct branching into e+e−e+e− due to the decay into two virtual
pho-tons (π0
, η → γ∗γ∗) is however very small [27] and
con-tributes in our case only about 2 – 2.5% of the total yield. Electron and positron tracks were identified fol-lowing the procedures described in detail in [4, 26]. As no dedicated start detector was present in this experimen-tal run, the start time for the time-of-flight measurement was reconstructed event-by-event from the most optimal assignment of different particle hypotheses (e−or π−) to
tracks of negatively charged fast particles. In the extrac-tion of the inclusive negative pion yields no direct use was however made of the time-of-flight information, and the pion identification was solely based on energy-loss vs. momentum cuts (for details see [25]). Positive pions were identified likewise but, their spectra being partially contaminated by the much more abundant protons, they were not analyzed further.
III. THE PHOTON-CONVERSION METHOD
The detection of high-energy photons via a full re-construction of conversion pairs has been applied with success by the PHENIX [23] and ALICE [24] collabora-tions in ultrarelativistic collisions. Although those ex-periments comprise also electromagnetic calorimeters for photon detection, this alternative method is considered to offer valuable supplementary information on thermal photon as well as neutral-meson production. As HADES is presently not equipped with such a calorimeter, the conversion method opens a unique approach to π0 and η
detection.
Meson reconstruction was realized with identified lep-ton tracks by joining opposite-sign leplep-tons into e+
e−
pairs and by further combining those dileptons pair-wise into e+e−e+e− multiplets. Calculating the
four-lepton invariant mass Me+e−e+e−and setting appropriate
mass cuts allows to select the π0 and η mesons,
respec-tively. Various opening angle cuts, optimized in extensive Monte-Carlo simulations, were applied to suppress com-binations of uncorrelated leptons, namely θe+e− < 2.5
◦
on the dilepton with the smaller opening angle and θe+e− < 20
◦ on the second one (all angles given in the
laboratory system). The 2.5◦selection is optimal for
con-version pairs while the 20◦cut accepts also the more
mas-sive and hence wider Dalitz pairs. In addition, a cut was applied on the relative angle between the two dileptons in a multiplet, namely θγ∗γ∗ > 5◦, to suppress spurious
counts at low Me+e−e+e−. These cuts were adjusted on
the data in order to maximize the meson yield while keep-ing the background of uncorrelated combinations low.
]
2[GeV/c
-e + e -e + eM
0 0.2 0.4 0.6 0.8 1counts/10 MeV
0 500 1000 15000
π
η
mixed evt CB
3.5 GeV p + Nb
Figure 1: (Color online) Invariant-mass distribution of all e+
e−e+
e− multiplets (dots, error bars are statistical)
mea-sured with HADES in the 3.5 GeV p+Nb reaction. To improve visibility, the data points are connected by a thin curve. The background of uncorrelated lepton combinations obtained from event mixing is shown as well (solid curve).
The resulting Me+e−e+e− distribution is shown in
Fig. 1. Prominent peaks appear at the masses of the π0 and the η mesons on top of a continuum yield
attributable to combinations of uncorrelated leptons. A systematic investigation of this combinatorial back-ground (CB) was done, both by comparing the mass dis-tributions of various charge combinations other than + – + – and by applying an event mixing technique. We find that the largest part (> 90%) of the CB originates from the combination of uncorrelated dileptons, that is uncor-related photons (real or virtual), mostly from multi-π0
events. In that sense, the e+
e−e+
e− CB behaves very
much like the two-photon CB observed in a calorimeter and it can hence be determined by event mixing. Thus, after subtraction of a mixed event CB normalized in the
Table I: Characteristics of the reconstructed meson peaks: raw signal counts above CB (integrated in the range 0.10 – 0.16 GeV/c2
for π0
and 0.46 – 0.60 GeV/c2
for η), signal/CB ratio in those mass ranges, position of the peak maximum, and σ width of the peak (σ =FWHM/2.35). All errors are statistical. identified meson π0 η signal [counts] 3800 ± 63 1240 ± 49 signal/CB 18.1 1.1 position [MeV] 134 ± 1 547 ± 2 width [MeV] 8.0 ± 0.6 19 ± 2
peak-free regions of the mass spectrum, the π0 and η
peak characteristics are straightforwardly extracted. In-tegrated raw yields, peak positions and widths (defined as σ =FWHM/2.35) are listed in Table I. Systematic errors on the yields from CB subtraction, estimated by varying the weights of the two normalization regions 0.2– 0.4 and 0.6–1.0 GeV/c2, are 5% for the π0 and 10% for
the η, respectively. Having corrected the individual lep-ton momenta for their energy loss of typically 2–3 MeV, both peak positions are found to be consistent with the nominal meson masses, namely Mπ0 = 0.13498 GeV/c2
and Mη = 0.54785 GeV/c2 [27]. The peak widths are
determined by the momentum resolution of the HADES tracking system and the low-mass tails are partly due to lepton energy loss by bremsstrahlung. The overall mass resolution is comparable to the one achieved typ-ically with electromagnetic calorimeters. Finally, from the observed yields inclusive meson multiplicities can be determined by correcting for acceptance and efficiency effects.
Note also that the η → π+π−π0
and η → 3π0
de-cays contribute to inclusive pion production. The latter of these two decay modes results in six final-state pho-tons of which any combination of two can contribute via conversion to the measured e+
e−e+
e− signal. We have
checked in simulations that these correlated lepton com-binations lead to a broad structure in the Me+e−e+e−
invariant-mass distribution. Considering that the eta is a factor 20 less abundant than the pion (see Sec. IV) it is not surprising that this contribution is indistinguishable from the uncorrelated CB in Fig. 1.
We have performed extensive detector simulations to study the reconstruction efficiency of the conversion tech-nique. To do this we have generated meson distributions with the Pluto event generator [28], tracked the resulting particles through a realistic model of the HADES setup with the GEANT3 physics simulation tool [29], embed-ded those tracks into real events from the p+Nb exper-iment, and reconstructed the overlayed events with the full HADES lepton analysis. The purpose of the em-bedding was to include realistic detector noise into the procedure. As the lepton identification in HADES relies
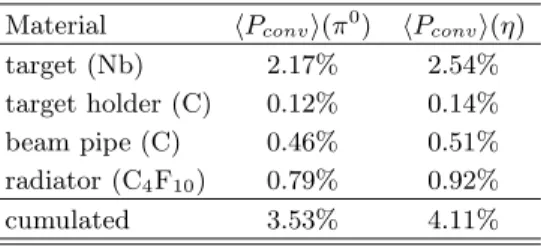
Table II: Average conversion probabilities hPconvi of decay
photons in various inner parts of the HADES setup obtained from GEANT3 simulations. The last row gives the cumulated probability due to all materials contributing to the detection of π0
and η mesons. See text for a discussion of systematic uncertainties on those numbers.
Material hPconvi(π0) hPconvi(η)
target (Nb) 2.17% 2.54%
target holder (C) 0.12% 0.14%
beam pipe (C) 0.46% 0.51%
radiator (C4F10) 0.79% 0.92%
cumulated 3.53% 4.11%
primarily on the RICH detector, only conversion pairs produced in the inner parts of the setup can contribute to the e+e−e+e− signal. These are the niobium
tar-get segments, the carbon-composite tartar-get holder, the carbon-composite beam pipe, and the RICH radiator gas C4F10. Conversion pairs produced in the RICH mirror
or in any of the following materials are not detectable. Average conversion probabilities hPconvi of π0and η
de-cay photons obtained from the simulations are listed in Table II. More than half of the conversion takes place in the niobium targets and the rest in the target holder, the beam pipe, and the RICH converter gas, with a the cumu-lated probability of 3.5–4.1% per photon. The difference in probabilities for π0 and η, respectively, is related to
the energy dependence of the conversion process. As the HADES pair vertex resolution, of the order of 2–3 cm, is not good enough to cleanly isolate the various converter parts in the event reconstruction we have refrained from applying specific vertex cuts and have exploited the cu-mulated conversion effect.
Systematic errors on the total conversion probability result mainly from uncertainties on the material budget and the alignment of the relevant inner detector parts. The thickness of the target foils is known with an error of 2% and their misalignment in the beam pipe adds
an-Table III: Average effective branching ratios hBReeeei,
geo-metric acceptances with respect to 4π hacci, pair reconstruc-tion efficiencies heffi, and total detecreconstruc-tion efficiencies hefftoti
relevant for the reconstruction of the π0
, η → e+
e−e+
e−final
states. Statistical errors due to the finite size of the simulated sample are of the order of 3% for π0
and 2% for η on all listed quantities. Systematic uncertainties are discussed in the text.
Particle hBReeeei hacci heffi hefftoti
π0
1.68 × 10⁻³ 4.53 × 10⁻³ 0.063 4.78 × 10⁻⁷
other 4% error. Inhomogeneities of the carbon-composite material lead to an estimated uncertainty of 10% on the holder and pipe contributions. Finally, for the radiator contribution we assume a 5% error. This leads then to an overall systematic error on the total material budget of 5% and hence an error of about 10% on the effciency for detecting double conversion events.
[GeV/c]
p
0 0.5 1 1.5E
ff
ic
ie
n
c
y
-2 10 -1 10 eff 2 10 × eeee BR × eff 0π
(a)
[GeV/c]
p
0 0.5 1 1.5E
ff
ic
ie
n
c
y
-2 10 -1 10 eff 2 10 ⋅ 2 × eeee BR × effη
(b)
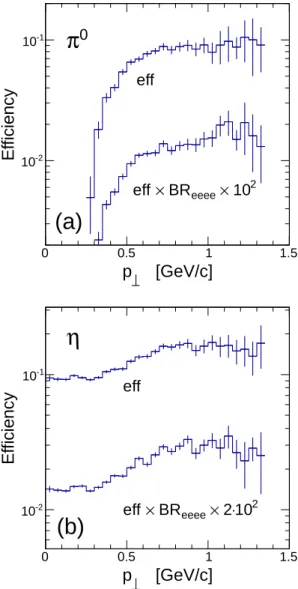
Figure 2: Efficiencies of meson reconstruction from e+
e−e+
e−
events as a function of transverse momentum p⊥. Shown are
the π0(a) and η (b) efficiencies with (eff ×BR
eeee) and
with-out (eff ) the contribution of the photon conversion. Error bars are statistical.
As we do not apply a secondary vertex selection to the e+e− pairs also Dalitz decays are included in our pair
signal. In the Dalitz case, of course, only the one real photon is required to convert. The combined branch-ing into all contributbranch-ing final states (γγ, γγ∗, and γ∗γ∗)
amounts to ≃ 100% for the π0
and to ≃ 40% for the η [27].
The meson sources used in the simulation were
mod-eled according to a fireball [30, 31] characterized by a temperature in the range T = 80–90 MeV and a central laboratory rapidity in the range ymax= 0.92–0.96. As
discussed below, the choice of these values is motivated by the data itself (cf. also Figs. 4 and 5). The Monte Carlo shows that the total detection efficiency efftot
de-pends only weakly on the meson source properties and mostly on the photon conversion probability, on the ge-ometric detector acceptance with respect to 4π acc, and on the pair reconstruction efficiency eff. In this defini-tion, acc includes the lepton low-momentum cutoff at around 50 MeV due to the track bending in the HADES magnet field and eff accounts for all detection and recon-struction losses within the HADES acceptance. As all of these quantities are averaged over the two-photon, the Dalitz, and the small direct decay channels it is useful to introduce an effective branching ratio BReeee into the
e+e−e+e− final state which includes the photon
conver-sion probability. Table III summarizes the result of our π0 → e+ e−e+ e− and η → e+ e−e+ e− event simulations showing in particular that the total detection efficiencies are of order 10−7 – 10−6.
Systematic errors on the simulated efficiencies result from the uncertainties on the conversion probabilities (5% on Pconv, 7.5% on BReeee), on the branching ratios
of the contributing decays (1% on BReeee for π0 and 2%
for η, from [27]), and on the detector and reconstruction efficiencies (10%, from a comparison of various simulated and measured observables in the HADES detector [26]). Combining all of these contributions we assign to the to-tal efficiency a conservative systematic error of 15%.
The transverse momentum (p⊥) dependence of the
me-son reconstruction efficiency is depicted in Fig. 2, with and without the photon conversion probability included. The cutoff of the π0 efficiency at p
⊥ <∼ 0.35 GeV/c is
caused mostly by the strong bending of low-momentum tracks, i.e. those with p < 0.1 GeV/c, in the HADES magnetic field. Because of the large mass of the eta me-son, its efficiency is much less afflicted by low-momentum tracks and consequently reconstruction is possible down to zero p⊥.
IV. MESON YIELDS
A. Negative pions
As pointed out above, besides measuring e+ and e−,
the HADES detector also provides high-quality data on charged hadrons. Here we use the concurrently mea-sured negative pions [25] to validate the reconstructed π0
yields and extrapolate them to p⊥ < 0.35 GeV/c.
Figure 3 shows efficiency-corrected1 double differential
1The π−yields are corrected as well for the gaps caused in the
lab
y
0 1 2[GeV/c]
p
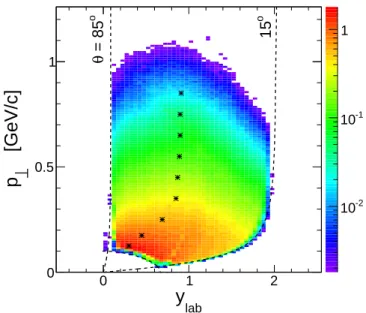
0 0.5 1 -2 10 -1 10 1 o = 85 θ o 15Figure 3: (Color online) Efficiency-corrected d2
N/dy dp⊥
dis-tribution of negative pions detected by HADES in the 3.5 GeV p+Nb reaction. The color scale indicates yield per unit ra-pidity, per GeV, and per minimum-bias event. The dashed lines delineate the geometric acceptance (including a p > 0.12 GeV/c cut), and the stars indicate loci of the maximum of the dN/dy distribution, ymax, as function of transverse
momentum. π− yields d2
N/dy dp⊥ adapted from [25]. The charged
pion acceptance is constrained geometrically to polar an-gles of 15◦ – 85◦ as well as by a momentum cut of
p > 0.12 GeV/c. This results in an acceptance in lab-oratory rapidity of ylab ≃ 0.2 – 1.8 and in transverse
momentum of p⊥ >∼ 0.1 GeV/c. Because of this quite
large coverage one can expect that the extrapolation to full phase space will lead to moderate systematic uncer-tainties only. At a bombarding energy of 3.5 GeV the rapidity of the nucleon-nucleon center-of-mass system is at yN N = 1.12. From the Fig. 3 it is however apparent
that in the p+Nb reaction the pion yield is not peaked at a mid-rapidity yN N but at a lower value with, in addition,
a marked p⊥dependence. Fits of a Gaussian function to
dN/dy projections done for various p⊥ slices give the loci
ymax of the maximum yield vs. p⊥, as shown by stars in
Fig. 3. In particular, low-p⊥ pions seem to be radiated
mostly from a target-like source, near y = 0, pointing to a high degree of stopping of the incoming projectile. Ob-viously not only first-chance nucleon-nucleon collisions contribute to pion emission in the p+Nb reaction, but proton elastic and inelastic rescattering followed by sec-ondary production processes add a soft target-like com-ponent. This is also corroborated by various transport-model calculations [9, 11, 13].
Integrating d2
N/dy dp⊥ within the HADES rapidity
coverage we find an accepted π− yield of 0.50 per LVL1
event. From simulations we know that the LVL1 trig-ger leads to a 42% enhancement of the average detected
charged-pion yield per event (see [25]). Correcting for this trigger bias we obtain an accepted yield of 0.35 per p+Nb reaction. The Gauss fits done to the dN/dy pro-jections provide furthermore a means to extrapolate the measured π− yield outside of the HADES rapidity
cov-erage. Alternatively, transport models, e.g. HSD [8], UrQMD [11], or GiBUU [13] (see Sec. V below), can be used to perform the extrapolation in y and p⊥to full solid
angle. In fact, integrating the yield within the geomet-ric acceptance limits, extrapolating it either way — via Gauss fits to dN/dy projections in p⊥ slices or, better,
with the help of transport calculations done for p+Nb — and correcting for the LVL1 bias we obtain on average a minimum-bias inclusive π− multiplicity of N
π− = 0.60.
The error on this corrected π− multiplicity is dominated
by systematic effects introduced mostly by the correc-tion of the LVL1 trigger bias (±13%) and the spread in the model-dependent extrapolation in phase space (-10%, +15%); statistical errors are however negligible. Table IV lists the extracted multiplicity values and their associated uncertainties.
B. Neutral mesons
We come now to the presentation of our differential π0
and η yields. First notice that the LVL1 trigger (mean-ing at least three charged hits in the TOF wall) does not introduce a bias on events with an e+e−e+e−
signa-ture. Likewise, the LVL2 trigger efficiency is found to be > 99% for such events. Hence no explicit corrections for trigger effects are needed. The systematic uncertainties on the e+
e−e+
e− observables to be taken into account
are those introduced by the efficiency correction (±15%), the CB subtraction (π0
: ±5%, η: ±10%), and the model-dependent extrapolation to full solid angle (π0
: ±15%, η: ±10%).
As is visible from the invariant-mass spectrum in Fig. 1, both neutral mesons can be selected with ap-propriate mass cuts. We have used 0.10 < M < 0.16 for the π0 and 0.46 < M < 0.60 for the η.
Subtract-ing the correspondSubtract-ing combinatorial background and ap-plying corrections for photon conversion, as well as for lepton track identification and reconstruction efficiencies the double-differential yields d2N/dydp
⊥are obtained as
a function of rapidity and transverse momentum. As stated in Sec. III, our efficiency corrections are based on the reconstruction of simulated meson decays embedded into real events. To do a first correction, we started out with relativistic Boltzmann distributions of an assumed temperature of 100 MeV and then refined this value in a second pass. The same holds for the central rapidities of the π0 and η sources which, like in case of the π−,
are observed to be substantially below the yN N = 1.12
value. All corrections were furthermore done concur-rently in two dimensions, y and p⊥, in order to alleviate
any remaining dependence on our assumptions about the meson source characteristics. The resulting final dN/dp⊥
Table IV: Integrated minimum-bias inclusive meson multiplicities per p+Nb collision Nacc, within the accepted rapidity range
0.2 < ylab< 1.8, and N4π, extrapolated to full solid angle. Statistical and systematic uncertainties are given; statistical errors
are negligibly small for π−.
Particle Nacc N4π
π− 0.35 ± 0.05 (sys) 0.60 ± 0.10 (sys)
π0
0.39 ± 0.06 (stat) ± 0.08 (sys) 0.66 ± 0.09 (stat) ± 0.17 (sys) η 0.031 ± 0.002 (stat) ± 0.007 (sys) 0.034 ± 0.002 (stat) ± 0.008 (sys)
[GeV/c]
p
0 0.5 1 1.5]
-1[(GeV/c)
dN/dp
-5 10 -4 10 -3 10 -2 10 -1 10 1π
-oπ
η
fits
< 1.8
lab0.2 < y
Figure 4: (Color online) π0
(full circles), π− (blue
his-togram), and η (open circles) transverse momentum distri-butions dN/dp⊥ per minimum-bias event in 3.5 GeV p+Nb
reactions within the HADES rapidity and momentum accep-tance. The latter leads to a p⊥>∼ 0.35 GeV/c cut for the π0.
Statistical errors are shown as vertical bars, systematic errors as yellow and green shaded boxes. The red solid curves are Boltzmann fits to the π0 and η data (see text for details).
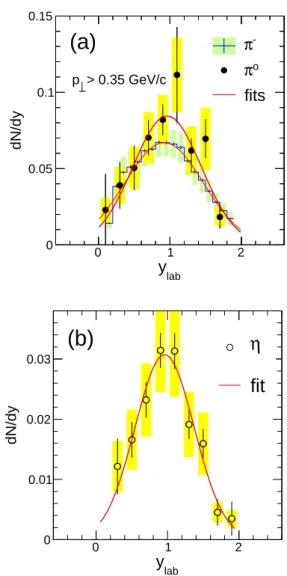
and dN/dy distributions, normalized per minimum-bias event, are displayed in Figs. 4 and 5. For comparison, the negative pion distributions are also shown.
Due to the efficiency cutoff discussed in Sec. III, no π0
yield is detected at low p⊥. This is directly visible in
Fig. 4 and it is also the reason why in Fig. 5 we show both pion rapidity distributions (i.e. π0 and π−) for p
⊥
larger than 0.35 GeV/c only. For the η meson, however, the p⊥ coverage is complete. The rapidity coverage of
both neutral mesons is restricted to ylab = 0.2 – 1.8 by
the detector geometry. In a first attempt to character-ize the observed meson yields we confront them with the isotropic fireball model [30, 31]. Adjusting a Boltzmann
lab
y
0 1 2 dN/dy 0 0.05 0.1 0.15-π
oπ
fits
> 0.35 GeV/c p(a)
laby
0 1 2 dN/dy 0 0.01 0.02 0.03η
fit
(b)
Figure 5: (Color online) (a) π0
(negative pion yield shown as histogram) and (b) η rapidity distributions dN/dy per minimum-bias event in 3.5 GeV p+Nb reactions. Pions are shown for p⊥> 0.35 GeV/c, η in full p⊥ range. Statistical
errors are indicated by vertical bars, systematic errors are de-picted by yellow shaded boxes. Red solid curves are Gauss fits to the data (π0: y
max = 0.94 ± 0.05, σy = 0.48 ± 0.06, χ2 /df = 6.1/6; π−: y max = 0.91 ± 0.01, σy = 0.55 ± 0.02, χ2 /df = 17.2/16; η: ymax = 0.96 ± 0.03, σy = 0.41 ± 0.03, χ2/df = 5.2/6).
]
2[GeV/c
m
0 0.5 1 1.5]
-2)
2[(GeV/c
dm
N/dy
2d
-1m
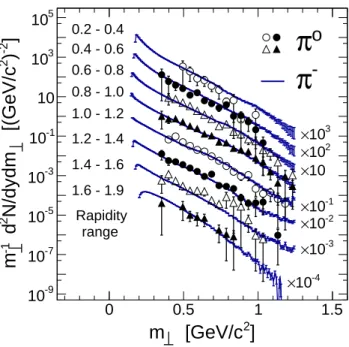
-9 10 -7 10 -5 10 -3 10 -1 10 10 3 10 5 10 0.2 - 0.4 0.4 - 0.6 0.6 - 0.8 0.8 - 1.0 1.0 - 1.2 1.2 - 1.4 1.4 - 1.6 1.6 - 1.9 Rapidity range -4 10 × -3 10 × -2 10 × -1 10 × 10 × 2 10 × 3 10 ×o
π
-π
Figure 6: Transverse mass distributions per minimum-bias event m−1
⊥ dN/dm⊥of measured π−and π0 for the listed
ra-pidity cuts. Error bars are statistical; systematic errors (not shown) on the π−(π0
) yields are ±13% (±19%).
type distribution dN/dp⊥ ∝ p⊥m⊥K1(m⊥/T ) to the
me-son transverse momentum distribution and a Gaussian dN/dy ∝ exp (−0.5(y − ymax)2/σy2) to the rapidity
dis-tribution we find T = 92 ± 3 MeV (χ2/df = 17.4/18),
ymax= 0.94 ±0.05, and σy= 0.48 ±0.06 (χ2/df = 6.1/6)
for the π0
, respectively T = 84 ± 3 MeV (χ2
/df = 14.1/21), ymax = 0.96 ± 0.03, and σy = 0.41 ± 0.03
(χ2/df = 5.2/6) for the η. Here K
1(x) is the
modi-fied Bessel function, m⊥ =pp2⊥+ m2 is the transverse
mass, T is the fitted temperature parameter, ymaxis the
average source mid-rapidity (actually the peak position thereof), and σyis the width of the accepted rapidity
dis-tribution. The fit results show in particular that, within error bars, the rapidity distributions of both pion species agree in shape.
To characterize the pion source further, Fig. 6 shows the pion transverse-mass distributions m−1⊥ dN/dm⊥
projected for various rapidity selections. It is apparent from this figure, and also Fig. 4, that a Boltzmann source does not describe very well the low-p⊥behavior. On the
other hand, both pion species display in general a very similar behavior as function of m⊥ and y. Only in the
first rapidity bin (ylab=0.2 – 0.4) the π− show a
some-what harder spectrum than the π0, which we attribute to
a contamination of the π− spectrum at small polar
an-gles with fake tracks. We prefer, still, to use directly the
shape of the measured negative pion distribution2for
ex-trapolating the π0 yield below 0.35 GeV/c. Doing this,
we get a yield per minimum-bias event of Nπ0 = 0.39
within the accepted rapidity range of 0.2 < ylab < 1.8.
In a second step the extrapolation to full solid angle can be done, based on transport-model calculations as dis-cussed above, giving a minimum-bias inclusive multiplic-ity of Nπ0 = 0.66. Statistical and systematic error bars
on those results are given in Table IV.
For the eta meson, being four times heavier than the pion, the HADES detector provides complete transverse-momentum coverage. The rapidity coverage, although restricted to ylab= 0.2 – 1.8, is very large too. Figures 4
and 5 show that the η phase space distribution is well de-scribed by a Boltzmann fit in transverse momentum and by a Gaussian in rapidity. The latter fit yields a width σy, which can be related [31] to the longitudinal
tem-perature parameter Tkof the eta source via the relation
σy =pTk/Mη. From σy = 0.41 ± 0.03 and Mη = 0.548
one obtains Tk = 92 ± 13 MeV which is within error
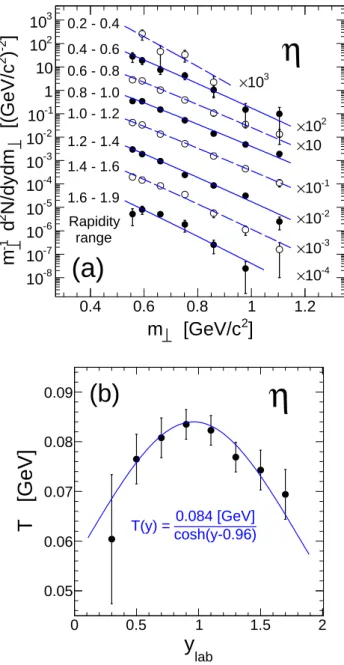
bars still consistent with the transverse temperature pa-rameter obtained from the above Boltzmann fit, namely T = T⊥= 84 MeV. Finally, Fig. 7 shows Boltzmann fits
to the η transverse mass distributions m−1
⊥ dN/dm⊥ for
various rapidity selections, as well as the evolution with rapidity of the fitted slope parameter, T (y). All of those are compatible with the assumption of an isotropic fire-ball: the m⊥ distributions are thermal with their slope
varying like T⊥/ cosh (y − ymax) where T⊥ is taken from
the previous Boltzmann fit to dN/dp⊥ and ymax is the
central rapidity obtained in the above Gauss fit to dN/dy. Integrating either of the dN/dy or dN/dp⊥
distribu-tions we obtain a yield of 0.031 accepted eta per reaction and, extrapolating with the help of our fireball fits to full solid angle, an inclusive multiplicity of Nη = 0.034.
Extrapolations based on transport models yield slightly larger values (see Sec. V). This is taken into account in the systematic uncertainties listed in Table IV.
Having available differential yields of both pions and etas from the same reaction, we can compare their scal-ing with transverse mass. So-called m⊥-scaling has
in-deed been found previously for π0
and η production in 1 and 1.5 GeV/u Ar+Ca collisions [32]. The obser-vation was that the production cross sections at mid-rapidity of different mesons are identical at a given m⊥
value. Model calculations have been able to reproduce this phenomenon [33, 34]. According to [33], in partic-ular, proton-nucleus collisions should display m⊥-scaling
as well. In Fig. 8(a) we show, therefore, an overlay of our pion and eta m⊥ distributions for a few broad
ra-pidity bins. We have chosen here the m−2⊥ dN/dm⊥
representation, (i) because this form represents a
Boltz-2 To do this the π−spectrum was first corrected for its Coulomb
shift EC= −1.44(ZN b+ 1)/RN b = −12 MeV, where ZN b= 41
]
2[GeV/c
m
0.4 0.6 0.8 1 1.2]
-2)
2[(GeV/c
dm
N/dy
2d
-1m
-8 10 -7 10 -6 10 -5 10 -4 10 -3 10 -2 10 -1 10 1 10 2 10 3 10 0.2 - 0.4 0.4 - 0.6 0.6 - 0.8 0.8 - 1.0 1.0 - 1.2 1.2 - 1.4 1.4 - 1.6 1.6 - 1.9 Rapidity range -4 10 × -3 10 × -2 10 × -1 10 × 10 × 2 10 × 3 10 ×η
(a)
laby
0 0.5 1 1.5 2T
[
G
e
V
]
0.05 0.06 0.07 0.08 0.09 cosh(y-0.96) 0.084 [GeV] T(y) =η
(b)
Figure 7: (a) Transverse mass distributions per minimum-bias event m−1
⊥ dN/dm⊥of reconstructed eta mesons for the listed
rapidity cuts. The data points have been corrected for their shift within the rather large m⊥ bins. Error bars shown are
statistical only; systematic errors (not shown) on the yields are 21%. The curves are exponential fits to the data. (b) Resulting slope parameters T (y) shown as function of the ra-pidity. The solid curve corresponds to a thermal source of temperature T = 84 MeV and central rapidity ymax= 0.96.
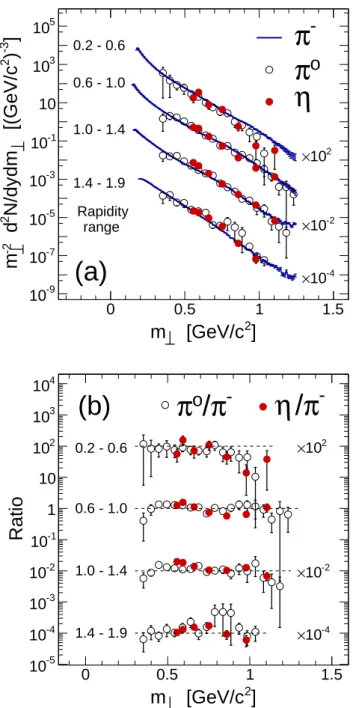
mann source as approximate exponential function, and (ii) because it is particularly well suited for visualizing m⊥-scaling. Despite slight differences in slope —
consis-tent with the temperature parameters obtained from the Boltzmann fits discussed above — an overall good agree-ment of the π0
and η yields at m⊥ > Mη is apparent.
The π− yields follow the m
⊥-scaling as well, except at
low rapidities. As we discussed already in the context of Fig. 6, we attribute this deviation to a contamination of
fake tracks in the π−spectrum. The same trends are
vis-ible in panel (b) of Fig. 8 which shows ratios of the meson yields, namely π0/π− and η/π−. Except for part of the
low-rapidity bin, the ratios are compatible with unity at transverse masses above Mη. We conclude that, albeit
the pion spectra do not follow Boltzmann distributions at low transverse momentum, m⊥-scaling seems to hold.
This finding suggests that the meson yields are deter-mined mostly by phase space: Although we can assume that meson production is mediated mostly by baryon res-onance excitation, it does not matter whether one pro-duces an eta meson at low momentum or a pion at high momentum, as long as their transverse mass is the same. Finally, we want to point out that the extrapolated meson multiplicities can be transformed into a produc-tion cross secproduc-tion by multiplicaproduc-tion with the total re-action cross section, σreac. Parameterizations of the
proton-nucleus absorption cross section as function of bombarding energy do exist [35–37] and they suggest for p(3.5 GeV)+Nb values of σreac ranging from 990 mb
(ref. [36]) to 1060 mb (ref. [37]). The comparison of π−
multiplicities measured with HADES and interpolated HARP π− cross sections [16] yields a compatible value
of σreac= 848 ± 126 mb [25].
V. COMPARISON WITH TRANSPORT
MODELS
Our observation that the rapidity distributions mea-sured in the asymmetric p+Nb system are centered at values ymax< yN N strongly suggests that, beyond
first-chance nucleon-nucleon collisions, secondary reactions, i.e. processes involving multiple successive interactions of baryons and/or mesons contribute sizably to particle production. A similar behavior had already been noticed for kaon production in a previous study of p+Au col-lisions at comparable bombarding energies [38]. While the observed phase space population of the eta agrees quite well with a fireball description, this is questionable for the pion. Complete thermalization is apparently not reached in the p+Nb reaction and a transport-theoretical approach is required to model the complex interplay be-tween reaction dynamics and particle production. Trans-port models typically handle meson and baryon produc-tion at energies up to a few GeV by resonance excitaproduc-tion and at higher energies through string fragmentation. In that respect, our beam energy is particularly challenging because it is situated in the transition region between these two regimes.
In the following we compare our results with three transport calculations done with either UrQMD, the Ul-trarelativistic Quantum Molecular Dynamics model (ver-sion v3.3p1, see [11]), GiBUU, the Giessen Boltzmann-Uehling-Uhlenbeck model (version 1.5, see [13]), or HSD, the Hadron String Dynamics model (version 2.7, see [9]). At 3.5 GeV bombarding energy, corresponding to√sN N
]
2[GeV/c
m
0 0.5 1 1.5]
-3)
2[(GeV/c
dm
N/dy
2d
-2m
-9 10 -7 10 -5 10 -3 10 -1 10 10 3 10 5 10 0.2 - 0.6 0.6 - 1.0 1.0 - 1.4 1.4 - 1.9 Rapidity range(a)
-4 10 × -2 10 × 2 10 ×-π
o
π
η
]
2[GeV/c
m
0 0.5 1 1.5Ratio
-5 10 -4 10 -3 10 -2 10 -1 10 1 10 2 10 3 10 4 10 0.2 - 0.6 0.6 - 1.0 1.0 - 1.4 1.4 - 1.9(b)
-4 10 × -2 10 × 2 10 ×-π
/
o
π
π
-/
η
Figure 8: (Color online) (a) Illustration of meson m⊥
-scaling in 3.5 GeV p+Nb reactions by superimposing the reconstructed pion and eta transverse mass distributions, m−2
⊥ dN/dm⊥. A bin-shift correction has been applied to the
η data points. Four rapidity selections are shown; error bars are statistical only. (b) Yield ratios, π0
over π−and η over
π−, as function of m
⊥for the same rapidity selections.
whereas HSD switches over to string fragmentation mode at √sN N = 2.6 GeV. For GiBUU, on the other hand,
we present calculations done with two different realiza-tions of this model: (i) the original implementation with a smooth transition to string fragmentation at √sN N =
2.6 GeV and (ii) a version (denoted hereafter by “ext. res.”) where the resonance region has been extended up
to about√sN N = 3.5 GeV [13].
Table V: Transport-model calculations of minimum-bias in-clusive meson multiplicities per p+Nb collision, Nπ0 and Nη,
within the accepted rapidity range (0.2 < ylab< 1.8) as well
as in the full solid angle (4π).
Nπ0 Nη
Model 0.2 < y < 1.8 4π 0.2 < y < 1.8 4π
UrQMD v3.3p1 0.38 0.66 0.013 0.016
HSD v2.7 0.38 0.69 0.028 0.038
GiBUU v1.5 0.39 0.64 0.039 0.046
GiBUU ext res 0.32 0.49 0.031 0.034
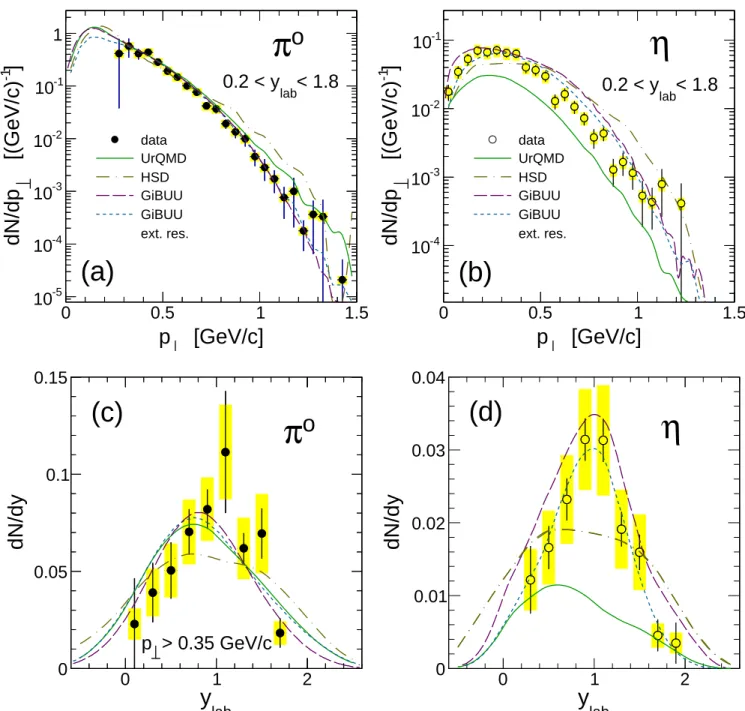
Figure 9, panels (a) and (b), shows that π0
produc-tion is fairly well described by all models, and this in both observables p⊥ and y, within the HADES rapidity
and transverse momentum acceptance. The pion yields reconstructed in the rapidity range ylab = 0.2 – 1.8 are
in fact reproduced to within 10-25% (cf. Table IV vs. Table V). The rapidity distributions of all models are very similar with a slight tendency of being shifted to-wards target rapidity. Differences between the various calculations are mostly visible for p⊥ < 0.3 GeV/c and
for p⊥ > 1 GeV/c. Notice also that at low p⊥ the
stan-dard implementation of GiBUU behaves more in line with UrQMD than the one with an extended resonance region. This is somewhat surprising as one would rather expect that this modification of GiBUU increases the similarity of the two models.
Comparing next in Fig. 9, panels (c) and (d), the calculated and measured η distributions, larger discrep-ancies between the models do appear. While UrQMD reproduces quite well the dN/dp⊥ shape, it
underesti-mates the accepted yield by a factor of 2–3 and also misses the dN/dy shape. Both versions of GiBUU, on the other hand, do fairly well in describing the η rapid-ity distribution and integrated yield (see Table V), and its extended-resonance implementation also possesses the correct transverse-momentum behavior. The HSD pion and eta yields, finally, do agree fairly well with the data, albeit their y and p⊥ distributions deviate substantially.
The complete lack of data in the energy range discussed here probably explains why the models tend to perform worse for η production than they do for pions. We are confident that with the help of our new results a more de-tailed theoretical investigation of the relevant production processes will now be possible.
VI. SUMMARY
To summarize, we have presented data on inclusive pion and eta production in the reaction p+Nb at 3.5 GeV kinetic beam energy. In this study we have used the
[GeV/c]
p
0
0.5
1
1.5
]
-1[(GeV/c)
dN/dp
-510
-410
-310
-210
-110
1
π
o
< 1.8
lab0.2 < y
(a)
data UrQMD HSD GiBUU GiBUU ext. res.[GeV/c]
p
0
0.5
1
1.5
]
-1[(GeV/c)
dN/dp
-410
-310
-210
-110
data UrQMD HSD GiBUU GiBUU ext. res.< 1.8
lab0.2 < y
η
(b)
laby
0
1
2
dN/dy
0
0.05
0.1
0.15
o
π
> 0.35 GeV/c
p
(c)
laby
0
1
2
dN/dy
0
0.01
0.02
0.03
0.04
η
(d)
Figure 9: (Color online) (a) π0
and (b) η transverse momentum distributions dN/dp⊥ per minimum-bias event in 3.5 GeV
p+Nb reactions (symbols) compared to results of the UrQMD, HSD, and GiBUU transport models. For the latter one, also the extended-resonance implementation is shown (see text). All error bars are as in Fig. 4. (c) π0
(with p⊥> 0.35 GeV/c) and
(d) η rapidity distributions dN/dy per minimum-bias event compared to transport calculations. The meaning of the lines is as in (a) and (b), error bars are as in Fig. 5.
photon-conversion method to detect and reconstruct neu-tral mesons from 4-lepton final states. We have demon-strated that with HADES quantitative results on differ-ential π0and η yields can be obtained over a large range
of transverse momentum and rapidity. Our data pro-vide valuable new input for the theoretical description of proton-nucleus and nucleus-nucleus collisions in the few-GeV energy regime with respect to both meson
dy-namics and dilepton emission. This is exemplified in our comparison with a selection of available transport mod-els revealing an overall fair to good agreement in various observables. Together with our previous studies of p+p reactions [1, 2], the present results provide the required baseline for measurements with heavy-ion beams at the future FAIR facility. Indeed, as its central component — the SIS100 accelerator — is designed to provide intense
beams of even the heaviest ions up to 8 GeV/u, we will be in the position to isolate unambiguously those effects induced by the hot and dense baryonic medium.
Acknowledgments
We thank E. Bratkovskaya and J. Weil for pro-viding us with their latest HSD, respectively GiBUU, transport calculations. The HADES Collaboration
gratefully acknowledges the support by BMBF grants 06DR9059D, 05P12CRGHE, 06FY171, 06MT238 T5, and 06MT9156 TP5, by HGF VH-NG-330, by DFG EClust 153, by GSI TMKRUE, by the Hessian LOEWE initiative through HIC for FAIR (Germany), by EMMI GSI, by grant GA CR 13-067595 (Czech Rep.), by grant NN202198639 (Poland), by grant UCY-10.3.11.12 (Cyprus), by CNRS/IN2P3 (France), by INFN (Italy), and by EU contracts RII3-CT-2005-515876 and HP2 227431.
[1] G. Agakishiev et al. (HADES Collaboration), Phys. Rev. C 85, 054005 (2012).
[2] G. Agakishiev et al. (HADES Collaboration), Eur. Phys. J. A 48, 64 (2012).
[3] G. Agakishiev et al. (HADES Collaboration), Phys. Lett. B 715, 304 (2012).
[4] G. Agakishiev et al. (HADES Collaboration), Phys. Rev. C 84, 014902 (2011).
[5] S. Leupold, V. Metag, and U. Mosel, Int. J. Mod. Phys. E 19, 147 (2010).
[6] R. S. Hayano and T. Hatsuda, Rev. Mod. Phys. 82, 2949, (2010).
[7] R. Rapp and E. V. Shuryak, Phys. Lett. B 473, 13 (2000); K. Gallmeister, B. K¨ampfer, and O. P. Pavlenko, Phys. Rev. C 62, 057901 (2000).
[8] E. L. Bratkovskaya and W. Cassing, Nucl. Phys. A 807, 214 (2008).
[9] E. L. Bratkovskaya et al., arXiv:1301.0786v3 [nucl-th], to appear in Phys. Rev. C.
[10] S. A. Bass et al., Prog. Part. Nucl. Phys. 41, 225 (1998). [11] K. Schmidt et al., Phys. Rev. C 79, 064908 (2009). [12] O. Buss et al., Phys. Rep. 512, 1 (2012).
[13] J. Weil et al., Eur. Phys. J. A 48, 111 (2012). [14] S. Nagamiya et al., Phys. Rev. C 24, 971 (1981). [15] N. J. DiGiacomo et al., Phys. Rev. C 31, 292 (1985). [16] A. Bolshakova et al., Eur. Phys. J. C 62, 293 (2009); 63,
549 (2009); 64, 181 (2009); 66, 57 (2009);
[17] E. Chiavassa et al., Europhys. Lett. 41, 365 (1998). [18] V. Koreshev et al. (E672 and E706 Collaborations),
Phys. Rev. Lett 77, 4294 (1996).
[19] T. Alexopoulos et al. (E771 Collaboration), Phys. Rev. D 62, 032006 (2000).
[20] A. Abulencia et al. (CDF Collaboration), Phys. Rev. Lett. 98, 232001 (2007).
[21] G. Aad et al. (ATLAS Collaboration), Phys. Rel. Lett. 108, 152001 (2012).
[22] S, Chatrchyan et al. (CMS Collaboration), Eur. Phys. J.
C 72, 2251 (2012).
[23] T. Dahms et al. (PHENIX Collaboration), Eur. Phys. J. C 49, 249 (2007).
[24] K. Koch et al. (ALICE Collaboration), Nucl. Phys. A 855, 281 (2011).
[25] P. Tlusty et al. (HADES Collaboration), Proceeding of the 50th International Winter Meeting on Nuclear Physics, Bormio (Italy) 2012, PoS (Bormio2012), 019. [26] G. Agakishiev et al. (HADES Collaboration), Eur. Phys.
J. A 41, 243 (2009).
[27] J. Behringer et al. (Particle Data Group), Phys. Rev. D 86, 010001 (2012).
[28] I. Fr¨ohlich et al., Proceedings of the 11th Interna-tional Workshop on Advanced Computing and Analy-sis Techniques, Amsterdam (The Netherlands) 2007, PoS (ACAT) 076.
[29] GEANT 3.21, Detector description and simulation tool, CERN long writeup W5013 (1993).
[30] R. Hagedorn, Rivista del Nuovo Cimento 6, 1 (1983). [31] E. Schnedermann, J. Sollfrank, and U. Heinz, Phys. Rev.
C 48, 2462 (1993).
[32] F. D. Berg et al. (TAPS collaboration), Phys. Rev. Lett. 72, 977 (1994).
[33] K. K. Gudima, M. Ploszajczak, V. D. Toneev, Phys. Lett. B 328, 249 (1994).
[34] E. L. Bratkovskaya, W. Cassing, and U. Mosel, Phys. Lett. B 424, 244 (1998).
[35] L. Sihver, C. H. Tsao, R. Silberberg, T. Kanai, and A. F. Barghouty, Phys. Rev. C 47, 1225 (1993).
[36] R. K. Tripathi, F. A. Cucinotta, and J. W. Wilson, Nucl. Instr. Meth. Phys. Res. B 117, 347 (1996).
[37] H. P. Wellisch and D. Axen, Phys. Rev. C 54, 1329 (1996).
[38] W. Scheinast et al. (KaoS Collaboration), Phys. Rev. Lett. 96, 072301 (2006).