HESSD
11, 9067–9112, 2014Satellite-driven downscaling of global reanalysis
precipitation products
H. Seyyedi et al.
Title Page
Abstract Introduction
Conclusions References
Tables Figures
◭ ◮
◭ ◮
Back Close
Full Screen / Esc
Printer-friendly Version
Interactive Discussion
Discussion
P
a
per
|
Discus
sion
P
a
per
|
Discussion
P
a
per
|
Discussion
P
a
per
|
Hydrol. Earth Syst. Sci. Discuss., 11, 9067–9112, 2014 www.hydrol-earth-syst-sci-discuss.net/11/9067/2014/ doi:10.5194/hessd-11-9067-2014
© Author(s) 2014. CC Attribution 3.0 License.
This discussion paper is/has been under review for the journal Hydrology and Earth System Sciences (HESS). Please refer to the corresponding final paper in HESS if available.
Satellite-driven downscaling of global
reanalysis precipitation products for
hydrological applications
H. Seyyedi1, E. N. Anagnostou1, E. Beighley2, and J. McCollum3
1
Department of Civil and Environmental Engineering, University of Connecticut, Storrs, CT, USA
2
Department of Civil and Environmental Engineering, Northeastern University, Boston, MA, USA
3
Center for Property Risk Solutions, FM Global, Research Division, Norwood, MA 02062-9102, USA
Received: 26 May 2014 – Accepted: 11 July 2014 – Published: 31 July 2014
Correspondence to: E. N. Anagnostou ([email protected])
HESSD
11, 9067–9112, 2014Satellite-driven downscaling of global reanalysis
precipitation products
H. Seyyedi et al.
Title Page
Abstract Introduction
Conclusions References
Tables Figures
◭ ◮
◭ ◮
Back Close
Full Screen / Esc
Printer-friendly Version
Interactive Discussion
Discussion
P
a
per
|
Discus
sion
P
a
per
|
Discussion
P
a
per
|
Discussion
P
a
per
|
Abstract
Deriving flood hazard maps for ungauged basins typically requires simulating a long record of annual maximum discharges. To improve this approach, precipitation from global reanalysis systems must be downscaled to a spatial and temporal resolution applicable for flood modeling. This study evaluates such downscaling and error correc-5
tion approaches for improving hydrologic applications using a combination of NASA’s Global Land Data Assimilation System (GLDAS) precipitation dataset and a higher res-olution multi-satellite precipitation product (TRMM). The study focuses on 437 flood-inducing storm events that occurred over a period of ten years (2002–2011) in the Susquehanna River basin located in the northeast US. A validation strategy was de-10
vised for assessing error metrics in rainfall and simulated runoff as function of basin
area, storm severity and season. The WSR-88D gauge-adjusted radar-rainfall (stage IV) product was used as the reference rainfall dataset, while runoffsimulations forced
with the stage IV precipitation dataset were considered as the runoff reference.
Re-sults show that the generated rainfall ensembles from the downscaled reanalysis prod-15
ucts encapsulate the reference rainfall. The statistical analysis, including frequency and quantile plots plus mean relative error and root mean square error statistics, demon-strated improvements in the precipitation and runoff simulation error statistics of the
satellite-driven downscaled reanalysis dataset compared to the original reanalysis pre-cipitation product. Results vary by season and less by basin scale. In the fall season 20
specifically, the downscaled product has three times lower mean relative error than the original product; this ratio increases to four times for the simulated runoffvalues. The
HESSD
11, 9067–9112, 2014Satellite-driven downscaling of global reanalysis
precipitation products
H. Seyyedi et al.
Title Page
Abstract Introduction
Conclusions References
Tables Figures
◭ ◮
◭ ◮
Back Close
Full Screen / Esc
Printer-friendly Version
Interactive Discussion
Discussion
P
a
per
|
Discus
sion
P
a
per
|
Discussion
P
a
per
|
Discussion
P
a
per
|
1 Introduction
Flooding is one of the costliest natural hazards, occurring repeatedly around the globe (Sampson et al., 2014; Hagen and Lu, 2011 among the others). Flood vulnerability analysis provides essential information to support decisions for policy and prepared-ness against catastrophic flood consequences and for quantifying risk for coping with 5
this hazard (Sampson et al., 2014). However, flood frequency maps are not available for most regions around the world (Hagen and Lu, 2011) due to limited economic re-sources to support long-term observations; this results in lack of knowledge and data (e.g., ground based rain gauge measurements). Developing global scale flood maps (Porter and Demeritt, 2012) is of increasing interest in the scientific community with 10
great applicability in the (re)insurance industry. Global gridded precipitation datasets from satellites and reanalysis datasets derived from data assimilation systems are two main sources for deriving global flood hazard maps (Cloke et al., 2013; Kappes et al., 2012).
Global reanalysis products can provide long-term precipitation datasets for fre-15
quency analyses of hydrologic extremes (e.g., floods, droughts). Widely used reanal-ysis products include the JRA-25 (Onogi et al., 2005), ERA-40 (Bosilovich et al., 2008; Uppala et al., 2005), ERA-Interim (Dee et al., 2011), GLDAS (Rodell et al., 2004), and GDAS (Kalnay et al., 1996). These reanalysis products are available at coarse spatial resolution (100 to 250 km2) and suffer from model biases (Gottschalck
20
et al., 2005; Peña-Arancibia et al., 2013). On the other hand, satellite-based rainfall products are associated with relatively higher spatial resolutions (10–25 km2) and im-proved accuracy, but significantly shorter temporal coverage. The most widely used high resolution, near-global, multi-sensor precipitation products include the 8 km/half-hourly National Oceanic and Atmospheric Administration CMORPH dataset (Joyce 25
HESSD
11, 9067–9112, 2014Satellite-driven downscaling of global reanalysis
precipitation products
H. Seyyedi et al.
Title Page
Abstract Introduction
Conclusions References
Tables Figures
◭ ◮
◭ ◮
Back Close
Full Screen / Esc
Printer-friendly Version
Interactive Discussion
Discussion
P
a
per
|
Discus
sion
P
a
per
|
Discussion
P
a
per
|
Discussion
P
a
per
|
Aerospace Exploration Agency GSMaP (Ushio and Kachi, 2009; Kubota et al., 2007), the 25 km 3 h−1 Center for Hydrometeorology and Remote Sensing, University of California-Irvine PERSIANN (Sorooshian et al., 2000), and the 25 km 3 h−1 NASA TRMM3B42 (Huffman et al., 2007). Depending on the algorithm and the purpose of
the product, each dataset utilizes various combinations of information from microwave 5
(MW) and geostationary infrared (IR) sensors.
Characterizing the uncertainty in existing global gridded precipitation products is vi-tal for the purpose of hydrological applications. Syed et al. (2004) have shown that rainfall is responsible for nearly 70–80 % of the variability in the land surface hydrol-ogy. Therefore, precipitation uncertainty would critically affect the predicted variability
10
in hydrologic simulations. Several validation studies have investigated uncertainties re-lated to satellite rainfall remote sensing over diverse geographic and hydro-climatic regimes (Adler et al., 2001; AghaKouchak et al., 2009; Brown, 2006; Dinku et al., 2007; Ebert et al., 2007; Krajewski et al., 2000; McCollum et al., 2002; Seyyedi et al., 2014; Stampoulis et al., 2013; Su et al., 2008; Tang et al., 2010). These studies have 15
shown that the precision of satellite rainfall products depends on precipitation type (e.g., deep convection vs. shallow convection), as well as terrain and climatological factors (AghaKouchak et al., 2011; Demaria et al., 2011; Turk and Miller, 2005; Seyyedi et al., 2014). Gottschalck et al. (2005) evaluated precipitation products from global models, satellite and radar data against ground based gauge measurements over CONUS for 20
a period of 14 months. They demonstrated that some of the reanalysis precipitation products (ECMWF, GEOS and GDAS) can generally perform better than satellite pre-cipitation datasets (TRMM3B42RT and PERSIANN). Peña-Arancibia et al. (2013) as-sessed daily detection and accuracy metrics for reanalysis and satellite precipitation datasets against gauge data. They argued that no product could demonstrate supe-25
HESSD
11, 9067–9112, 2014Satellite-driven downscaling of global reanalysis
precipitation products
H. Seyyedi et al.
Title Page
Abstract Introduction
Conclusions References
Tables Figures
◭ ◮
◭ ◮
Back Close
Full Screen / Esc
Printer-friendly Version
Interactive Discussion
Discussion
P
a
per
|
Discus
sion
P
a
per
|
Discussion
P
a
per
|
Discussion
P
a
per
|
datasets (including satellite and reanalysis) is expected to perform better than any sin-gle product, especially for hydrological applications.
Substantial efforts have been devoted to assessing the feasibility of utilizing
global-scale precipitation datasets derived from satellite or models on land surface hydrolog-ical modeling (Behrangi et al., 2011; Beighley et al., 2011; Hong et al., 2007, 2006; 5
Hossain and Anagnostou, 2004, 2005; Nijssen and Lettenmaier, 2004; Su et al., 2008; Bitew and Gebremichael, 2011). Some of these studies have highlighted the effect of
product resolution (Gourley et al., 2011) and catchment size (Vergara et al., 2013) on the precipitation error propagation in hydrological simulations. Seyyedi et al. (2014) have recently utilized gridded precipitation datasets from TRMM3B42V7 (25 km, 3 h) 10
and GLDAS reanalysis (100 km, 3 h) to conduct a more in depth assessment of the effect of resolution and data type (satellite vs. reanalysis product) on streamflow
sim-ulations at sub-daily scale. The study was based on a multi-year (2002–2011) and multi-scale approach considering 1006 sub-basins (36–71 000 km2) of the Susque-hanna River basin in the northeast US. They demonstrated that statistical scores in 15
both rainfall and runoffsimulations improve with increasing basin size. However, the
satellite dataset (TRMM3B42V7) was shown to perform significantly better than the re-analysis (GLDAS) in the simulated runoffvalues. The mean relative error in runoff
sim-ulations based on GLDAS was up to seven times higher than that of TRMM3B42V7, which was attributed to the product resolution and associated underestimation of heavy 20
precipitation. Results from that study suggest the use of downscaling and error correc-tion for the GLDAS reanalysis precipitacorrec-tion dataset before implementing it for runoff
simulations. Bastola and Misra (2014) have also evaluated two reanalysis precipitation datasets (ERA-40 and NCEP-R2) for hydrologic simulations over 28 small to midsize basins in southeastern US. Their results demonstrated that ER-40 tends to underes-25
HESSD
11, 9067–9112, 2014Satellite-driven downscaling of global reanalysis
precipitation products
H. Seyyedi et al.
Title Page
Abstract Introduction
Conclusions References
Tables Figures
◭ ◮
◭ ◮
Back Close
Full Screen / Esc
Printer-friendly Version
Interactive Discussion
Discussion
P
a
per
|
Discus
sion
P
a
per
|
Discussion
P
a
per
|
Discussion
P
a
per
|
The critical role of high resolution gridded rainfall datasets for hydrological simula-tions has led to the development of several rainfall disaggregation algorithms (Brussolo et al., 2008; Ferraris et al., 2003; Fowler et al., 2007; Frei et al., 2006; Maraun et al., 2010; Ning et al., 2011; Park, 2013; Rahman et al., 2009; Ramírez et al., 2006; Tao and Barros, 2010, among others). The main assumption for some recently developed 5
downscaling methods for satellite based products is the relationship between spatial variability of rainfall and environmental factors such as topography and land surface conditions. Immerzeel et al. (2009) improved average annual TRMM3B43 from 25 km to 1 km grid resolution by establishing an exponential relationship between TRMM3B43 and Normalized Difference Vegetation Index (NDVI). Jia et al. (2011) developed a
sta-10
tistical downscaling scheme based on the relationship between rainfall, terrain eleva-tion and NDVI. They disaggregated TRMM3B43 from 25 km to 1 km grid resolueleva-tion by forming a multiple linear regression model between parameters. The final prod-ucts of both aforementioned methods are mean annual rainfall values. Duethmann et al. (2013) downscaled ERA-40 with a horizontal resolution of 100 km to 12 km grid 15
size using RCM Weather Research and Forecasting Model (WRF) over central Asia for hydrological modeling. The downscaled data exhibited significant modeling improve-ment. Haas and Born (2011) introduced a two-step probabilistic downscaling method for disaggregating ERA-Interim using ground based gauge data over a complex ter-rain in Southeastern Morocco. The technique is a combination of CDF transformation 20
based on probability mapping and a multi linear regression model to extrapolate obser-vation data to a high resolution grid using DEM data. The resulting downscaled high resolution precipitation data substantially outperformed the original ERA-Interim data. Although downscaling is a widely studied topic, no studies have implemented satel-lite precipitation datasets for downscaling reanalysis precipitation datasets. Moreover, 25
most downscaling schemes for reanalysis datasets are in the context of regional cli-mate focusing on producing consistent statistics for downscaled precipitation values and corresponding generated runoff. This work examines the value of satellite data for
HESSD
11, 9067–9112, 2014Satellite-driven downscaling of global reanalysis
precipitation products
H. Seyyedi et al.
Title Page
Abstract Introduction
Conclusions References
Tables Figures
◭ ◮
◭ ◮
Back Close
Full Screen / Esc
Printer-friendly Version
Interactive Discussion
Discussion
P
a
per
|
Discus
sion
P
a
per
|
Discussion
P
a
per
|
Discussion
P
a
per
|
flood frequency analysis. The reason for using satellite datasets is that a great deal of effort has been devoted to improving the accuracy and resolution of satellite retrievals,
which is paired with the recent advent of satellite missions on precipitation (Hou et al., 2013). Moreover, satellite products are globally available, which leads to a globally con-sistent downscaling scheme for reanalysis products that can be particularly useful over 5
areas lacking long-term ground based observations.
This study is motivated by the challenges of precipitation applications due to the non-linear error propagation from rainfall to hydrological simulations and the vital need for high resolution and long-term gridded rainfall data for deriving flood frequency statistics and corresponding flood hazards maps. Specifically, we examine the hydrologic impact 10
of using the higher resolution and accuracy quasi-global satellite precipitation product from TRMM3B42V7 to derive finer scale and error-corrected precipitation maps from the GLDAS reanalysis product. The methodology developed for the satellite-driven er-ror correction and downscaling of GLDAS rainfall data is based on a stochastic erer-ror model, which was originally developed for modeling the satellite retrieval uncertainty 15
and its error propagation in hydrological applications (Hossain and Anagnostou, 2004; Maggioni et al., 2012, 2013). The methodology is independent of ground based mea-surements, which makes it applicable over data poor areas of the globe. Since GLDAS and other reanalysis datasets are available over a relatively long period of time (35– 50 years), developing a proper methodology for downscaling and improving the accu-20
racy of these products could lead to a global gridded precipitation data source suitable for global-scale water resources assessment and flood frequency studies.
This paper is organized into six sections. After the introduction, the study area and datasets are described, including the model used for hydrological simulations. The third section introduces the downscaling and error correction scheme, including the exper-25
iment setup and parameter calibration. The fourth section presents the error analysis methodology. The fifth section describes the results of the error analysis in rainfall and simulated runoff values. The conclusions section discusses the main findings of this
HESSD
11, 9067–9112, 2014Satellite-driven downscaling of global reanalysis
precipitation products
H. Seyyedi et al.
Title Page
Abstract Introduction
Conclusions References
Tables Figures
◭ ◮
◭ ◮
Back Close
Full Screen / Esc
Printer-friendly Version
Interactive Discussion
Discussion
P
a
per
|
Discus
sion
P
a
per
|
Discussion
P
a
per
|
Discussion
P
a
per
|
2 Study area, datasets and models
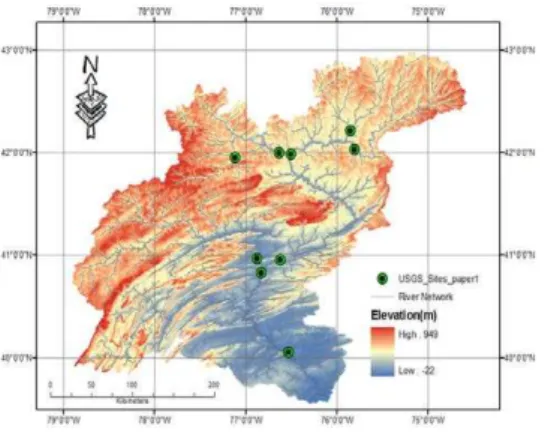
The study area is the Susquehanna River Basin (39 to 43◦N and 75 to 79◦W, Fig. 1) which is the largest basin in the eastern US. The highest peak (949 m a.s.l.) is in the northwestern corner and the lowest point (22 m b.s.l. – below sea level) is in the southeastern corner with a general elevation gradient from north to southeast. The 5
total area of the Susquehanna River Basin is 71 000 km2 of which 76 % is in Penn-sylvania, 23 % in New York, and 1 % in Maryland. The Susquehanna River Basin is subject to major floods occurring once every 14 years with an average annual flood damage on the order of USD 150 million dollars (Susquehanna River Basin Commis-sion, http://www.srbc.net/). Cumulating the drainage areas along the river network at 10
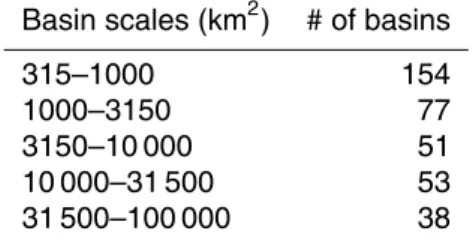
the outlet of each individual catchment provides 373 unique watersheds with drainage areas ranging from 315 to 71 000 km2. The identified sub-basins were divided into five basin size categories (see Table 1) to study the effect of basin scale on the precipitation
and runoffsimulation error.
The study focuses on 437 flood-inducing rainfall events that occurred between 2002 15
and 2011. To investigate the effect of seasonality, the events were grouped by season.
The number of events per season is reported in Table 2. Sixty percent of the events in each season were used for the downscaling model calibration, and the remaining 40 % were kept for determining error statistics (results presented in this study). Figure 2 shows the cumulative probabilities (CDF) of the events randomly selected for inclu-20
sion in the calibration and validation datasets per season. The figure indicates that the probability distributions of calibration and validation rainfall rates are very close to each other, which indicates that the calibration and validation periods have similar statistical properties in terms of rainfall rates. It is noted that the study is based on time-series of catchment average precipitation values from each dataset. Catchment average stands 25
HESSD
11, 9067–9112, 2014Satellite-driven downscaling of global reanalysis
precipitation products
H. Seyyedi et al.
Title Page
Abstract Introduction
Conclusions References
Tables Figures
◭ ◮
◭ ◮
Back Close
Full Screen / Esc
Printer-friendly Version
Interactive Discussion
Discussion
P
a
per
|
Discus
sion
P
a
per
|
Discussion
P
a
per
|
Discussion
P
a
per
|
2.1 Stage IV radar data
The radar based NCEP stage IV precipitation data (Lopez, 2011) are utilized as high accuracy, reference observation data in this study. The data are originally on a 4 km×4 km grid and in polar-stereographic projection. Stage IV combines estimates of precipitation from a network of 150 Doppler NEXRAD (Next Generation Weather 5
Radar) with approximately 5500 hourly rain gauge measurements over the CONUS (Continental US). NEXRAD is technically similar to the Weather Surveillance Radar-1988 Doppler (WSR-88D). The data benefit from the 12 CONUS RFCs (River Forecast Centers) manual quality-control (QC).
2.2 TRMM3B42V7
10
TRMM3B42V7 is a combined microwave-infrared precipitation product (Huffman et al.,
2007) with 25 km spatial resolution and 3 h temporal resolution representing the latest version at the time of this study. The TRMM3B42V7 blending algorithm uses passive microwave (PMW) from TRMMs’ Microwave Imager (TMI) as well as low earth orbit (LEO) measurements from the Special Sensor Microwave/Imager (SSM/I) on the De-15
fense Meteorological Satellite Program (DMSP) satellites, Advanced Microwave Scan-ning Radiometer-Earth Observing System (AMSR) on Aqua, the Advanced Microwave Sounding Unit-B (AMSU-B) on the National Oceanic and Atmospheric Administration (NOAA) satellite series, Microwave Humidity Sounders (MHS) on later NOAA-series satellites, and the European Operational Meteorological (MetOp) satellite (Kidd et al., 20
2011). The TRMM3B42V7 combination scheme is based on the Goddard profiling (GPROF) algorithm (Kidd et al., 2011; Kummerow et al., 2001, 1996; Olson et al., 1999; Wang et al., 2009; Gopalan et al., 2010) for rainfall estimation from PMW imagers (TMI, SSM/I, and AMSR). The PMW calibrated infrared (IR) precipitation products (Janowiak et al., 2001) from Geosynchronous Earth Orbit (GEO) satellites are used to fill in the 25
HESSD
11, 9067–9112, 2014Satellite-driven downscaling of global reanalysis
precipitation products
H. Seyyedi et al.
Title Page
Abstract Introduction
Conclusions References
Tables Figures
◭ ◮
◭ ◮
Back Close
Full Screen / Esc
Printer-friendly Version
Interactive Discussion
Discussion
P
a
per
|
Discus
sion
P
a
per
|
Discussion
P
a
per
|
Discussion
P
a
per
|
uses monthly ground precipitation gauge data extending between 50◦N to 50◦S for bias removal and calibration.
2.3 GLDAS
The reanalysis precipitation dataset is from GLDAS and has 100 km spatial and 3 hourly temporal resolution. The reasons for selecting GLDAS are its global coverage, 5
relatively high temporal resolution and long data record (since 1979). The data are “observation based”, coming from a combination of reanalysis data from the Global Data Assimilation System (GDAS) from the National Center for Environmental Predic-tion (NCEP), NOAA Climate PredicPredic-tion Center’s CMAP (CPC Merged Analysis of Pre-cipitation) precipitation (Xie and Arkin, 1997), and radiation datasets from Air Force’s 10
AGRicultural METeorological modeling system (AGRMET) (Rodell et al., 2004). GDAS assimilates global meteorological observations. CMAP is merged satellite based IR and MW observations with rain gauge analysis. AGRMET radiation fields are satel-lite observation based. GLDAS therefore represents merged, spatially and temporally interpolated fields of GDAS, CMAP, and AGREMET fields.
15
2.4 Hydrologic model simulations
The Hillslope River Routing (HRR) (Beighley et al., 2009, 2011) is the modeling frame-work used in this study. HRR integrates a water balance model for the vertical fluxes and a routing model for the horizontal fluxes of the surface and subsurface runoffand
streamflow. For each model unit, the landscape is approximated as an open book with 20
two planes draining laterally to a main channel. Water and energy balance is used to simulate the vertical fluxes and storages of water in and through the soil layers on each plane. Flow routing is then performed using variants of the kinematic wave method for both the surface and subsurface runofffrom hillslopes, and diffusion wave
HESSD
11, 9067–9112, 2014Satellite-driven downscaling of global reanalysis
precipitation products
H. Seyyedi et al.
Title Page
Abstract Introduction
Conclusions References
Tables Figures
◭ ◮
◭ ◮
Back Close
Full Screen / Esc
Printer-friendly Version
Interactive Discussion
Discussion
P
a
per
|
Discus
sion
P
a
per
|
Discussion
P
a
per
|
Discussion
P
a
per
|
Seyyedi et al. (2014) provided details about the model implementation in the Susque-hanna River Basin and reported model specifications, parameter calibration and perfor-mance results. In addition to the base model parameters (e.g., vertical hydraulic con-ductivity, suction head, and soil depth), three parameters were calibrated in Seyyedi et al. (2014) based on soil and land cover data: horizontal conductivity, Kh, for the 5
subsurface routing, overland flow roughness, N, for surface routing, and Manning’s roughness,n, for channel routing. These parameters are scale dependent in that they capture both the hydraulic features (river reach and hillslope lengths) defined for a given model unit as well as all sub-model unit features not represented at the defined model scale (e.g., all tributaries not explicitly represented in the defined river network). The 10
calibration was performed by systematically adjusting the three parameters (Kh,N,n) to achieve zero mean error (ME, m3s−1) for the annual maximum peak discharges at nine streamflow gauging stations shown in Fig. 1. As reported in Seyyedi et al. (2014), model performance after calibration includes zero mean error for the entire basin, while mean relative errors for individual gauges ranged between−16 to 23 %, and errors for 15
individual events ranged between −62 to 224 %. The largest error is from the gauge draining one of the smallest basin areas (1155 km2) during 2011 Tropical Storm Lee, which caused significant flooding especially in the northern Susquehanna River Basin. Overall, 86 % of the errors are within±50 %, and approximately half are within±25 %.
3 Error correction and downscaling scheme
20
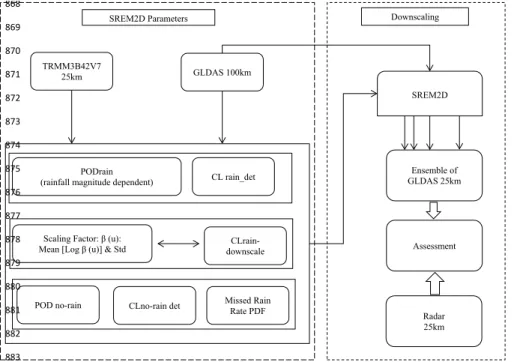
The stochastic space–time error model of Hossain and Anagnostou (2006), originally developed for satellite rainfall error modeling (hereafter named SREM2D), was de-vised in this study to disaggregate and error correct GLDAS precipitation datasets using reference data from the TRMM3B42V7 satellite precipitation product. Specifi-cally, SREM2D was applied on the coarse (100 km) grid resolution GLDAS precipita-25
HESSD
11, 9067–9112, 2014Satellite-driven downscaling of global reanalysis
precipitation products
H. Seyyedi et al.
Title Page
Abstract Introduction
Conclusions References
Tables Figures
◭ ◮
◭ ◮
Back Close
Full Screen / Esc
Printer-friendly Version
Interactive Discussion
Discussion
P
a
per
|
Discus
sion
P
a
per
|
Discussion
P
a
per
|
Discussion
P
a
per
|
and error correction. First SREM2D parameters are determined for each season using TRMM3B42V7 and GLDAS data from the calibration datasets of each season. Then SREM2D was applied to the GLDAS data during the validation period and evaluated against the reference Stage IV gauge adjusted radar-rainfall fields. Details about the SREM2D model are provided in Hossain and Anagnostou (2006), while below we de-5
scribe the model calibration results for the different seasons.
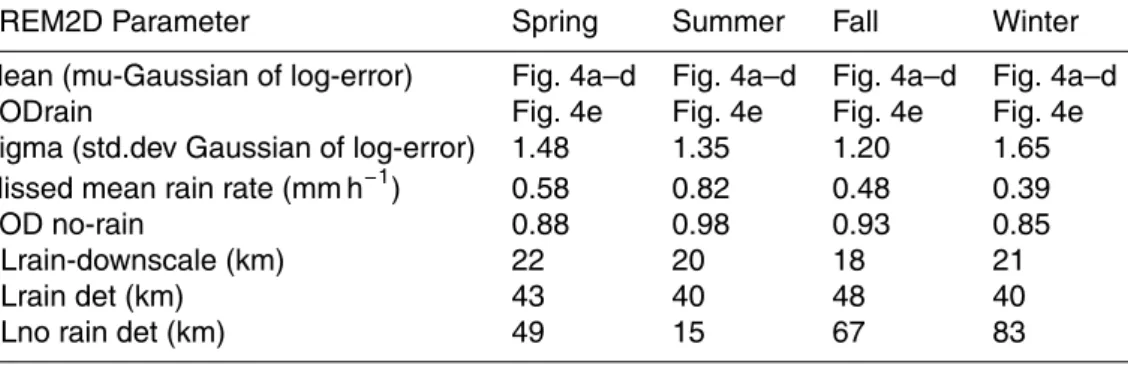
SREM2D parameters calibrated in this study are: (1) probability of rain detection (POD) (see Fig. 4e), (2) mean of the log-transformed multiplicative error, where error is the multiplicative factor “e=Rsensor/Rreference”, this parameter is represented in
2-D spatial fields for each season on Fig. 4a–d, (3) mean value of missed rain rate, 10
(4) probability of no-rain detection (POD no rain), (5) correlation length for the retrieval error (CLret), (6) correlation length for the successful delineation of rain (CLrain det), and (7) correlation length for the successful delineation of no rain (CLno rain det). The calculated values for parameters 3 to 7 are presented in Table 3 for the selected calibration events in each season.
15
In terms of spatial patterns, the correlation lengths of rain detection, no-rain detection and downscaled rain for all seasons are less than 83 km. The lower correlation length indicates lower dependence between variables in space. Regarding the random error, the range of standard deviation of logarithmic multiplicative errors is between 1.2 (fall) and 1.65 (winter). The values represent higher magnitude of variability of error between 20
reference and sensor data in winter relative to the other seasons. The PODno-rain takes its maximum value during the summer season (0.98) while it drops to 0.85 for the winter season. The maximum mean rain rate of non-detected values is 0.82 for the summer; the corresponding value is 0.39 for the winter. Summer events are associated with higher rain rates, which results in higher non-detected rain rates from GLDAS.
25
HESSD
11, 9067–9112, 2014Satellite-driven downscaling of global reanalysis
precipitation products
H. Seyyedi et al.
Title Page
Abstract Introduction
Conclusions References
Tables Figures
◭ ◮
◭ ◮
Back Close
Full Screen / Esc
Printer-friendly Version
Interactive Discussion
Discussion
P
a
per
|
Discus
sion
P
a
per
|
Discussion
P
a
per
|
Discussion
P
a
per
|
of underestimation in the summer is relatively higher than in the other seasons. The probability of rain detection is presented as a function of GLDAS rain rate (Fig. 4e). The summer events exhibit the lowest values whereas fall and spring have higher POD values.
Figure 5 presents the accumulated values based on all validation events for the dif-5
ferent precipitation products and the 20 member SREM2D-generated ensembles of GLDAS downscaled precipitation, depicted by the shadow area on the plot. GLDAS rainfall significantly underestimates the other two precipitation datasets, especially in spring, fall and winter seasons, while the SREM2D-generated ensemble envelops en-capsulate well the TRMM3B42V7 and, in most cases, the ground based reference 10
accumulated rainfall. This indicates that the disaggregated GLDAS precipitation data are in agreement with the TRMM3B42V7 and the corresponding ground based radar rainfall data.
4 Error analysis methodology
The error analysis devised in this study, aimed to demonstrate the degree of improve-15
ment due to downscaling, consists of three main hydrologic components (Fig. 6): ref-erence simulation, observation simulation and downscaled and error corrected simula-tion. Reference simulation is based on generating runoffvalues through forcing HRR
with the reference radar rainfall data. Observation simulation stands for forcing HRR with GLDAS or TRMM3B42V7 at the product resolution. Downscaled and error cor-20
rected simulation refers to forcing HRR with the ensemble mean of the SREM2D-downscaled GLDAS precipitation fields. There are two error analysis steps associ-ated with the three main components: the rainfall error analysis and simulassoci-ated surface runofferror analysis. Each error analysis component consists of three statistical
met-rics: quantile-quantile (Q-Q) plots, mean scale quantile relative error (QRE), and the 25
HESSD
11, 9067–9112, 2014Satellite-driven downscaling of global reanalysis
precipitation products
H. Seyyedi et al.
Title Page
Abstract Introduction
Conclusions References
Tables Figures
◭ ◮
◭ ◮
Back Close
Full Screen / Esc
Printer-friendly Version
Interactive Discussion
Discussion
P
a
per
|
Discus
sion
P
a
per
|
Discussion
P
a
per
|
Discussion
P
a
per
|
The Q-Q plots are used to compare basin-average quantile rainfall and runoffvalues
from the various data sources (GLDAS at 100 km, TRMM3B42 at 25 km, mean GLDAS downscaling ensemble at 25 km) against the reference data source (radar at 4 km). The QRE is defined as the ratio of the sum of differences between reference and sensor
values (precipitation or runoff) to the sum of reference values determined over the
sub-5
basins for each quantile range:
QRE=
Pn i=1 P
s
Sensor|tj ≤Prefs < tj+1
− Prefs |tj≤Prefs < tj+1
Pn i=1
Ps
ref|tj ≤P s
ref< tj+1
(1)
wherePSensors is the sensor “basin averaged” precipitation/runoffvalue,Ps
refis the
refer-ence “basin averaged” precipitation/runoffvalue over the sub-basin,t is the threshold
10
value which is based on the reference data quantiles, j is the quantile index, and n is total number of value in a particular scale and quantile range. The perfect value for this metric is zero, which means there is no difference between reference and the
sen-sor values. Negative QRE value means the sensen-sor is underestimating and the positive value means overestimating.
15
QRMSE is the root mean square of the differences between reference and sensor; it
is normalized to the mean of reference values.
QRMSE=
2 s
1
n n P
i=1
Ps
Sensor|tj ≤P s
ref< tj+1
−Ps
ref|tj ≤P s
ref< tj+1
2
mean Ps
ref|tj ≤P s
ref< tj+1
(2)
wherePSensors is the sensor “basin averaged” precipitation/runoffvalue,Ps
refis the
refer-20
ence “basin averaged” precipitation/runoffvalue over the sub-basin,t is the threshold
HESSD
11, 9067–9112, 2014Satellite-driven downscaling of global reanalysis
precipitation products
H. Seyyedi et al.
Title Page
Abstract Introduction
Conclusions References
Tables Figures
◭ ◮
◭ ◮
Back Close
Full Screen / Esc
Printer-friendly Version
Interactive Discussion
Discussion
P
a
per
|
Discus
sion
P
a
per
|
Discussion
P
a
per
|
Discussion
P
a
per
|
To determine dependence of the error metrics on storm severity, QRE and QRMSE statistics are categorized in two groups according to the quantile values of rainfall and runoff, namely, values between 75th and 90th percentile and greater than the 90th
percentile that represent moderate and extreme events, respectively. To investigate the effect of seasonality and basin scale statistics, Q-Q plots are presented for the four
5
seasons and different basin scales.
5 Results
5.1 Rainfall error analysis
As mentioned above, the rainfall error analysis is divided into two categories: frequency distribution and quantitative statistics. The frequency distribution uses the quantile-10
quantile (Q-Q) plots, and the quantitative statistics include the QRE, and QRMSE error metrics. These are discussed next.
5.1.1 Frequency distribution
To assess the correspondence between sensor and reference rainfall data, we plot-ted the quantile values from TRMM3B42V7, GLDAS and downscaled ensemble-mean 15
GLDAS (sensor) against the corresponding quantile values of the reference radar rain-fall (Fig. 7). In each Q-Q plot the x-axis represents sensor values and the y-axis rep-resents radar values in mm h−1. We show significant changes in the Q-Q plots for the different basin scales (small to large) and seasons.
GLDAS show a systematic underestimation at all seasons and basin scales. The un-20
HESSD
11, 9067–9112, 2014Satellite-driven downscaling of global reanalysis
precipitation products
H. Seyyedi et al.
Title Page
Abstract Introduction
Conclusions References
Tables Figures
◭ ◮
◭ ◮
Back Close
Full Screen / Esc
Printer-friendly Version
Interactive Discussion
Discussion
P
a
per
|
Discus
sion
P
a
per
|
Discussion
P
a
per
|
Discussion
P
a
per
|
exhibit much better agreement with the reference radar rainfall data. The best agree-ment is observed during the fall and summer seasons, while good agreeagree-ment is also depicted during the spring season. The winter season exhibits a strong underestima-tion (overestimaunderestima-tion) of the low (high) quantile values. Overall, the downscaled GLDAS precipitation dataset exhibits similar performance to the TRMM3B42V7 product in the 5
fall, summer and spring seasons, while in the winter, the downscaled GLDAS shows stronger underestimation than TRMM3B42V7 for the low quantile values.
5.1.2 Quantitative statistics
The seasonal variation of the mean relative error and relative root mean square error statistics vs. basin scale for GLDAS, TRMM3B42V7, and the downscaled ensemble-10
mean GLDAS are presented in Figs. 8 and 9, respectively. These statistics are based on precipitation values that exceed the 90th percentile. The main point to note is that no datasets show significant changes with basin scale. In spring the GLDAS is sig-nificantly underestimating while TRMM3B42V7 is almost unbiased, while the down-scaled GLDAS is slightly overestimating for all basin size categories. In summer all 15
datasets are underestimating. The magnitude of underestimation in GLDAS is signifi-cantly higher than that of TRMM3B42V7 or the downscaled ensemble-mean GLDAS. In fall, GLDAS is significantly underestimating while the downscaled ensemble-mean GLDAS is almost unbiased, in contrast to the TRMM3B42V7, which is slightly over-estimating. In winter, GLDAS is underestimating while TRMM3B42V7 and downscaled 20
ensemble-mean GLDAS are overestimating. The magnitude of overestimation in the downscaled ensemble-mean GLDAS is lower than the underestimation in GLDAS. For the random component of precipitation error (relative RMSE), the three precipitation datasets are performing similarly, with scores very close in the summer and fall sea-sons (scores ranging between 0.9 and 1.05). Overall, GLDAS exhibits lower relative 25
RMSE values than the other two precipitation datasets, with this difference becoming
HESSD
11, 9067–9112, 2014Satellite-driven downscaling of global reanalysis
precipitation products
H. Seyyedi et al.
Title Page
Abstract Introduction
Conclusions References
Tables Figures
◭ ◮
◭ ◮
Back Close
Full Screen / Esc
Printer-friendly Version
Interactive Discussion
Discussion
P
a
per
|
Discus
sion
P
a
per
|
Discussion
P
a
per
|
Discussion
P
a
per
|
5.2 Simulated runofferror analysis
Time series of the simulated runoff for the entire basin derived from forcing the
HRR model with GLDAS (observation simulation), TRMM3B42V7 (product simulation), downscaled ensemble-mean GLDAS (downscaled and error corrected simulation), and radar-rainfall data (reference simulation) for the validation data sample of each season 5
are presented in Fig. 10. As shown in the time series plot, GLDAS is systematically underestimating runoffrelative to the other datasets, and particularly during the major
hurricane events in the fall. The downscaled ensemble-mean GLDAS performs signifi-cantly better and is shown to be able to capture the events and the overall flow patterns. In the case of the high flow fall events (associated with two hurricanes), the downscaled 10
ensemble-mean GLDAS simulated runoffseems to be between TRMM3B42V7 and
ref-erence data. Below we discuss quantile-quantile (Q-Q) plots and QRE, and QRMSE error metrics for the runoffsimulations.
5.2.1 Frequency distribution
The quantile-quantile (Q-Q) plots of the simulated runoffvalues from the three datasets
15
(i.e., TRMM3B42V7, GLDAS, and downscaled ensemble-mean GLDAS) against the reference simulations are presented in Fig. 11. Similar to Fig. 7, GLDAS exhibits a strong underestimation of runoff at all seasons and basin scales. The
underesti-mation is shown to the more significant in the fall, spring and winter seasons, while it reduces significantly during the summer events. The ensemble-mean downscaled 20
GLDAS on the other hand exhibits very good agreement with the reference values, particularly during fall and spring seasons. This agreement is very similar to the one exhibited for the TRMM3B42V7 dataset, indicating that downscaling makes GLDAS perform similarly as the corresponding TRMM3B42V7 dataset, which was used in the calibration of the stochastic model parameters.
HESSD
11, 9067–9112, 2014Satellite-driven downscaling of global reanalysis
precipitation products
H. Seyyedi et al.
Title Page
Abstract Introduction
Conclusions References
Tables Figures
◭ ◮
◭ ◮
Back Close
Full Screen / Esc
Printer-friendly Version
Interactive Discussion
Discussion
P
a
per
|
Discus
sion
P
a
per
|
Discussion
P
a
per
|
Discussion
P
a
per
|
5.2.2 Quantitative statistics
Figures 12 and 13 show the two error metrics (QRE and QRMSE) determined for the validation sample reference runoffsimulation values exceeding the 90th percentile
value for the different seasons. As shown in the QRE plots of Fig. 12, GLDAS
un-derestimates significantly in all seasons (Fig. 12). The magnitude of underestimation 5
is the strongest in summer and fall seasons and the lowest in spring season. Win-ter season underestimation reduces with increasing basin scale. The ensemble-mean downscaled GLDAS QRE values exhibit significant bias reduction in runoffsimulations,
particularly in the fall and winter seasons. In spring, the downscaled GLDAS exhibits overestimation, which is still lower in absolute magnitude than the underestimation of 10
the original GLDAS runoffsimulations. The QRE values of the TRMM3B42V7 product
are consistently low, showing a positive bias of<10 %.
For the random error component, downscaling consistently improves the QRMSE statistic at all basin scales and for all seasons. The greatest reduction on QRMSE is in the summer and winter seasons, while spring exhibits the least effect. The satellite
15
product (TRMM3B42V7) shows consistently lower QRMSE values than both GLDAS and downscaled GLDAS products for all basin scales and seasons. The greatest dif-ference is in the summer and fall seasons that are associated with a more organized convective system and a less snow/mixed phase precipitation. Spring season also ex-hibits a slight basin scale dependence on QRMSE for the downscaled GLDAS and 20
TRMM3B42V7 product driven runoff simulations; no significant basin scale
depen-dence is presented for the other seasons or products.
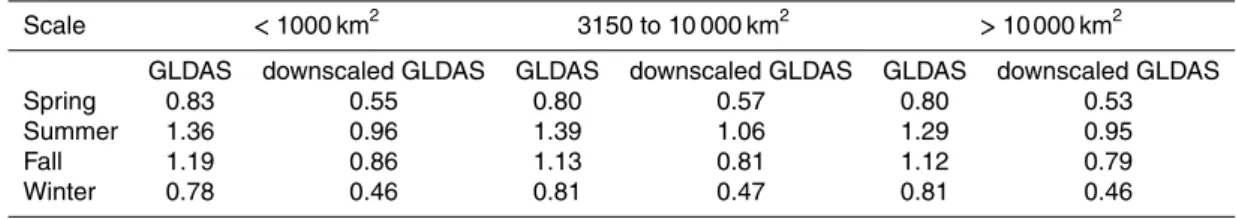
The above findings are in contrast with the increased random error component shown in the downscaled GLDAS precipitation product (Fig. 9). To understand this as-pect, we present in Table 4 the QRMSE ratios between runoffand precipitation (error
25
propagation) for the two products, seasons and basin scales. The downscaled GLDAS exhibits dampening of the random error component from precipitation to runoff
HESSD
11, 9067–9112, 2014Satellite-driven downscaling of global reanalysis
precipitation products
H. Seyyedi et al.
Title Page
Abstract Introduction
Conclusions References
Tables Figures
◭ ◮
◭ ◮
Back Close
Full Screen / Esc
Printer-friendly Version
Interactive Discussion
Discussion
P
a
per
|
Discus
sion
P
a
per
|
Discussion
P
a
per
|
Discussion
P
a
per
|
to season. For example, winter and spring seasons exhibit the strongest dampening of random error (ratios around 0.5), while in the summer the ratio is around one (i.e., no change), and in the fall the ratio is around 0.8 with a slight basin scale depen-dence (i.e., ranging from 0.86 for basins below 1000 km2to 0.79 for basins greater than 10 000 km2). On the other hand, the original GLDAS product shows either an increase 5
in the random error component from precipitation to runoffsimulations during summer
and fall seasons, or a weaker (about half) dampening, compared to the downscaled product, in winter and spring seasons. These differences in precipitation to runoff
er-ror propagation convert the slightly increased random erer-ror of the downscaled GLDAS product in precipitation to a significantly lower random error in runoffsimulations, which
10
is consistent with our aim of improving the hydrologic use of GLDAS products in flood modeling.
6 Conclusions
The aim of the study was to evaluate a stochastic downscaling and error correction approach for improving the use of a global reanalysis precipitation dataset (GLDAS) in 15
flood simulations. GLDAS is available over a relatively long time period (since 1979), which provides a good source of precipitation data for hydrological analyses and global flood hazard mapping. However, it has been shown in Seyyedi et al. (2014) that the res-olution and biases of this product introduce significant runoffsimulation errors, which
limit its applicability for flood modeling. In this study we present a two dimensional 20
stochastic error model (SREM2D) to downscale and adjust GLDAS precipitation data using as reference the higher resolution and accuracy TRMM3B42V7 satellite pre-cipitation product. The study focused on a large basin (Susquehanna River Basin) in the northeast US subjected to 437 rainfall events over a 10 year period (2002–2011), which were grouped in four seasons. The hydrologic simulations were performed with 25
HESSD
11, 9067–9112, 2014Satellite-driven downscaling of global reanalysis
precipitation products
H. Seyyedi et al.
Title Page
Abstract Introduction
Conclusions References
Tables Figures
◭ ◮
◭ ◮
Back Close
Full Screen / Esc
Printer-friendly Version
Interactive Discussion
Discussion
P
a
per
|
Discus
sion
P
a
per
|
Discussion
P
a
per
|
Discussion
P
a
per
|
The improvements from downscaling and adjusting the GLDAS precipitation were evaluated in terms of both rainfall and runoffsimulations using frequency distributions
and quantitative error metrics. The effect of basin scale and seasonality were
consid-ered in this analysis. For the precipitation error analysis, the quantile-quantile plots indicated that GLDAS is meaningfully underestimating for all seasons and all basin 5
scales, while the satellite-driven downscaled GLDAS ensembles reduced significantly that bias, reaching a performance similar to the TRMM3B42V7 precipitation product. This was confirmed by the mean relative error statistic, where downscaled GLDAS shows substantial reduction of the strong underestimation exhibited in the original GLDAS product. The error analysis in simulated runoff values gave similar bias
pat-10
terns as those in the precipitation products. The downscaled ensemble-mean GLDAS product has considerably reduced bias compared to the original GLDAS product. There is a slight basin scale effect on the evaluated statistics, with slightly better runoff
re-sults for larger basin sizes. The random error in the simulated runoffvalues reduces
meaningfully for the downscaled ensemble-mean GLDAS product relative to the orig-15
inal GLDAS. This was explained by the properties of the random error propagation from precipitation to runoffsimulations, where for the original GLDAS the random
er-ror is either increasing (summer and fall seasons) or slightly decreasing (winter and spring). On the other hand, the downscaled GLDAS product showed a remarkable dampening (0.5–0.8) of the random error from precipitation to runoffsimulations. This
20
can be attributed to hydrologic processes (infiltration and runoffgeneration) that can
average out the random precipitation error component of the high-resolution products (e.g., downscaled GLDAS), but make discharge errors worse for the strongly underes-timated GLDAS rainfall rates within the basin.
Overall, results presented in this study indicate that the proposed satellite precipita-25
HESSD
11, 9067–9112, 2014Satellite-driven downscaling of global reanalysis
precipitation products
H. Seyyedi et al.
Title Page
Abstract Introduction
Conclusions References
Tables Figures
◭ ◮
◭ ◮
Back Close
Full Screen / Esc
Printer-friendly Version
Interactive Discussion
Discussion
P
a
per
|
Discus
sion
P
a
per
|
Discussion
P
a
per
|
Discussion
P
a
per
|
limited ground based measurements. Furthermore, the downscaling scheme is modu-lar in design and can be applied to any gridded dataset.
The proposed scheme was demonstrated over northeast US, which is a data rich area. As stated in the study area section, TRMM3B42V7 technique uses regional ground based precipitation measurements from rain gauges to adjust the precipita-5
tion retrieval. Although this approach is consistently applied globally, many areas of the world do not have a gauge density as large as the US network. As argued in studies reported in this paper, rain gauge adjustments in data poor areas may worsen the accu-racy of TRMM3B42V7 product. Therefore, future research should evaluate this scheme on the basis of other satellite products that do not use rain gauge based adjustments to 10
represent more accurately the conditions of data poor areas. Another extension of this research is to apply the SREM2D downscaling scheme on the entire (35 year) record of GLDAS precipitation data to derive multi-year downscaled GLDAS reanalysis ensem-bles, and use them through the hydrologic model of this study to derive flood return periods for the Susquehanna River Basin. Finally, extending the downscaling methodol-15
ogy to GLDAS as well as other reanalysis products, such as ERA-40 and ERA-interim, at the global scale in conjunction with multi-year (1998–2014) high-resolution precipita-tion products from satellite-only techniques (e.g., CMORPH, PERSIANN) would allow derivation of a high accuracy global satellite-driven water resources reanalysis inde-pendent from ground measurements. Such products could be used in many engineer-20
ing and scientific applications, such as flood and drought frequency analyses, design of hydraulic structures, or reservoir design and operation optimization.
HESSD
11, 9067–9112, 2014Satellite-driven downscaling of global reanalysis
precipitation products
H. Seyyedi et al.
Title Page
Abstract Introduction
Conclusions References
Tables Figures
◭ ◮
◭ ◮
Back Close
Full Screen / Esc
Printer-friendly Version
Interactive Discussion
Discussion
P
a
per
|
Discus
sion
P
a
per
|
Discussion
P
a
per
|
Discussion
P
a
per
|
References
Adler, R. F., Kidd, C., Petty, G., Morissey, M., and Goodman, H. M.: Intercomparison of global precipitation products: the Third Precipitation Intercomparison Project (PIP–3), B. Am. Me-teorol. Soc., 82, 1377–1396, doi:10.1175/1520-0477(2001)082<1377:IOGPPT>2.3.CO;2, 2001.
5
AghaKouchak, A., Nasrollahi, N., and Habib, E.: Accounting for uncertainties of the TRMM Satellite Estimates, Remote Sensing, 1, 606–619, 2009.
AghaKouchak, A., Behrangi, A., Sorooshian, S., Hsu, K., and Amitai, E.: Evaluation of satellite-retrieved extreme precipitation rates across the central United States, J. Geophys. Res.-Atmos., 116, D02115, doi:10.1029/2010JD014741, 2011.
10
Bastola, S. and Misra, V.: Evaluation of dynamically downscaled reanalysis precipitation data for hydrological application, Hydrol. Process., 28, 1989–2002, doi:10.1002/hyp.9734, 2014. Behrangi, A., Khakbaz, B., Jaw, T. C., AghaKouchak, A., Hsu, K., and Sorooshian, S.:
Hy-drologic evaluation of satellite precipitation products over a mid-size basin, J. Hydrol., 397, 225–237, doi:10.1016/j.jhydrol.2010.11.043, 2011.
15
Beighley, R. E., Ray, R. L., He, Y., Lee, H., Schaller, L., Andreadis, K. M., Durand, M., Als-dorf, D. E., and Shum, C. K.: Comparing satellite derived precipitation datasets using the Hillslope River Routing (HRR) model in the Congo River Basin, Hydrol. Process., 25, 3216– 3229, doi:10.1002/hyp.8045, 2011.
Bitew, M. M. and Gebremichael, M.: Evaluation of satellite rainfall products through hydro-20
logic simulation in a fully distributed hydrologic model, Water Resour. Res., 47, W06526, doi:10.1029/2010WR009917, 2011.
Bosilovich, M. G., Chen, J., Robertson, F. R., and Adler, R. F.: Evaluation of global precipita-tion in reanalyses, J. Appl. Meteorol. Clim., 47, 2279–2299, doi:10.1175/2008JAMC1921.1, 2008.
25
Brown, J. E. M.: An analysis of the performance of hybrid infrared and microwave satellite precipitation algorithms over India and adjacent regions, Remote Sens. Environ., 101, 63– 81, doi:10.1016/j.rse.2005.12.005, 2006.
Brussolo, E., von Hardenberg, J., Ferraris, L., Rebora, N., and Provenzale, A.: Verification of quantitative precipitation forecasts via stochastic downscaling, J. Hydrometeorol., 9, 1084– 30
HESSD
11, 9067–9112, 2014Satellite-driven downscaling of global reanalysis
precipitation products
H. Seyyedi et al.
Title Page
Abstract Introduction
Conclusions References
Tables Figures
◭ ◮
◭ ◮
Back Close
Full Screen / Esc
Printer-friendly Version
Interactive Discussion
Discussion
P
a
per
|
Discus
sion
P
a
per
|
Discussion
P
a
per
|
Discussion
P
a
per
|
Cloke, H. L., Wetterhall, F., He, Y., Freer, J. E., and Pappenberger, F.: Modelling climate im-pact on floods with ensemble climate projections, Q. J. Roy. Meteorol. Soc., 139, 282–297, doi:10.1002/qj.1998, 2013.
Dee, D. P., Uppala, S. M., Simmons, A. J., Berrisford, P., Poli, P., Kobayashi, S., Andrae, U., Balmaseda, M. A., Balsamo, G., Bauer, P., Bechtold, P., Beljaars, A. C. M., van de Berg, L., 5
Bidlot, J., Bormann, N., Delsol, C., Dragani, R., Fuentes, M., Geer, A. J., Haimberger, L., Healy, S. B., Hersbach, H., Hólm, E. V., Isaksen, L., Kållberg, P., Köhler, M., Matricardi, M., McNally, A. P., Monge-Sanz, B. M., Morcrette, J. J., Park, B. K., Peubey, C., de Rosnay, P., Tavolato, C., Thépaut, J. N., and Vitart, F.: The ERA-Interim reanalysis: configuration and performance of the data assimilation system, Q. J. Roy. Meteorol. Soc., 137, 553–597, 10
doi:10.1002/qj.828, 2011.
Demaria, E. M. C., Rodriguez, D. A., Ebert, E. E., Salio, P., Su, F., and Valdes, J. B.: Evaluation of mesoscale convective systems in South America using multiple satel-lite products and an object-based approach, J. Geophys. Res.-Atmos., 116, D08103, doi:10.1029/2010JD015157, 2011.
15
Dinku, T., Ceccato, P., Grover-Kopec, E., Lemma, M., Connor, S., and Ropelewski, C.: Validation of satellite rainfall products over East Africa’s complex topography, Int. J. Remote Sens., 28, 1503–1526, 2007.
Duethmann, D., Zimmer, J., Gafurov, A., Güntner, A., Kriegel, D., Merz, B., and Vorogushyn, S.: Evaluation of areal precipitation estimates based on downscaled reanalysis and station data 20
by hydrological modelling, Hydrol. Earth Syst. Sci., 17, 2415–2434, doi:10.5194/hess-17-2415-2013, 2013.
Ebert, E. E., Janowiak, J. E., and Kidd, C.: Comparison of near-real-time precipitation esti-mates from satellite observations and numerical models, B. Am. Meteorol. Soc., 88, 47–64, doi:10.1175/BAMS-88-1-47, 2007.
25
Ferraris, L., Gabellani, S., Rebora, N., and Provenzale, A.: A comparison of stochastic models for spatial rainfall downscaling, Water Resour. Res., 39, 1368, doi:10.1029/2003WR002504, 2003.
Fowler, H. J., Blenkinsop, S., and Tebaldi, C.: Linking climate change modelling to impacts stud-ies: recent advances in downscaling techniques for hydrological modelling, Int. J. Climatol., 30
HESSD
11, 9067–9112, 2014Satellite-driven downscaling of global reanalysis
precipitation products
H. Seyyedi et al.
Title Page
Abstract Introduction
Conclusions References
Tables Figures
◭ ◮
◭ ◮
Back Close
Full Screen / Esc
Printer-friendly Version
Interactive Discussion
Discussion
P
a
per
|
Discus
sion
P
a
per
|
Discussion
P
a
per
|
Discussion
P
a
per
|
Frei, C., Schöll, R., Fukutome, S., Schmidli, J., and Vidale, P. L.: Future change of precipitation extremes in Europe: intercomparison of scenarios from regional climate models, J. Geophys. Res.-Atmos., 111, D06105, doi:10.1029/2005JD005965, 2006.
Gopalan, K., Wang, N.-Y., Ferraro, R., and Liu, C.: Status of the TRMM 2A12 Land Precipitation Algorithm, J. Atmos. Ocean. Tech., 27, 1343–1354, doi:10.1175/2010JTECHA1454.1, 2010. 5
Gottschalck, J., Meng, J., Rodell, M., and Houser, P.: Analysis of multiple precipitation products and preliminary assessment of their impact on global land data assimilation system land surface states, J. Hydrometeorol., 6, 573–598, doi:10.1175/JHM437.1, 2005.
Gourley, J. J., Hong, Y., Flamig, Z. L., Wang, J., Vergara, H., and Anagnostou, E. N.: Hydrologic evaluation of rainfall estimates from radar, satellite, gauge, and combinations on Ft. Cobb 10
Basin, Oklahoma, J. Hydrometeorol., 12, 973–988, doi:10.1175/2011JHM1287.1, 2011. Haas, R. and Born, K.: Probabilistic downscaling of precipitation data in a subtropical mountain
area: a two-step approach, Nonlin. Processes Geophys., 18, 223–234, doi:10.5194/npg-18-223-2011, 2011.
Hagen, E. and Lu, X. X.: Let us create flood hazard maps for developing countries, Nat. Haz-15
ards, 58, 841–843, doi:10.1007/s11069-011-9750-7, 2011.
Hong, Y., Hsu, K.-L., Moradkhani, H., and Sorooshian, S.: Uncertainty quantification of satellite precipitation estimation and Monte Carlo assessment of the error propagation into hydrologic response, Water Resour. Res., 42, W08421, doi:10.1029/2005WR004398, 2006.
Hong, Y., Adler, R. F., Hossain, F., Curtis, S., and Huffman, G. J.: A first approach to
20
global runoffsimulation using satellite rainfall estimation, Water Resour. Res., 43, W08502,
doi:10.1029/2006WR005739, 2007.
Hossain, F. and Anagnostou, E. N.: Assessment of current passive-microwave- and infrared-based satellite rainfall remote sensing for flood prediction, J. Geophys. Res.-Atmos., 109, D07102, doi:10.1029/2003JD003986, 2004.
25
Hossain, F. and Anagnostou, E. N.: Numerical investigation of the impact of uncertainties in satellite rainfall estimation and land surface model parameters on simulation of soil moisture, Adv. Water Resour., 28, 1336–1350, doi:10.1016/j.advwatres.2005.03.013, 2005.
Hou, A. Y., Kakar, R. K., Neeck, S., Azarbarzin, A. A., Kummerow, C. D., Kojima, M., Oki, R., Nakamura, K., and Iguchi, T.: The Global Precipitation Measurement (GPM) Mission, B. Am. 30
HESSD
11, 9067–9112, 2014Satellite-driven downscaling of global reanalysis
precipitation products
H. Seyyedi et al.
Title Page
Abstract Introduction
Conclusions References
Tables Figures
◭ ◮
◭ ◮
Back Close
Full Screen / Esc
Printer-friendly Version
Interactive Discussion
Discussion
P
a
per
|
Discus
sion
P
a
per
|
Discussion
P
a
per
|
Discussion
P
a
per
|
Huffman, G. J., Bolvin, D. T., Nelkin, E. J., Wolff, D. B., Adler, R. F., Gu, G., Hong, Y.,
Bow-man, K. P., and Stocker, E. F.: The TRMM Multisatellite Precipitation Analysis (TMPA): quasi-global, multiyear, combined-sensor precipitation estimates at fine scales, J. Hydrometeorol., 8, 38–55, doi:10.1175/JHM560.1, 2007.
Immerzeel, W. W., Rutten, M. M., and Droogers, P.: Spatial downscaling of TRMM precipitation 5
using vegetative response on the Iberian Peninsula, Remote Sens. Environ., 113, 362–370, doi:10.1016/j.rse.2008.10.004, 2009.
Janowiak, J. E., Joyce, R. J., and Yarosh, Y.: A real-time global half-hourly pixel-resolution infrared dataset and its applications, B. Am. Meteorol. Soc., 82, 205–217, doi:10.1175/1520-0477(2001)082<0205:ARTGHH>2.3.CO;2, 2001.
10
Jia, S., Zhu, W., Lű, A., and Yan, T.: A statistical spatial downscaling algorithm of TRMM
pre-cipitation based on NDVI and DEM in the Qaidam Basin of China, Remote Sens. Environ., 115, 3069–3079, doi:10.1016/j.rse.2011.06.009, 2011.
Joyce, R. J., Janowiak, J. E., Arkin, P. A., and Xie, P.: CMORPH: a method that produces global precipitation estimates from passive microwave and infrared data at 15
high spatial and temporal resolution, J. Hydrometeorol., 5, 487–503, doi:10.1175/1525-7541(2004)005<0487:CAMTPG>2.0.CO;2, 2004.
Kalnay, E., Kanamitsu, M., Kistler, R., Collins, W., Deaven, D., Gandin, L., Iredell, M., Saha, S., White, G., Woollen, J., Zhu, Y., Leetmaa, A., Reynolds, R., Chelliah, M., Ebisuzaki, W., Hig-gins, W., Janowiak, J., Mo, K. C., Ropelewski, C., Wang, J., Jenne, R., and Joseph, D.: 20
The NCEP/NCAR 40-Year Reanalysis Project, B. Am. Meteorol. Soc., 77, 437–471, doi:10.1175/1520-0477(1996)077<0437:TNYRP>2.0.CO;2, 1996.
Kappes, M. S., Gruber, K., Frigerio, S., Bell, R., Keiler, M., and Glade, T.: The MultiRISK plat-form: the technical concept and application of a regional-scale multihazard exposure analysis tool, Geomorphology, 151–152, 139–155, doi:10.1016/j.geomorph.2012.01.024, 2012. 25
Kidd, C., Bauer, P., Turk, J., Huffman, G. J., Joyce, R., Hsu, K. L., and Braithwaite, D.:
Intercom-parison of high-resolution precipitation products over Northwest Europe, J. Hydrometeorol., 13, 67–83, doi:10.1175/JHM-D-11-042.1, 2011.
Krajewski, W. F., Ciach, G. J., McCollum, J. R., and Bacotiu, C.: Initial validation of the global precipitation climatology project monthly rainfall over the United States, J. Appl. Meteorol., 30
HESSD
11, 9067–9112, 2014Satellite-driven downscaling of global reanalysis
precipitation products
H. Seyyedi et al.
Title Page
Abstract Introduction
Conclusions References
Tables Figures
◭ ◮
◭ ◮
Back Close
Full Screen / Esc
Printer-friendly Version
Interactive Discussion
Discussion
P
a
per
|
Discus
sion
P
a
per
|
Discussion
P
a
per
|
Discussion
P
a
per
|
Kubota, T., Shige, S., Hashizume, H., Aonashi, K., Takahashi, N., Seto, S., Takayabu, Y. N., Ushio, T., Nakagawa, K., Iwanami, K., Kachi, M., and Okamoto, K.: Global precipitation map using satellite-borne microwave radiometers by the GSMaP Project: production and valida-tion, IEEE T. Geosci. Remote, 45, 2259–2275, doi:10.1109/TGRS.2007.895337, 2007. Kummerow, C., Olson, W. S., and Giglio, L.: A simplified scheme for obtaining precipitation and 5
vertical hydrometeor profiles from passive microwave sensors, IEEE T. Geosci. Remote, 34, 1213–1232, doi:10.1109/36.536538, 1996.
Kummerow, C., Hong, Y., Olson, W. S., Yang, S., Adler, R. F., McCollum, J., Ferraro, R., Petty, G., Shin, D. B., and Wilheit, T. T.: The Evolution of the Goddard Profiling Algorithm (GPROF) for rainfall estimation from passive microwave sensors, J. Appl. Meteorol., 40, 10
1801–1820, doi:10.1175/1520-0450(2001)040<1801:TEOTGP>2.0.CO;2, 2001.
Lopez, P.: Direct 4D-Var assimilation of NCEP Stage IV Radar and Gauge Precipitation Data at ECMWF, Mon. Weather Rev., 139, 2098–2116, doi:10.1175/2010MWR3565.1, 2011. Maraun, D., Wetterhall, F., Ireson, A. M., Chandler, R. E., Kendon, E. J., Widmann, M.,
Brienen, S., Rust, H. W., Sauter, T., Themeßl, M., Venema, V. K. C., Chun, K. P., Good-15
ess, C. M., Jones, R. G., Onof, C., Vrac, M., and Thiele-Eich, I.: Precipitation downscaling under climate change: recent developments to bridge the gap between dynamical models and the end user, Rev. Geophys., 48, RG3003, doi:10.1029/2009RG000314, 2010.
McCollum, J. R., Krajewski, W. F., Ferraro, R. R., and Ba, M. B.: Evaluation of biases of satellite rainfall estimation algorithms over the continental United States, J. Appl. Meteorol., 41, 1065– 20
1080, doi:10.1175/1520-0450(2002)041<1065:EOBOSR>2.0.CO;2, 2002.
Nijssen, B. and Lettenmaier, D. P.: Effect of precipitation sampling error on simulated
hydrolog-ical fluxes and states: anticipating the Global Precipitation Measurement satellites, J. Geo-phys. Res.-Atmos., 109, D02103, doi:10.1029/2003JD003497, 2004.
Ning, L., Mann, M. E., Crane, R., and Wagener, T.: Probabilistic projections of climate change 25
for the mid-Atlantic region of the United States: validation of precipitation downscaling during the historical era*, J. Climate, 25, 509–526, doi:10.1175/2011JCLI4091.1, 2011.
Olson, W. S., Kummerow, C. D., Hong, Y., and Tao, W.-K.: Atmospheric latent heating dis-tributions in the tropics derived from satellite passive microwave radiometer measurements, J. Appl. Meteorol., 38, 633–664, doi:10.1175/1520-0450(1999)038<0633:ALHDIT>2.0.CO;2, 30