© Author(s) 2012. CC Attribution 3.0 License.
Sciences
Evaluation and bias correction of satellite rainfall data for drought
monitoring in Indonesia
R. R. E. Vernimmen1, A. Hooijer1, Mamenun2, E. Aldrian2, and A. I. J. M. van Dijk3
1Deltares, P.O. Box 177, 2600 MH, Delft, The Netherlands
2Meteorological Climatological and Geophysical Agency of Indonesia (BMKG), Jl.Angkasa I No. 2,
Jakarta 10720, P.O. Box 3540 JKT, Indonesia
3CSIRO Land and Water, GPO 1666, 2601 Canberra, ACT, Australia
Correspondence to:R. R. E. Vernimmen (ronald.vernimmen@deltares.nl)
Received: 9 March 2011 – Published in Hydrol. Earth Syst. Sci. Discuss.: 22 June 2011 Revised: 5 December 2011 – Accepted: 3 January 2012 – Published: 12 January 2012
Abstract. The accuracy of three satellite rainfall products (TMPA 3B42RT, CMORPH and PERSIANN) was investi-gated through comparison with grid cell average ground sta-tion rainfall data in Indonesia, with a focus on their ability to detect patterns of low rainfall that may lead to drought conditions. Each of the three products underestimated rain-fall in dry season months. The CMORPH and PERSIANN data differed most from ground station data and were also very different from the TMPA 3B42RT data. It proved possi-ble to improve TMPA 3B42RT estimates by applying a sin-gle empirical bias correction equation that was uniform in space and time. For the six regions investigated, this reduced the root mean square error for estimates of dry season rain-fall totals by a mean 9 % (from 44 to 40 mm) and for an-nual totals by 14 % (from 77 to 66 mm). The resulting er-rors represent 10 % and 3 % of mean dry season and annual rainfall, respectively. The accuracy of these bias corrected TMPA 3B42RT data is considered adequate for use in real-time drought monitoring in Indonesia. Compared to drought monitoring with only ground stations, this use of satellite-based rainfall estimates offers important advantages in terms of accuracy, spatial coverage, timeliness and cost efficiency.
1 Introduction
best performing remote sensing methods all combine MW and IR observations to deal with the temporally infrequent MW sampling (MW observations are from instruments on polar-orbiting satellites and therefore infrequent; high tem-poral frequency IR observations from geostationary satellites are needed to interpolate in time).
Several satellite precipitation products exist (see Sapiano and Arkin, 2009) but three combined MW-IR satellite pre-cipitation products have for some time been available via the internet in near real-time, and are therefore of particular interest for operational early warning systems.
The time series of satellite rainfall data have only re-cently become long enough for confident analysis of their usefulness for water resources management (the earliest go-ing back to 1998). National meteorological organizations are unlikely to adopt such data as a primary information source unless they are thoroughly evaluated for the specific con-ditions in their countries, based on a sufficiently long his-torical record covering the full range of climate conditions. A number of comparisons of satellite precipitation products against (up-scaled) station rainfall observations have been published, varying from detailed local and short-term com-parisons (Curtis et al., 2007; Scheel et al., 2011; Villarini and Krajewski, 2007) to ongoing initiatives providing near-real time evaluation statistics over large areas (Ebert et al., 2007). Most quantitative satellite rainfall evaluation studies focus on northern America, Europe and Australia, and few have evaluated the accuracy of satellite products in humid tropical environments outside these continents.
Within the hydrological community, studies using satellite rainfall have mostly focused on potential use in river flow forecasting (Behrangi et al., 2011; Su et al., 2008), often with an emphasis on the ability to accurately measure high rainfall rather than low rainfall. Most studies concluded that TRMM data are usefully accurate at monthly time steps, but less so at daily time steps (Su et al., 2008), which limits its use for flood forecasting. Current uses of satellite rainfall products in water resources monitoring systems early drought warning systems were reviewed by Van Dijk and Renzullo (2011). In general, operational systems currently use rainfall esti-mates produced by weather forecasting systems (which as-similate satellite observations) and/or gauge-based rainfall
ability in rainfall that challenges interpolation on the basis of on-ground gauges. This means that satellite products may potentially play a valuable role, but their accuracy too, may be influenced by topography and coastal influences. In this study, we investigate the accuracy of three satellite rainfall products for Indonesia. In addition, we developed a simple method to correct the products for bias in real-time to achieve a better agreement with rainfall measured at ground stations.
2 Methods and results
2.1 Satellite rainfall products
We studied the real-time products TMPA 3B42RT (Huffman et al., 2007), CMORPH (Joyce et al., 2004) and PERSIANN (Sorooshian et al., 2000). All are available at 0.25◦
×0.25◦
spatial resolution and 3-h temporal resolution.
Each of the three products evaluated here combines MW and IR data in somewhat different ways. The real-time TRMM Multi-satellite Precipitation Analysis 3B42 Real Time product (TMPA 3B42RT, Huffman et al., 2007) uses MW-derived precipitation estimates available from various satellites within the 3 h time step and 0.25◦ grid cell, after
0 500 1,000 Kilometers
(a)
Java Sumatra Kalimantan PapuaMalaysia
PNG
Indonesia
! ! ! ! !! ! ! !! ! ! ! ! !!! !!! ! ! !!!! ! ! ! ! ! ! ! ! ! !!! ! ! ! ! ! ! ! ! ! ! !! ! ! !! ! ! ! ! ! ! ! ! ! ! ! ! ! ! ! ! ! !!!!!0 250 5 00
Kilometers Lampung Jakarta Bogor Bandung East Java Banjar Baru
(b)
Fig. 1. (a)Map of Indonesia (and Malaysia, Brunei, Singapore, Papua New Guinea (PNG) and East Timor, grey areas). The red box is shown in more detail in(b).(b)TMPA 3B42RT validation areas indicated in different colours. Each square represents one satellite grid cell of 0.25◦×0.25◦. The black dots are the locations of the ground stations.
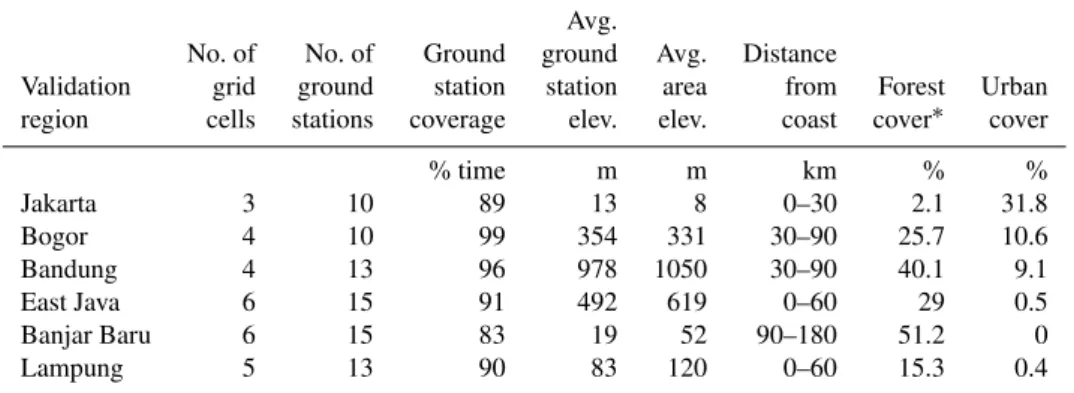
Table 1.Descriptive characteristics of the validation areas. Ground station data coverage for the period 2003–2008. Elevation determined from SRTM 90 m resolution (Jarvis et al., 2008). Forest and urban cover determined from GlobCover v2.2 regional land cover map over Southeast Asia (ESA, 2008).
Avg.
No. of No. of Ground ground Avg. Distance
Validation grid ground station station area from Forest Urban region cells stations coverage elev. elev. coast cover∗ cover
% time m m km % %
Jakarta 3 10 89 13 8 0–30 2.1 31.8
Bogor 4 10 99 354 331 30–90 25.7 10.6
Bandung 4 13 96 978 1050 30–90 40.1 9.1
East Java 6 15 91 492 619 0–60 29 0.5
Banjar Baru 6 15 83 19 52 90–180 51.2 0
Lampung 5 13 90 83 120 0–60 15.3 0.4
∗Including degraded forest and plantation forest.
Rainfall estimates derived from the TRMM satellite have been collected since 1998 and are available as a real time product since early 2002, whereas CMORPH and PER-SIANN data are available since 2003 and 2000, respectively. The algorithm of the TMPA 3B42RT product used in this study is Version 5. A newer “Version 6” algorithm of TMPA 3B42RT was issued in 2009, with the record beginning in late 2008. The new version also includes an “uncalibrated” field that provides continuity with the previous version.
2.2 Selection and screening of ground station rainfall data
Fig. 2.Monthly ground station rainfall records for the period 2003–2008 in a single satellite grid cell, around Bogor.
to provide a larger scale average rainfall estimate. This led to six clusters of rainfall stations around Jakarta, Bogor, Ban-dung and East Java (Java), and Banjar Baru (Kalimantan) and Lampung (Sumatra) (Table 1).
Within the validation areas, monthly station rainfall records (derived from daily measurements) were selected that had data coverage for over 75 % of the time during the study period. The data were checked for consistency by car-rying out double mass curve analysis. As a result of this analysis, unreasonable values such as zero-rainfall months during the wet season were deleted. Data that appeared gap-filled using data from other stations or years were also ex-cluded. After screening, a total of 76 stations were found suitable, having 10 to 15 stations for each of the six areas. Temporal data coverage was>67 % for individual stations and 83–99 % for each of the six groups of stations (Table 1). It was considered important to have more than one ground station in each satellite grid cell in the comparison because the gridded satellite data represent a measure of average rain-fall over the grid cells; an area of 772 km2 (0.25◦ equals
to approximately 27.78 km near the equator). Tropical rain-storms tend to be localized, with heavy rainfall sometimes affecting an area of less than 10 km across. This will re-sult in differences in rainfall rates over short distances within satellite grid cells. Moreover, in a mountainous island coun-try like Indonesia many grid cells cover a considerable alti-tude range, which can cause non-random patterns in rainfall rate. An example of the differences between rainfall records from four reliable ground stations within a single satellite grid cell in the rather mountainous Bogor area is shown in Fig. 2. Combining data for more than one ground station will therefore likely be more representative of average rainfall in an area the size of a satellite grid cell.
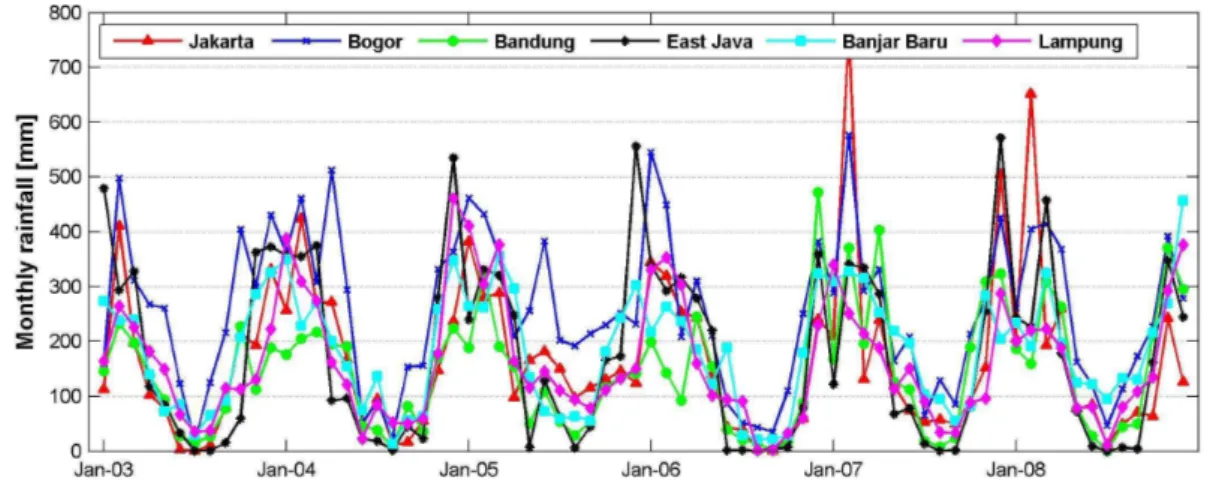
Grid cell average monthly ground station time series plots for each of the six validation areas are shown in Fig. 3. Dif-ferent rainfall regimes are apparent for difDif-ferent areas, but the seasonality is largely the same, with June–October usually
being the driest months. Validating and bias correcting satel-lite data for these six areas, each different in terms of dis-tance to the coast, elevation, land cover (Table 1) and rainfall rates (Table 2), builds confidence that the resulting error es-timates and bias corrections will be appropriate for the range of conditions found in Indonesia.
2.3 Comparing satellite with ground station rainfall data
Fig. 3.Average monthly ground station rainfall for the six validation areas for the period 2003–2008.
Table 2.Average annual precipitation (P, in mm) and relative bias (%) over the period 2003–2008 for ground stations, and satellite products TMPA 3B42RT, CMORPH and PERSIANN.
Validation Ground
region stations TMPA CMORPH PERSIANN
P P rel. bias P rel. bias P rel. bias
Jakarta 2010 1865 −7.2 1155 −42.6 2524 25.5 Bogor 3056 2944 −3.7 2246 −26.5 3087 1.0 Bandung 1723 1936 12.3 1690 −1.9 2806 62.9 East Java 2106 1835 −12.8 1417 −32.7 2077 −1.4 Banjar Baru 2208 2217 0.4 2264 2.6 2783 26.1 Lampung 1946 2191 12.6 1695 −12.9 3182 63.5
the validation period is too short to confidently quantify this change, it appears that TMPA 3B42RT data have become more accurate since 2005.
The annual and dry season relative bias (Eq. 1) for each of the products as well as rainfall total is shown in Tables 2 and 3. While different definitions of “dry season” exist in In-donesia (Wyrtki, 1956; Aldrian and Susanto, 2003), for dif-ferent regions and purposes, we have defined it here as June– October, the period over which the validation areas had aver-age rainfall below that in the remainder of the year, in most cases below 100 mm per month (except in Bogor where it is 143 mm per month), which defines “dry” conditionssensu
Br¨unig (1969) and Oldeman et al. (1979, 1980).
Relative bias(bias)=
N P i=1
Pgroundst.(i)−Psatellite(i)
N P i=1
Pgroundst.(i)
×100 (1)
whereNis the number of months.
Relative bias on an annual basis varies between−12.8 to
12.6 % for TMPA 3B42RT, −42.6 to 2.6 % for CMORPH
and−1.4 to 63.5 % for PERSIANN (Table 2). Dry season
relative bias is greater compared to the annual relative bias, ranging from−55.1 to 1.0 % for TMPA 3B42RT,−55.6 to
8.7 % for CMORPH and −63.7 to 9.5 % for PERSIANN
(Table 3).
2.4 Spatial comparison of average annual rainfall from satellite products for Indonesia
Fig. 4.Double mass curves showing the accumulated amount of rainfall of the observations against the satellite estimates (TMPA 3B42RT, CMORPH and PERSIANN) for each of the six validation areas for 2003–2008.
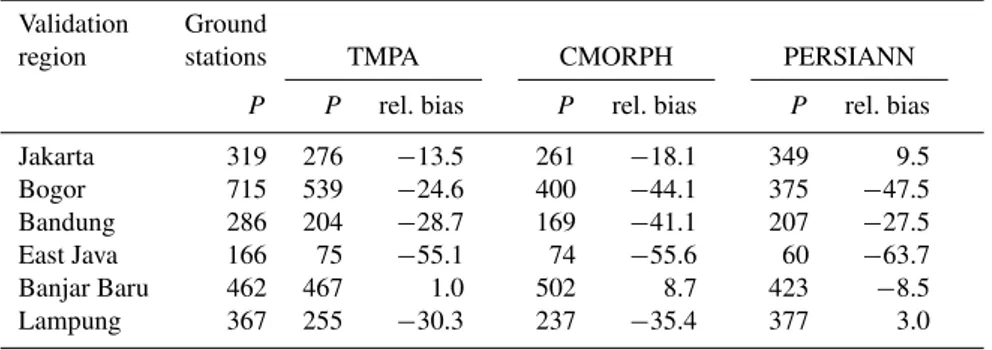
Table 3.Average dry season (June–October) precipitation (P, in mm) and relative bias (%) over the period 2003–2008 for ground stations, and satellite products TMPA 3B42RT, CMORPH and PERSIANN.
Validation Ground
region stations TMPA CMORPH PERSIANN
P P rel. bias P rel. bias P rel. bias
Jakarta 319 276 −13.5 261 −18.1 349 9.5 Bogor 715 539 −24.6 400 −44.1 375 −47.5 Bandung 286 204 −28.7 169 −41.1 207 −27.5 East Java 166 75 −55.1 74 −55.6 60 −63.7 Banjar Baru 462 467 1.0 502 8.7 423 −8.5 Lampung 367 255 −30.3 237 −35.4 377 3.0
2.5 Determining a bias correction equation for TMPA 3B42RT rainfall data
Comparison with ground station measurements showed the TMPA 3B42RT product to be the most accurate satellite rainfall product (Tables 2 and 3). Moreover, comparison with other satellite products revealed large differences. The TMPA 3B42RT data were identified as the most suitable source of satellite rainfall information. However, there were differences with ground station data that may be reduced.
We therefore obtained a bias correction equation to achieve a closer fit between monthly TMPA 3B42RT and ground sta-tion averages. To accommodate for the finding that relative bias varied with total monthly rainfall, a power function was applied to derive bias corrected rainfall (P∗):
P∗
=a∗(P /P0)b (2)
where the reference monthly rainfall (P0, 1 mm per month)
-50 - -25%
-25 - 0%
10 - 25%
25 - 50%
0 500 1,000 Kilometers
Fig. 5. Relative difference in annual average rainfall over the period 2003–2008 between TMPA 3B42RT and CMORPH (top panel) and TMPA 3B42RT and PERSIANN (lower panel).
minimizing both the annual and dry season sum of average monthly differences between bias corrected and ground sta-tion measurements for all 6 validasta-tion areas together. The generalized reduced gradient algorithm (Fylstra et al., 1998) was used to obtain an optimized value of 3.20 foraand 0.79 forb. In Fig. 6 a scatter plot of average monthly rainfall for ground station data for all 6 validation areas and uncorrected and bias corrected TMPA 3B42RT is shown. This non-linear bias-correction mitigated the underestimation by TMPA of rainfall in dry months, without leading to an overestimation of rainfall during wet months (Fig. 6). The fraction of vari-ance in log-transformed observed monthly rainfall for the 6 sites combined that was explained by the satellite rainfall estimates increased from 0.78 to 0.93 after bias correction. The distribution of average monthly rainfall over the year for ground station data and uncorrected and bias corrected TMPA 3B42RT data is shown in Fig. 7, and the monthly time series in Fig. 8. The average difference, relative bias and RMSE of the bias corrected TMPA 3B42RT rainfall are given in Tables 4 and 5 for each of the individual validation areas. Although relative bias only improved for 2 of the 6 validation areas on an annual basis, RMSE improved in all cases, by 6 % for Banjar Baru to 24 % for Lampung (Table 4). For the dry season, relative bias improved for 5 of the 6 val-idation areas, and RMSE improved for 4 of the 6 valval-idation areas, by 12 to 26 % (Table 5).
3 Discussion
3.1 Comparison of different satellite rainfall estimates over Indonesia
All comparisons showed the TMPA 3B42RT data to be more accurate overall than the two other products evalu-ated. In terms of daily (rather than monthly) rainfall, Ebert et al. (2007) found the CMORPH product appeared to be best overall, followed by PERSIANN in the wet season, and TMPA in the dry season. This difference may be related to the different environments considered and the lesser degree of calibration of the different products for Indonesia. Rainfall in Indonesia is dominated by convective events, and very few ground station data will have been available for calibration for any of the three products.
In almost all validation areas, the (uncorrected) satel-lite rainfall products underestimated rainfall in dry months and overestimated rainfall in wet months (shown for TMPA 3B42RT in Fig. 8). These tendencies are consistent with pub-lished studies. Ebert et al. (2007) compared several satellite precipitation products for northern Australia (10–25◦S) and
Fig. 6.Average monthly uncorrected TMPA 3B42RT (top panel) and bias corrected TMPA 3B42RT (lower panel) over 2003–2008 for all 6 validation areas together compared with ground station data (both on logarithmic axis).
Table 4.Annual ground station and TMPA 3B42RT precipitation (P, in mm per year), average difference, relative bias (%, to observations), RMSE (in mm per month) and correlation coefficients before and after bias correction of TMPA 3B42RT precipitation estimates over the period 2003–2008.
Validation Ground TMPA
region stations TMPA bias corr.
P P Avg. rel. RMSE R2 P Avg. rel. bias RMSE R2
diff. bias diff.
Jakarta 2010 1865 −145 −7.2 83.8 0.84 1918 −92 −4.6 78.2 0.84 Bogor 3056 2944 −112 −3.7 94.9 0.83 2845 −211 −6.9 79.8 0.84 Bandung 1723 1936 213 12.3 85.8 0.84 1965 242 14.0 71.6 0.86 East Java 2106 1835 −271 −12.8 56.0 0.95 1819 −287 −13.6 49.3 0.96 Banjar Baru 2208 2217 9 0.4 59.6 0.84 2303 95 4.3 56.0 0.85 Lampung 1946 2190 244 12.6 83.8 0.89 2200 254 13.1 63.6 0.90
Avg. total 2175 2165 −10 0.3 77.3 0.87 2175 0 1.0 66.4 0.88
the cool season (Ebert et al., 2007; Villarini and Krajewski, 2007), (although Scheel et al. (2011) found overestimation for Cusco in Peru and La Paz in Bolivia). Rainfall detec-tion in infrared wavelengths relies on sufficiently cooling of cloud tops, which does not necessarily occur in frontal sys-tems or moist ocean air inflow. In the Indonesian context,
Fig. 7.Average monthly bias corrected TMPA 3B42RT data over 2003–2008, compared with ground station and uncorrected TMPA 3B42RT data.
Table 5.Dry season (June–October) ground station and TMPA 3B42RT precipitation (P, in mm per season), average difference, relative bias (%, to observations), RMSE (in mm per month) and correlation coefficients before and after bias correction of TMPA 3B42RT precipitation estimates over the period 2003–2008.
Validation Ground TMPA
region stations TMPA bias corr.
P P Avg. rel. RMSE R2 P Avg. rel. bias RMSE R2
diff. bias diff.
Jakarta 319 276 −43 −13.5 50.5 0.62 340 21 6.6 51.2 0.65 Bogor 715 539 −176 −24.6 72.9 0.78 604 −111 −15.5 64.1 0.79 Bandung 286 204 −82 −28.7 33.9 0.87 265 −21 −7.3 29.7 0.87 East Java 166 75 −91 −55.1 31.8 0.91 114 −52 −31.3 23.6 0.92 Banjar Baru 462 467 5 1.0 36.0 0.85 551 89 19.3 40.2 0.85 Lampung 367 255 −121 −30.3 39.9 0.71 336 −31 −8.4 32.2 0.77
Avg. total 386 303 −83 −25.2 44.2 0.79 368 −18 −6.1 40.2 0.81
have also been reported in other studies (e.g. Behrangi et al., 2011; Curtis et al., 2007; Katsanos et al., 2004; Su et al., 2008; but not Scheel et al., 2011). In the present study, dry season rainfall underestimates and wet season overesti-mates led, on average, to unbiased estioveresti-mates of annual rain-fall. It seems plausible that this reflects compensation in the three remote sensing methods, that is, calibration against
ground-measured data may have led to an overestimation of rainfall from larger, detected events (mainly occurring dur-ing the wet season) in order to compensate for undetected or underestimated small events.
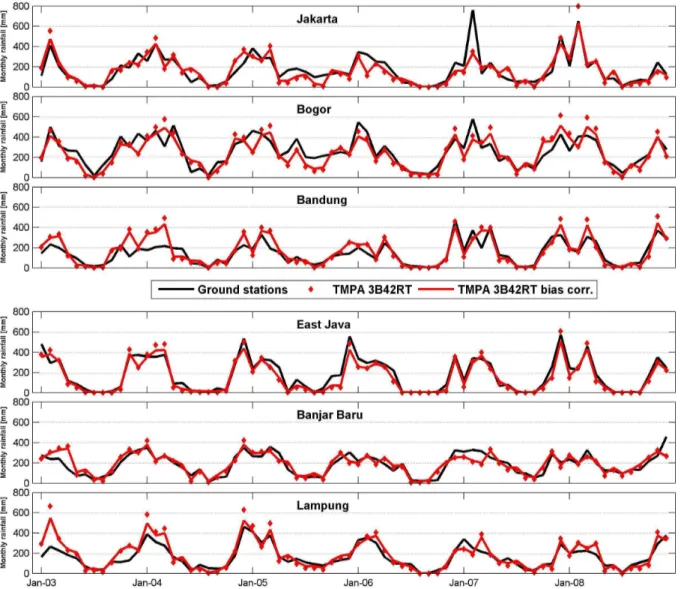
Fig. 8. Comparison of average monthly ground station rainfall with bias corrected and uncorrected TMPA 3B42RT for the individual validation areas.
estimates in high altitude areas than the other two products. On the basis of the physics of rainfall remote sensing, most authors predict that satellite rainfall products are more likely to underestimate than overestimate rainfall in high altitude areas (Hirpa et al., 2009), and therefore the PERSIANN es-timates may be the less realistic. Artifacts in satellite rain-fall estimates can arise in coastal areas because different re-trieval methods are required over land and sea, respectively. In this case it would appear that the TMPA and PERSIANN products show more consistency, but we cannot assess which estimates are the more accurate.
3.2 Suitability of bias corrected TMPA 3B42RT data for monthly rainfall monitoring
Although patterns in uncorrected TMPA 3B42RT rainfall closely resemble patterns in ground station rainfall in Indone-sia, they consistently underestimate rainfall in dry periods
(Table 3). When uncorrected TMPA 3B42RT data would be used for water resources management purposes, this un-derestimation of rainfall would introduce an overestimation of water deficits. After bias correction on a monthly ba-sis, rainfall difference in ground station measurements and TMPA 3B42RT data over the dry season was reduced for 5 out of 6 areas, evident from an improved RMSE (Table 5). The bias correction reduced the station-average difference between ground station and TMPA 3B42RT rainfall over the June–October “dry season” period from 83 to 18 mm, or only 3.6 mm month−1on an average monthly rainfall amount of
77 mm (Table 5). This is a distinct improvement, although greater deviations remain for individual areas: from 111 mm in Bogor to−89 mm for Banjar Baru. However on a monthly
basis the latter deviations are still within 25 mm month−1.
Fig. 9. Bias ratio vs. elevation for the individual ground stations in the six validation areas (R2=0.0001,n=73; of the 76 avail-able stations (Tavail-able 1), 3 did not have any full year of validated observations).
On an annual basis, the bias correction removed the dif-ference between ground station and TMPA 3B42RT rainfall averaged over all areas. However, significant differences re-main for individual areas, ranging from 287 mm yr−1in East
Java to−254 mm yr−1in Lampung (Table 4). This is up to
15 % of the∼2000 mm yr−1rainfall that these locations
re-ceive. A smaller deviation would be preferable, but it should be considered that for much of Indonesia, the low spatial cov-erage and variable quality of ground station records will not allow a better measurement of average rainfall over large ar-eas. Moreover, there was some evidence that TMPA 3B42RT rainfall estimates in the wet season improved since 2005.
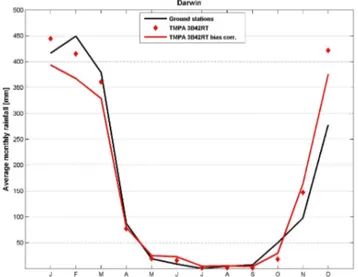
It is noted that the ground stations used in this validation do not cover all climatic regions of Indonesia (Aldrian and Susanto, 2003) and there is a systematic under-sampling in higher altitude and forested areas. The latter is due to the simple fact that rainfall in Indonesia (and indeed many coun-tries) is mainly measured in densely populated and defor-ested lowlands and valleys. For six river basins of Ethiopia, Romilly and Gebremichael (2011) found that the accuracy of TMPA satellite rainfall estimates depended on elevation. Using a similar analysis approach we found no apparent re-lationship between the bias ratio (TMPA 3B42RT precipita-tion estimate divided by average annual gauge precipitaprecipita-tion, calculated for each individual measurement station) and el-evation (Fig. 9, R2=0.0001). An independent test using measurements from the Southeast Asian Climate Assessment (SACA) dataset (Klein Tank et al., 2011) in Northern Terri-tory, Australia, shows that our bias correction also improved monthly (and annual) precipitation estimates (Fig. 10) in that region. This provides more confidence that the derived bias correction may help remove bias in TMPA estimates for other tropical regions.
Fig. 10. Average monthly corrected TMPA 3B42RT data over 2003–2008, compared with ground station and uncorrected TMPA 3B42RT data for a TMPA grid cell in the Northern Territory (Darwin), Australia. Average annual precipitation 4 ground sta-tions (Darwin airport, Karama, Leanyer and Shoal Bay) = 1797 mm, average annual uncorrected TMPA 3B42RT = 1926 mm and av-erage annual bias corrected TMPA 3B42RT = 1801 mm. R2 uncorrected TMPA 3B42RT = 0.90; R2 bias corrected TMPA 3B42RT = 0.91; RMSE uncorrected TMPA 3B42RT = 94.8 mm per month; RMSE bias corrected TMPA 3B42RT = 85.6 mm per month.
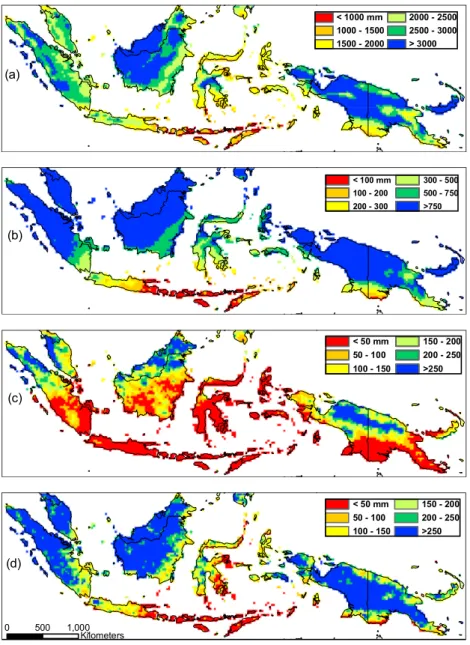
Maps of average annual and dry season rainfall, generated using bias corrected TMPA 3B42RT data, are presented in Fig. 11. This clearly shows the large spatial and temporal variation in rainfall that exists in Indonesia, with annual rain-fall rates varying from above 3000 to below 1500 mm yr−1,
and with even greater relative differences in the dry season. The latter is even more apparent when comparing a relative wet dry season month (October 2007) with the same month in the 2006 El Ni˜no year (Fig. 11c, d).
Clearly such major variations necessitate the use of ac-curate and real time rainfall information in water resources management and crop planning. The availability of up-to-date maps of rainfall patterns may also allow better planning of reservoir dimensions and the location of agricultural ac-tivities that are very sensitive to drought. The limited spatial coverage of ground stations and climate change mean that rainfall distribution maps based on historical ground station rainfall data are not necessarily always accurate. It would be best to enhance such maps using up-to-date and accurate satellite data.
< 50 mm 50 - 100 100 - 150
150 - 200 200 - 250 >250
(c)
0 500 1,000
Kilometers
< 50 mm 50 - 100 100 - 150
150 - 200 200 - 250 >250
(d)
Fig. 11. (a)Average annual and(b)dry season (June–October) rainfall as determined from monthly bias corrected TMPA 3B42RT over 2003–2008 as well as(c)October 2006 and(d)October 2007 bias corrected TMPA 3B42RT rainfall.
respectively. In addition, early research suggests it may be possible to constrain satellite precipitation estimates using remotely sensed soil moisture estimates to filter out any addi-tional errors (Crow and Ryu, 2009). Finally, further improve-ments in satellite rainfall estimates may be expected with the new missions, in particular the Global Precipitation Measure-ment mission planned for launch in 2014 (Smith et al., 2007).
4 Conclusions
TMPA 3B42RT satellite rainfall data appeared to have greater accuracy than two other products (PERSIANN, CMORPH) and bias correction on a monthly basis further improved accuracy. We consider the resulting estimates to
Deltares internal R&D funding and the SDWA Peatland Pro-gramme. The Delft-FEWS system was used for processing satellite data. Ground station rainfall data were provided by Perum Jasa Tirta I and BMKG, the latter which will collaborate on DEWS development through a Joint Cooperation programme between PusAir, BMKG, Deltares and KNMI. The manuscript benefited from the insightful comments of two anonymous referees.
Edited by: S. Thompson
References
Aldrian, E. and Djamil, Y. S.: Spatio-temporal climatic change of rainfall in East Java Indonesia, Int. J. Climatol., 28, 435–448, 2008.
Aldrian, E. and Susanto, R. D.: Identification of three dominant rainfall regions within Indonesia and their relationship to sea sur-face temperature, Int. J. Climatol., 23, 1435–1452, 2003. Behrangi, A., Khakbaz, B., Jaw, T. C., AghaKouchak, A., Hsu, K.,
and Sorooshian, S.: Hydrologic evaluation of satellite precipita-tion products over a mid-size basin, J. Hydrol., 397, 225–237, 2011.
Br¨unig, E. F.: On the seasonality of droughts in the lowlands of Sarawak (Borneo), Erdkunde, 23, 127–133, 1969.
Crow, W. T. and Ryu, D.: A new data assimilation approach for improving runoff prediction using remotely-sensed soil moisture retrievals, Hydrol. Earth Syst. Sci., 13, 1–16, doi:10.5194/hess-13-1-2009, 2009.
Curtis, S., Crawford, T. W., and Lecce, S. A.: A comparison of TRMM to other basin-scale estimates of rainfall during the 1999 Hurricane Floyd flood. Nat. Hazards, 43, 187–198, 2007. Ebert, E. E., Janowiak, J. E., and Kidd, C.: Comparison of
near-real-time precipitation estimates from satellite observations and numerical models, B. Am. Meteorol. Soc., 88, 47–64, 2007. ESA: GlobCover Land Cover v2.2, European Space Agency
Glob-Cover Project, led by MEDIAS-France, available at: http:// ionia1.esrin.esa.int/index.asp, last access: 25 August 2009, 2008. Field, R. D., Wang, Y., Roswintiarti, O., and Guswanto: A drought-based predictor of recent haze events in western Indonesia, At-mos. Environ., 38, 1869–1878, 2004.
Franchito, S. H., Rao, V. B., Vasques, A. C., Santo, C. M. E., and Conforte, J. C.: Validation of TRMM precipitation radar monthly rainfall estimates over Brazil, J. Geophys. Res., 114, D02105, doi:10.1029/2007JD009580, 2009.
Fylstra, D., Lasdon, L., Watson, J., and Waren, A.: Design and use of the Microsoft Excel solver, Interfaces, 28, 29–55, 1998. Hirpa, F. A., Gebremichael, M., and Hopson, T.: Evaluation of
high-resolution satellite precipitation products over very com-plex terrain in Ethiopia, J. Appl. Meteorol. Climatol., 49, 1044– 1051, 2010.
Hsu, K., Gao, X., Sorooshian, S., and Gupta, H. V.: Precipitation es-timation from remotely sensed information using artificial neural networks, J. Appl. Meteorol., 36, 1176–1190, 1997.
Huffman, G. J. and Bolvin, D. T.: Real-Time TRMM Multi-Satellite Precipitation Analysis data set documentation, laboratory for at-mospheres, NASA Goddard space flight center and science sys-tems and applications, Inc., 2010, available at: ftp://meso-a.gsfc.
ary 2011, 2010.
Huffman, G. J., Adler, R. F., Bolvin, D. T., Gu, G., Nelkin, E. J., Bowman, K. P., Hong, Y., Stocker, E. F., and Wolff, D. B.: The TRMM Multisatellite Precipitation Analysis (TMPA): quasi-global, multiyear, combined-sensor precipitation estimates at fine scales, J. Hydrometeorol., 8, 38–55, 2007.
Jarvis, A., Reuter, H. I., Nelson, A., and Guevara, E.: Hole-filled seamless SRTM data V4, International Centre for Tropi-cal Agriculture (CIAT), available at: http://srtm.csi.cgiar.org, last access: 3 July 2008, 2008.
Joyce, R. J., Janowiak, J. E., Arkin, P. A., and Xie, P.: CMORPH: A method that produces global precipitation estimates from pas-sive microwave and infrared data at high spatial and temporal resolution, J. Hydrometeorol., 5, 487–503, 2004.
Katsanos, D., Lagouvardos, K., Kotroni, V., and Huffmann, G. J.: Statistical evaluation of MPA-RT high-resolution pre-cipitation estimates from satellite platforms over the central and eastern Mediterranean, Geophys. Res. Lett., 31, L06116, doi:10.1029/2003GL019142, 2004.
Klein Tank, A. M. G. and Coauthors:. Daily dataset for cli-mate extremes analyses in Southeast Asia, in preparation, Data and metadata available at: http://saca-bmkg.knmi.nl, last ac-cess: 22 March 2011, 2011.
Kirono, D. G. C. and Tapper, N. J.: ENSO rainfall variability and impacts on crop production in Indonesia, Phys. Geogr., 20, 508– 519, 1999.
Naylor, R. L., Falcon, W. P., Rochberg, D., and Wada, N.: Using El Nino/Southern Oscillation climate data to predict rice production in Indonesia, Climatic Change, 50, 255–265, 2001.
Oldeman, L. R., Las, I., and Darwis, S. N.: An agroclimatic map of Sumatra, Contributions, Central Research Institute for Agricul-ture, Bogor, No. 52, 35 pp., 1979.
Oldeman, L. R., Las, I., and Muladi: The agroclimatic maps of Kalimantan, Maluku, Irian Jaya and Bali, West and East Nusa Tenggara, Contributions, Central Research Institute for Agricul-ture, Bogor, No. 60, 32 pp., 1980.
Romilly, T. G. and Gebremichael, M.: Evaluation of satellite rain-fall estimates over Ethiopian river basins, Hydrol. Earth Syst. Sci., 15, 1505–1514, doi:10.5194/hess-15-1505-2011, 2011. Sapiano, M. R. P. and Arkin, P. A.: An intercomparison and
validation of high-resolution satellite precipitation estimates with 3-hourly gauge data, J. Hydrometeorol., 10, 149–166, doi:10.1175/2008JHM1052.1, 2009.
Scheel, M. L. M., Rohrer, M., Huggel, Ch., Santos Villar, D., Silvestre, E., and Huffman, G. J.: Evaluation of TRMM Multi-satellite Precipitation Analysis (TMPA) performance in the Central Andes region and its dependency on spatial and temporal resolution, Hydrol. Earth Syst. Sci., 15, 2649–2663, doi:10.5194/hess-15-2649-2011, 2011.
Sheffield, J., Wood, E. F., Lettenmaier, D. P., and Lipponen, A.: Experimental Drought Monitoring for Africa, GEWEX News, 8, 2008.
Sorooshian, S., Hsu, K., Gao, X., Gupta, H. V., Imam, B., and Braithwaite, D.: Evaluation of PERSIANN system satellite-based estimates of tropical rainfall, B. Am. Meteorol. Soc., 81, 2035–2046, 2000.