Article
*e-mail: [email protected]
Distribution and Sources of Polycyclic Aromatic Hydrocarbons in Surface
Sediments from Two Brazilian Estuarine Systems
Otávio L. G. Maioli,a Kamila C. Rodrigues,a Bastiaan A. Knoppersb and
Débora A. Azevedo*,a
aInstituto de Química, Universidade Federal do Rio de Janeiro, 21941-909 Rio de Janeiro-RJ, Brazil
bDepartamento de Geoquímica, Universidade Federal Fluminense, 24020-150 Niterói-RJ, Brazil
Este estudo concentra-se nos sistemas estuarinos tropicais de Mundaú-Manguaba (MMELS) e do Rio Paraíba do Sul (PSR), ambos no Brasil e afetados por práticas da monocultura da cana-de-açúcar e por urbanização. Os níveis de 17 hidrocarbonetos policíclicos aromáticos (HPAs), 16 dos quais são classiicados como poluentes prioritários para estudos ambientais pela US-EPA e o perileno (HPA biogênico) foram avaliados nos sedimentos supericiais para identiicar fontes da poluição e determinar níveis base como estratégias para gerenciamentos futuros. O Σ16HPAs variou de 2,90 a 231,30 μg kg-1 em MMELS e de 87,10 a 9344,29 μg kg-1 no PSR. As relações
entre HPAs isômeros sugeriram principalmente fontes de origem pirogênica.
This study focuses on the tropical estuarine systems of Mundaú-Manguaba (MMELS) and Paraíba do Sul River (PSR), Brazil, affected by sugarcane monoculture practices and also urbanization. The levels of 17 polycyclic aromatic hydrocarbons (PAHs), 16 of which are classiied as priority pollutants by the US-EPA and perylene (a biogenic PAH) were measured in surface sediments to identify pollution sources and determine baseline data looking for future management strategies. The Σ16PAH ranged from 2.90 to 231.30 μg kg-1 in MMELS and from
87.10 to 9344.29 μg kg-1 in the PSR. PAH isomeric ratios suggested mainly pyrogenic input.
Keywords: PAH, sediments, pollution sources, Brazilian estuary, sugarcane burning
Introduction
Marine coastal areas play an important role in the global carbon cycle, either as sources of organic matter to the open ocean or as carbon sinks in the form of accumulation in
sediments.1 Marine sediments serve as an ultimate reservoir
for natural and anthropogenic organic matter generated by organisms living in the sediment and the overlying water column and supplied by river discharge and atmospheric
transport.2
Hydrocarbons are abundant components of organic material in coastal zones, and one of the major classes of
organic compounds.1 Polycyclic aromatic hydrocarbons
(PAHs) are widespread environmental contaminants and are known for their carcinogenic and mutagenic effects. They are generally more resistant to biodegradation than many saturated biomarkers and tend to persist in contaminated sediments, water, soil, atmospheric particulate matter and
some organisms like mussels.3-8 The PAH sources are
mainly anthropogenic and originate from several sources:
(i) petroleum inputs; (ii) hydrocarbons released as the result
of incomplete combustions of fuels; (iii) PAHs originating
from forest, sugarcane and grass ires (transported to the
marine environment via eolian (atmospheric) and luvial
(riverine) processes); (iv) biosynthesis of hydrocarbons
by marine or terrigeneous organisms; (v) early diagenetic
transformation from natural products and hydrocarbons;
and (vi) hydrocarbons diffusing from the mantle, petroleum
source rocks or reservoirs.9-11 Atmospheric particulate
matter emitted by sugarcane burning contains considerable concentrations of PAHs and can be accumulated in
sediments.12 Despite their low aqueous solubility and
hydrophobic nature, PAHs tend to associate with particulate material, which will inally be deposited in soil and in the underlying sediments of lacustrine, estuarine and marine
environments.13 Because of these characteristics, many
and evaluate the degree of ecological impact. Generally, the anthropogenic sources of PAHs may be classiied as pyrogenic or petrogenic by individual PAH ratios, based on peculiarities in PAH composition and distribution as a
function of the emission source.14,15 Many ratios between
PAHs in sediments are diffused to identiication source emissions as Ant/(Ant+Phen), BaA/(BaA+Chry), Flt/ (Flt+Py) and InP/(InP+BghiP).
The sample areas in this work represent reference sites for studies on the transport pathways and transformations of effluents and pollutants in sediments, and for the reconstruction of the sugarcane impacts since the beginning of the practice in the 17th century. Sugarcane monoculture and industry are important pollutant sources for water, air and soils in northeastern and eastern Brazilian agriculture. In Brazil, after the 1970s, sugarcane production expanded greatly, mainly due to PROÁLCOOL, the program developed by Brazilian government for the production of ethanol used as automotive fuel. In 2004, Brazil has responded for approximately 27% of sugarcane plantation worldwide and has been the major sugarcane producer. To facilitate manual reaping and to increase production, the sugarcane crops are always burned before being harvested, emitting contaminants to its surroundings.
In this regard, this study addresses the sedimentary concentrations of PAHs in the tropical estuarine systems of Mundaú-Manguaba, in Northeastern Brazil, and of the Paraíba do Sul River, Southeastern Brazil, affected by sugarcane monoculture practices and also urbanization. A total of 17 PAHs, including 16 identiied by the U. S. Environmental Protection Agency (USEPA) as priority pollutants and perylene, known to be of biogenic origin were analyzed. Source identiication was evaluated by PAH isomeric ratios.
Materials and Methods
Study areas
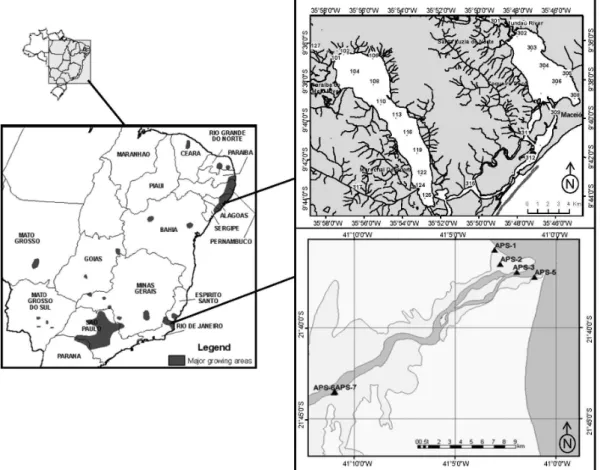
The study areas correspond to the Mundaú-Manguaba estuarine-lagoon system (MMELS), located in the state of Alagoas, NE-Brazil (Lat. 9º 35´ and 9º 46´ S, Long. 35º 44´ and 35º 58´ W), and the Paraiba do Sul River estuary (PSR), state of Rio de Janeiro, SE-Brazil (Lat. 21º 48´ S, Long. 41º 02´W) (Figure 1). MMELS falls into the category of a choked estuarine-lagoon system, with long residence times of water, a large potential for material recycling and
retention, and exhibits eutrophic conditions.16,17 In contrast,
the PSR estuary falls into the category of an estuarine-delta, fed by turbid river waters and is an exporter of materials to the coastal sea.
MMELS has a total surface area of 79 km2 and a
mean depth of around 2 m. It consists of three distinct
compartments, the Manguaba (A = 43 km2) and the Mundaú
(A = 24 km2) lagoons and a maze of mangrove-lined narrow
channels (A = 12 km2) connected via a single 250 m-wide
tidal inlet to the sea. The system of the watershed has
an area of 7844 km2 and the climate in the upper basin
is semi-arid and the lower basin is tropical humid, with a precipitation of 1654 mm and distinct dry summer (November to March) and wet winter (May to August) conditions. Sugarcane waste efluents are transported by the rivers and urban sewage is introduced into Mundaú
lagoon from the Maceió city (ca. 900,000 habitants) and
a number of smaller cities into Manguaba lagoon.17 Crop
burning activities have been affecting the entire lower drainage basin and also Maceió city.
The PSR estuary is fed by the 1145 km long Paraíba do Sul River with a mean annual fresh water discharge of
868 m3 s-1 from a watershed of 55,400 km², with access
to the sea via a primary channel and a secondary channel
lined by mangroves (Figure 1). The climate at the coast is tropical humid with an average annual precipitation of 1100 mm and wet summer (October to March) and dry winter (April to September) seasons. The river crosses three of the most important and developed states of Brazil (São Paulo, Minas Gerais and Rio de Janeiro). It supplies water for more than 11 million people of Rio de Janeiro, but it is also used as waste disposal for a very large number of industries along its course. Other human impacts arise from domestic/industrial efluents upriver, partially retained by a cascade of dams. Along its lower course in the coastal plains, it is affected by point and diffuses sources of sugarcane practices and domestic efluents. Ground water contamination by sugarcane efluents has been detected and crop burning practices have notoriously been affecting the medium-sized Campos
dos Goytacazes City.18,19
Sample collection
A total of 25 sediment samples were collected from MMELS and 6 sediment samples were collected along the
PSR (Figure 1). The samples were collected only once per
site. Surface sediment samples (0-5 cm) were collected with a Van Veen type grab and kept in pre-cleaned aluminum foil containers. The sediments were kept in the refrigerator
at −20 ºC. Afterwards, they were sieved through 63 µm,
subjected to lyophilization, extracted and analyzed. Surface
sediment samples from PSR were collected in July 2006 and from MMELS in August 2006.
Chemical standards
Perdeuterated standard, pyrene-d10 98% was from
Cambridge Isotope Laboratories (Andover, MA, USA). The reference mixture of PAHs (EPA 610) was from Supelco,
Bellefonte, USA (part No. 4-8743) containing 100 mg L-1
of anthracene (Ant), benzo[a]anthracene (BaA), benzo[a] pyrene (BaP), benzo[k]fluoranthene (BkF), chrysene (Chry), indeno[1,2,3-cd]pyrene (InP), phenanthrene (Phen)
and pyrene (Py); 200 mg L-1 of benzo[b]luoranthene (BbF),
benzo[g,h,i]perylene (BghiP), dibenzo[a,h]anthracene
(DBA), luoranthene (Flt), luorene (Fluo); 1000 mg L-1
of acenaphthene (Ace) and naphthalene (Nap) and
2000 mg L-1 of acenaphthylene (Aceph). Perylene (Per)
standard was from Sigma (USA). All solvents used for sample processing and analyses (dichloromethane, hexane) were chromatographic grade from Tedia Brazil (Rio de Janeiro, Brazil).
Extraction and clean-up of samples
About 10 g of lyophilized sediment was submitted to extraction by ultrasonication in 50 mL of dichloromethane for 20 min. The sample was centrifuged, the dichloromethane was extracted and the extraction process repeated two more times. The extracts (organic fraction) were combined and concentrated in rotary evaporator. The organic fraction was concentrated and fractionated using about 2.5 g of activated silica gel column (silica activated at 120 ºC for 12 h). The column was eluted irst with 10 mL of hexane to obtain the aliphatic hydrocarbon fraction. Further elution was with 10 mL of hexane/dichloromethane (8:2) to obtain the
PAHs.11 All the extracts were concentrated, transferred to
an autosampler microvial (250 μL) and blow-down with
N2 to almost dryness. The PAH extracts were completed
to 100 μL with pyrene-d10 standard solution at 1 ng mL-1.
The standard solution was added to the samples just before
GC/MS analysis. This step was carried out only once per
site (n = 1).
Analytical methods
a DB-5, 30 m, 0.25 mm i.d., with a 0.25-μm ilm thickness (J & W Scientiic). The column temperature for all analyses
was programmed from 60 to 300 ºC at a rate of 6 ºC min-1
and held at 300 ºC for 15 min. The injector was heated at
290 ºC and 2 µL sample volume was injected. Helium was
used as carrier gas. Data acquisition was in electron impact (70 eV) and selected ion monitoring (SIM) mode was used. The standard PAH mixture was also analyzed in scan mode in the mass range of 50-400 Daltons. Two characteristic ions were selected for each parent PAH for their identiication in SIM mode analyses together with their retention times. Before analysis, relevant standards (reference mixture of PAHs) were run to check column performance, peak height and resolution. With each set of samples to be analyzed, a solvent blank and a standard mixture were run in sequence to check for contamination, peak identification and quantiication. Quality assurance procedures included control of the blank. This analytical method was validated and the
quantiication limit for PAHs was considered 0.1 ng g-1
based on previous studies.11 External standard calibration
curves were used for PAH quantiication of the extracts
in addition to the pyrene-d10 internal standard. Calibration
graphs for SIM mode were plotted using ive to six points
in the range of concentration 0.0025-4 µg mL-1 for the
standard solution mixture. The perylene calibration curve was constructed for quantiication using the same protocol.
TOC and TON
After removal of inorganic carbon by acidiication with
1 mol L-1 HCl, sediment samples were dried at 40 oC and
subsequently analyzed for total carbon and nitrogen with a Carlo Erba NA 2100 elemental analyzer. The samples
were oxidized at 1100 oC and the oxidation products were
transported by a carrier gas (He) through a reduction tube
where NOx was reduced to N2. After removing water
and halogens from the evolving CO2 and N2, the gases
were separated and quantiied by a thermal conductivity detector. The relative standard deviation for the method
was approximately 4.5%.20,21
Results and Discussion
Bulk organic composition of the sediments
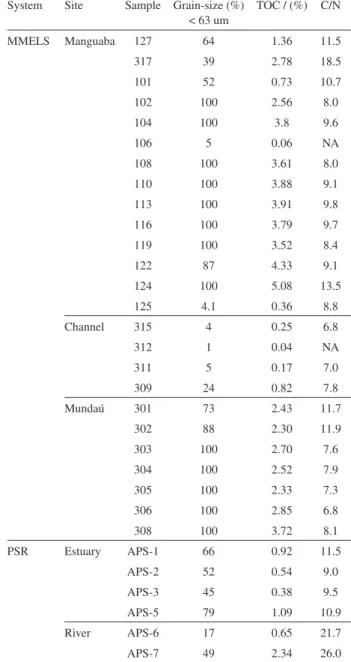
The variability and contends of sedimentary PAHs are also controlled by the grain-size content and the origin of particulate organic matter of the sediments. Some insight on the surface sediment characteristics may be obtained from Table 1, which depicts the contribution of the ine fraction < 63 μm, the content of total organic carbon (TOC) and C/N
ratios by weight. In general, the Manguaba and Mundaú lagoon compartments were near to entirely composed of ine organic-rich sediments with about 87 to 100% comprising of silt and clay. TOC concentrations from 2 to 4% relected the material retainer potential in the lagoons. A larger contribution of terrestrial materials to the organic matter was found in the river-lagoon interfaces (Stations A-127, A-317, A-101, A-301, A-302), and exhibited C/N ratios about 13 to 21. The Mundaú and Manguaba lagoons of MMELS may be classiied as highly organic-rich systems with C/N ratios varying from 7 to 10 in their central portion, suggesting the presence of autochthonous phytoplankton produced organic matter.
Table 1. TOC, C/N (by weight) obtained from the MMELS and PSR sediment
System Site Sample Grain-size (%) < 63 um
TOC / (%) C/N
MMELS Manguaba 127 64 1.36 11.5
317 39 2.78 18.5
101 52 0.73 10.7
102 100 2.56 8.0
104 100 3.8 9.6
106 5 0.06 NA
108 100 3.61 8.0
110 100 3.88 9.1
113 100 3.91 9.8
116 100 3.79 9.7
119 100 3.52 8.4
122 87 4.33 9.1
124 100 5.08 13.5
125 4.1 0.36 8.8
Channel 315 4 0.25 6.8
312 1 0.04 NA
311 5 0.17 7.0
309 24 0.82 7.8
Mundaú 301 73 2.43 11.7
302 88 2.30 11.9
303 100 2.70 7.6
304 100 2.52 7.9
305 100 2.33 7.3
306 100 2.85 6.8
308 100 3.72 8.1
PSR Estuary APS-1 66 0.92 11.5
APS-2 52 0.54 9.0
APS-3 45 0.38 9.5
APS-5 79 1.09 10.9
River APS-6 17 0.65 21.7
In contrast, the PSR sediments exhibited a mixture of ine and large grained sediments and TOC values were by a factor of 3 to 5 lower than MMELS, except at the outlet of the sugarcane factory with TOC at 2.34% (APS 7). The C/N ratios at stations APS 6 and APS 7 were 21.7 and 26.0, demonstrating the presence of vascular plant material
derived from the sugarcane efluents (e.g.,Vinasse). The
estuarine sediments exhibited C/N ratios between 11 and 13, indicating the presence of phytoplankton and some terrestrial plant and/or mangrove materials. It is of a general consensus, that phytoplankton and its fresh derived detritus have typical C/N ratios by weight between 6 and 10, whereas
vascular land plants have C/N ratios of 20 and greater.22
However, the bulk C/N ratios cannot identify the exact nature of the composition of organic matter in the sediments. For example, C/N values of vascular plant remains between 30 and 40 may form part of the organic matter pool, but the bulk C/N signature remain at 15 when phytoplankton materials play a role. In general, the cellulosic land plants are better preserved, whereas the phytoplanktonic material
is subject to enhanced degradation.23 The predominance
of ine organic-rich sediments with organic matter mainly derived from phytoplankton in MMELS, when compared with larger grained more organic-poor sediments with a higher contribution of terrestrial and/or mangroves materials in PSR, suggested that MMELS is more apt to degrade organic matter.
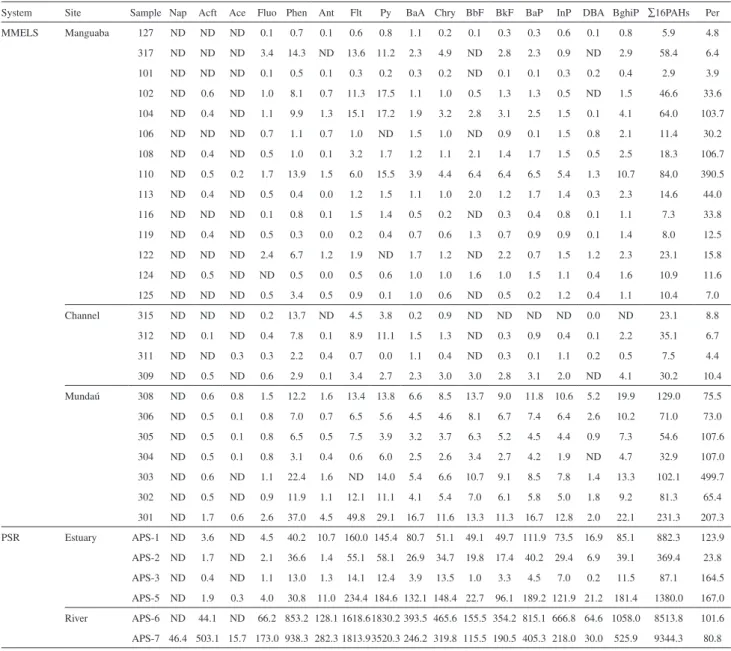
PAH concentrations
Quantitative results of PAH determination in sediments are shown in Table 2. Each system was subdivided. MMELS was divided into; 1) Manguaba lagoon, 2) Channel and 3) Mundaú lagoon. PSR was divided into; 1) Paraíba do Sul River and 2) Paraíba do Sul Estuary. The total PAH concentrations
(Σ16PAH) in the sediments ranged from 2.9 to 84.0 μg kg-1
in Manguaba lagoon and from 32.9 to 231.3 μg kg-1
in Mundaú lagoon. In the Channel the concentration ranged
from 7.53 to 35.1 μg kg-1. Despite the organic-rich nature
of the MMELS sediments (i.e., TOC 3-6% or more) and
the presence of different anthropogenic sources, the data lie in the same range as observed in many previous studies of other Brazilian embayments such as Angra dos Reis
(6.3-277.0 μg kg-1),1 São Sebastião (nd-257 μg kg-1)24 and
(20.4-200.3 μg kg-1),25 as well as, manifold other
sub-tropical and temperate systems, such as the Seine River and
estuary in France (4-36 μg kg-1),3 Gao Ping River in Taiwan
(8-356 μg kg-1),26 Caspian Sea in Russia (6-345 μg kg-1),13
and Xiamen Harbor in China (98-309 μg kg-1).27
In contrast to MMELS, the Paraíba do Sul Estuary
values were higher ranging from 87.1 to 1380.0 μg kg-1 and
in the upper two river sediments even attained 8513.8 and
9344.3 μg kg-1. The Paraiba do Sul Estuary results were in
the same range as Tampa Bay in USA (200-4300 μg kg-1),28
Arcachon Bay in France (900-4100 μg kg-1),4 Daliao
River in China (59.67-816.63 μg kg-1),8 Todos os Santos
Bay (8-4163 μg kg-1),29 and Guanabara Bay in Brazil
(91-8035 μg kg-1)30 and (77-7751 μg kg-1).11 The highest
PAH concentrations of the Paraiba do Sul River itself (Stations APS 6 and APS 7; Figure 1) were higher or in the
same range found for Santos Bay (79.6-15389.1 μg kg-1),31
Patos Lagoon (37.7-11779.9 μg kg-1)32, and Rodrigo de
Freitas Lagoon (405-11734 μg kg-1, including the alkylated
PAH)33 in Brazil, an elsewhere in the Persian Gulf Kuwait
dominated by petroleum reineries (1300-17500 μg kg-1),34
Santander Bay in Spain (20-344600 μg kg-1),35 and Dar es
Salaam in Tanzania (70.1-16474.3 μg kg-1).36
In general, sediments may be classiied as “highly contaminated” with total PAH concentrations beyond
500 μg kg-1, “moderately contaminated” at 250 μg kg-1
to 500 μg kg-1 of total PAHs, and “slightly contaminated” if
total PAHs are below 250 μg kg-1.14,37 All results observed
in MMELS were below 250 μg kg-1. However, in PSR, four
sites (including the two samples in the river) showed data
higher than 500 μg kg-1.
With respect to the individual PAHs in the sediments, the composition was different between both systems. In the PSR, Flt and Py showed the highest concentrations at all sites, except for station APS-3 with high concentration of perylene. On the other hand, MMELS exhibited a distinct pattern for the biogenic PAH perylene, with high concentrations at all sites, except for sites A-312 and A-315 in the Channel, dominated by Phen, Flt and Py. The APS-6
and APS-7 sites (8513.76 and 9344.29 μg kg-1, respectively)
in the Paraiba do Sul River located close to the point source of the industrial sugarcane processing plant (15 km upriver from the estuaries mouth) were governed by concentrations an order of magnitude higher, clearly indicating that its
organic overloaded efluents (e.g., Vinhasse) corresponded
to the main PAH source of the river and, after dilution, also the estuary itself.
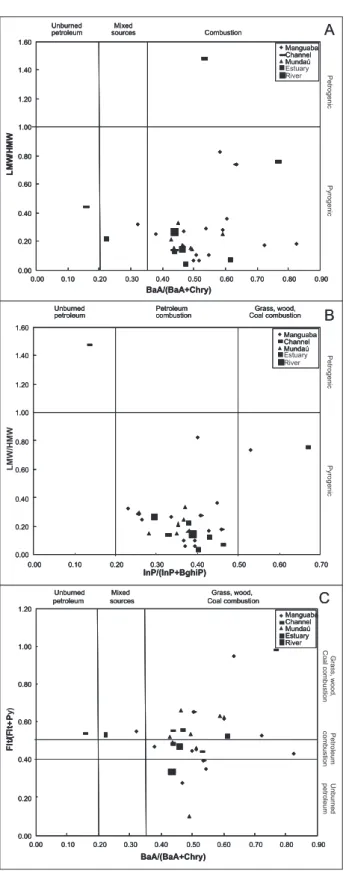
PAH source analysis
The PAH sources may be identified by individual PAH compound ratios based on the peculiarities in PAH composition and distribution patterns as a function
of the emission sources.8,15 The Ant/(Ant+Phen),
BaA/(BaA+Chry), Flt/(Flt+Py), InP/(InP+BghiP) ratios have been applied to distinguish petrogenic and pyrogenic
input.8,11,13,26,38 These ratios are based on differences in heat
processes are fast reactions that form less stable isomers (the kinetic product). Diagenesis favors the most stable isomer (the thermodynamic product) by increasing the time of
reaction.39 Petrogenic inputs show Ant/(Ant+Phen) values
lower than 0.10 and pyrogenic inputs exhibit higher values. BaA/(BaA+Chry) ratio of < 0.2 suggests petrogenic input, and a ratio of > 0.35 indicates pyrogenic processes, while a ratio between 0.2 and 0.35 is characteristic of combustion
process.38 Values of Flt/(Flt+Py) ratios less than 0.4
correspond to petroleum pollution, and higher than 0.5 are
characteristic of grass, wood or coal combustion.26 Whereas,
Flt/(Flt+Py) ratios between 0.4 and 0.5 are more related to liquid fossil fuel combustion such as vehicle and crude oil. When InP/(InP+BghiP) ratios show values lower than 0.20,
they highlight petroleum spill input; from 0.20 to 0.5 is characteristic of petrochemical fuel combustion and; values
higher than 0.5 indicate grass, wood and coal combustion.26
Petrogenic contamination is characterized by low molecular weight PAH predominance (LMW - two and tree aromatic rings), while the high molecular weight (HMW - four, ive and six rings) dominate in the pyrolitic origin. LMW/HMW
ratios lower than 1 indicate pyrogenic contribution.14
In our study, PAH isomeric ratios from sediments indicated the combustion process as the main source. BaA/(BaA+Chry) versus LMW/HMW ratios showed combustion and pyrogenic processes for PAHs in both systems, except at the Channel stations A-312 and A-315, the Manguaba lagoon station A-317 and at station APS-3 of
Table 2. PAH concentrations in MMELS and PSR sediments (µg kg-1, dry wt.)
System Site Sample Nap Acft Ace Fluo Phen Ant Flt Py BaA Chry BbF BkF BaP InP DBA BghiP ∑16PAHs Per
MMELS Manguaba 127 ND ND ND 0.1 0.7 0.1 0.6 0.8 1.1 0.2 0.1 0.3 0.3 0.6 0.1 0.8 5.9 4.8
317 ND ND ND 3.4 14.3 ND 13.6 11.2 2.3 4.9 ND 2.8 2.3 0.9 ND 2.9 58.4 6.4
101 ND ND ND 0.1 0.5 0.1 0.3 0.2 0.3 0.2 ND 0.1 0.1 0.3 0.2 0.4 2.9 3.9
102 ND 0.6 ND 1.0 8.1 0.7 11.3 17.5 1.1 1.0 0.5 1.3 1.3 0.5 ND 1.5 46.6 33.6
104 ND 0.4 ND 1.1 9.9 1.3 15.1 17.2 1.9 3.2 2.8 3.1 2.5 1.5 0.1 4.1 64.0 103.7
106 ND ND ND 0.7 1.1 0.7 1.0 ND 1.5 1.0 ND 0.9 0.1 1.5 0.8 2.1 11.4 30.2
108 ND 0.4 ND 0.5 1.0 0.1 3.2 1.7 1.2 1.1 2.1 1.4 1.7 1.5 0.5 2.5 18.3 106.7
110 ND 0.5 0.2 1.7 13.9 1.5 6.0 15.5 3.9 4.4 6.4 6.4 6.5 5.4 1.3 10.7 84.0 390.5
113 ND 0.4 ND 0.5 0.4 0.0 1.2 1.5 1.1 1.0 2.0 1.2 1.7 1.4 0.3 2.3 14.6 44.0
116 ND ND ND 0.1 0.8 0.1 1.5 1.4 0.5 0.2 ND 0.3 0.4 0.8 0.1 1.1 7.3 33.8
119 ND 0.4 ND 0.5 0.3 0.0 0.2 0.4 0.7 0.6 1.3 0.7 0.9 0.9 0.1 1.4 8.0 12.5
122 ND ND ND 2.4 6.7 1.2 1.9 ND 1.7 1.2 ND 2.2 0.7 1.5 1.2 2.3 23.1 15.8
124 ND 0.5 ND ND 0.5 0.0 0.5 0.6 1.0 1.0 1.6 1.0 1.5 1.1 0.4 1.6 10.9 11.6
125 ND ND ND 0.5 3.4 0.5 0.9 0.1 1.0 0.6 ND 0.5 0.2 1.2 0.4 1.1 10.4 7.0
Channel 315 ND ND ND 0.2 13.7 ND 4.5 3.8 0.2 0.9 ND ND ND ND 0.0 ND 23.1 8.8
312 ND 0.1 ND 0.4 7.8 0.1 8.9 11.1 1.5 1.3 ND 0.3 0.9 0.4 0.1 2.2 35.1 6.7
311 ND ND 0.3 0.3 2.2 0.4 0.7 0.0 1.1 0.4 ND 0.3 0.1 1.1 0.2 0.5 7.5 4.4
309 ND 0.5 ND 0.6 2.9 0.1 3.4 2.7 2.3 3.0 3.0 2.8 3.1 2.0 ND 4.1 30.2 10.4
Mundaú 308 ND 0.6 0.8 1.5 12.2 1.6 13.4 13.8 6.6 8.5 13.7 9.0 11.8 10.6 5.2 19.9 129.0 75.5 306 ND 0.5 0.1 0.8 7.0 0.7 6.5 5.6 4.5 4.6 8.1 6.7 7.4 6.4 2.6 10.2 71.0 73.0
305 ND 0.5 0.1 0.8 6.5 0.5 7.5 3.9 3.2 3.7 6.3 5.2 4.5 4.4 0.9 7.3 54.6 107.6
304 ND 0.5 0.1 0.8 3.1 0.4 0.6 6.0 2.5 2.6 3.4 2.7 4.2 1.9 ND 4.7 32.9 107.0
the Paraíba do Sul Estuary (Figure 2A). LMW/HMW versus
InP/(InP+BghiP) showed pyrogenic sources originated by petroleum combustion, where only one sample indicated
a petrogenic source (Figure 2B). On the other hand, BaA/ (BaA+Chry) versus Flt/(Flt+Py) showed grass, wood and coal combustion for many sites, although BaA/(BaA+Chry) pointed to overall combustion (Figure 2C). These three ratios indicated that combustion is the main source of PAHs in these two Brazilian estuarine systems dominated by the sugarcane crop industry. Ant/(Ant+Phen) ratio indicated a petrogenic source for some sites, but this ratio is not recommended, as Ant usually is a low abundant peak in the chromatographic proile, thus leading to analytical errors and dificulties in quantiication. The petrogenic contribution observed in some points of MMELS and PSR
is less evident than found in Rodrigo de Freitas Lagoon,33
located in the urban area of Rio de Janeiro City, Brazil. In general, no more than two PAH ratios are used to determine possible sources, as further ratios can lead to different and
ambiguous interpretations.37
Perylene is the main biogenic PAH found in sediments. It is formed by diagenetic transformation of marine
precursors40 and it is thought to be produced through in
situ conversion of perylenequinone pigment by fungi.41 The
perylene concentrations ranged from 4.8 to 499.7 μg kg-1.
These values were in the same range as rivers and an estuary
from Shanghai in China (nd-588 μg kg-1).42 The presence of
perylene above 10% of Σ16PAH has been indicated as an
important natural PAH contribution.9 However, perylene is
also formed by pyrolytic processes and could predominate
in polluted areas that have anthropogenic potential.32
All sites of MMELS showed perylene concentration
values higher than 10% of Σ16PAH. In the Paraiba do
Sul River (stations APS-6 and APS-7), the observed
perylene concentrations were 80.84 and 101.55 μg kg-1,
less than 10% of 8513.76 and 9344.29 μg kg-1 of Σ16PAH,
respectively. The analogous perylene concentration pattern observed for all sites in this study could be explained by the natural origin of this compound. As the Per concentrations detected lied in the same range, it may be assumed that the early diagenetic transformations were similar in all studied areas, except at the Channel of MMELS, where dilution processes with seawater occur. PAHs from the areas are mainly derived from sugarcane burning and/or also from vehicle emissions.
Conclusions
PAH concentrations for the studied sites were low in the Channel of MMELS, intermediate in Manguaba lagoon and high in Mundaú lagoon. The Paraíba do Sul estuary exhibited lower concentrations in comparison to its river sites (APS 6 and APS 7). In all, MMELS has lower concentrations in comparison to the PSR, which was
highly contaminated. PAH source analysis suggested the predominance of pyrogenic input in both systems. More than two criteria could be used, leading to the conclusion that the main PAH source in these two Brazilian estuarine-systems dominated by sugarcane crops is the combustion source. The PAH ratios also indicated a possible mixed
combustion source, e.g., from petroleum, grass, wood
and/or coal combustion. Emissions of vehicles and ishing boats are possible sources of petrogenic hydrocarbons. PAH ratios suggested that PAHs could be also produced by sugarcane burning.
Acknowledgments
The authors acknowledge CNPq, the Brazilian Research Council, for inancial support (Process No. 590002/2005-8) and fellowships. We also would like to thank all professors, particularly Paulo P. Medeiros from LABMAR-UFAL and Carlos E. Carvalho and Carlos E. Rezende from CBB-UENF, and the students and technical staffs from the POLCAMAR Project that contributed to this part of the work and Gertrud Spörl from ZMT-Bremen, Germany, that performed the TOC and TON analyses.
References
1. Azevedo,D. A.; Gonçalves, M. L.; Silva, D. B.; Environ. Forensics 2007, 8, 245.
2. Gao, X.; Chen, S.; Xie, X.; Long, A.; Ma, F.; Environ. Pollut.
2007, 148, 40.
3. Fernandes, M. B.; Sicre, M. A.; Boireau, A.; Tronczynski J.;
Mar. Pollut. Bull. 1997, 34, 857.
4. Baumard, P.; Budzinski, H.; Garrigues, P.; Mar. Pollut. Bull.
1998, 36, 577.
5. Countway, R. E.; Dickhut, R. M.; Canuel, E. A.; Org. Geochem.
2003, 34, 209.
6. Stout, S. A.; Uhler, A. D.; Ernsbo-Mattingly, S. D.; Environ. Sci. Technol. 2004, 38, 2987.
7. Cheollee, B.; Shimizu, Y.; Matsuda, T.; Matsui, S.; Environ. Sci. Technol. 2005, 39, 7402.
8. Guo, W.; He, M.; Yang, Z.; Lin, C.; Quan, X.; Wang, H.;
Chemosphere 2007, 68, 93.
9. Readman, J. W.; Fillmann, G.; Tolosa, I.; Bartocci, J.; Villeneuve, J. P.; Cattini, C.; Mee, L. D.; Mar. Pollut. Bull.
2002, 44, 48.
10. Beg, M. U.; Saeed, T.; Al-Muzaini, S.; Beg, K. R.; Al-Bahloul, M.; Ecotoxicol. Environ. Saf. 2003, 54, 47.
11. Silva, T. F.; Azevedo, D. A.; Aquino Neto, F. R.; J. Braz. Chem. Soc. 2007, 18, 628.
12. Azevedo, D. A.; Santos, C. Y. M.; Aquino Neto, F. R.; Atmos. Environ. 2002, 36, 2383.
13. Tolosa, I.; Mora, S.; Sheikholeslami, M. R.; Villeneuve, J. P.; Bartocci, J.; Cattin, C.; Mar. Pollut. Bull. 2004, 48, 44.
14. Soclo, H. H.; Garrigues, P. H.; Ewald, M.; Mar. Pollut. Bull.
2000, 40, 387.
15. Zhang, J.; Cai, L. Z.; Yuan, D. X.; Chen, M.; Mar. Pollut. Bull.
2004, 49, 479.
16. Oliveira, A. M.; Kjerfve, B.; Estuar. Coast. Shelf Sci. 1993, 37, 575.
17. Souza, W. F. L.; Machado, E. C.; Knoppers, B. A. In Estuarine Systems of the Latin American Region and Estuarine Systems
of the Arctic Region: Carbon, Nitrogen and Phosphorous
Fluxes; Camacho-Ibar, V.; Wulff, F.; Dupra, V.; Smith, S. V.;
Marshall-Crossland, J. I.; Crossland, C. J., eds.; Loicz Reports and Studies: Netherlands, 2002.
18. Knoppers, B. A.; Ekau, W.; Figueiredo, A. G.; Geo-Mar. Lett.
1999, 19, 171.
19. Carvalho, C. E. V.; Salomão, M. S. M. B.; Molisani, M. M.; Rezende, C. E.; Lacerda, L. D.; Sci. Total Environ. 2002, 284,
85.
20. Jennerjahn, T. C.; Ittekkot, V.; Klöpper, S.; Adi S.; Nugroho, S. P.; Sudiana, N.; Yusmal., A.; Prihartanto; Gaye-Haake, B.;
Estuar. Coast. Shelf Sci. 2004, 60, 503.
21. Baum, A.; Rixen, T.; Samiaji, J.; Estuar. Coast. Shelf Sci. 2007,
73, 563.
22. Meyers, P. A.; Leenheer, M. J.; Eadie, B. J.; Maule, S.; Geochim. Cosmochim. Acta 1984, 48, 443.
23. Meyers, P. A.; Org. Geochem. 1997, 27, 213.
24. Zanardi, E.; Bícego, M. C.; Miranda, L. B.; Weber, R. R.; Mar. Pollut. Bull. 1999, 38, 261.
25. Medeiros, P. M.; Bícego, M. C.; Mar. Pollut. Bull.2004, 49,
892.
26. Doong, R.; Linn, Y. T.; Water Res. 2004, 38, 1733.
27. Ou, S.; Zheng, J.; Zheng, J.; Richard, B. J.; Lam, P. K. S.;
Chemosphere 2004, 56, 107.
28. Sherblom, P. M.; Kelly, D.; Pierce, R. H.; Mar. Pollut. Bull.
1995, 30, 568.
29. Venturini, N.; Tommasi, L. R.; Mar. Pollut. Bull. 2004, 48, 97. 30. Meniconi, M. F. G.; Gabardo, I. T.; Carneiro, M. E. R.; Barbanti,
S. M.; Silva, G. C.; Massone, C. G.; Environ. Forensics 2002,
3, 303.
31. Medeiros, P. M.; Bícego, M. C.; Mar. Pollut. Bull.2004, 49, 761.
32. Medeiros, P. M.; Bícego, M. C.; Castelao, R. M.; Del Rosso, C. D.; Fillmann, G.; Zamboni, A. J.; Environ. Int. 2005, 31, 77.
33. Stefens, J.; Santos, J. H. Z.; Mendonça Filho, J. G.; Peralba, M. C. R.; J. Environ. Sci. Health,Part A 2007, 4, 399.
34. Fowler, S. W.; Readman, J. W.; Oregione, B.; Villeneuve, J. P.; Mckay, K.; Mar. Pollut. Bull. 1993, 27, 171.
35. Viguri, J.; Verde, J.; Irabien, A.; Chemosphere 2002, 48, 157. 36. Gaspare, L.; Machiwa, J. F.; Mdachi, S. J. M.; Streck, G.; Brack.,
37. Notar, M.; Leskovsek, H.; Faganeli, J.; Mar. Pollut. Bull. 2001,
42, 36.
38. Yunker, M. B.; McDonald, R. W.; Vingarzan, R.; Mitchell, R. H.; Goyette, D.; Sylvestre, S.; Org. Geochem. 2002, 33, 489.
39. Jeanneau, L.; Faure, P.; Montarges-Pelletier, E.; Ramelli, M.;
Sci. Total Environ. 2006, 372, 183.
40. Bouloubassi, I.; Fillaux, J.; Saliot, A.; Mar. Pollut. Bull. 2001,
42, 1335.
41. Jiang, C.; Alexander, R.; Kagi, R. I.; Murray, A. P.; Org. Geochem. 2000, 31, 1545.
42. Liu, Y.; Chen, L.; Jianfu, Z.; Qinghui, H.; Zhiliang Z.; Hongwen, G.; Environ. Pollut. 2008, 154, 298.
Received: November 3, 2009