Quim. Nova, Vol. 32, No. 6, 1647-1650, 2009
Nota Técnica
*e-mail: [email protected]
DETERMINATION OF NITRATE IN LETTUCE BY ION CHROMATOGRAPHY AFTER MICROWAVE WATER EXTRACTION
Humberto Brevilato Novaes, Delmo Santiago Vaitsman e Paulo Bechara Dutra
Insituto de Química, Universidade Federal do Rio de Janeiro, Av. Brig. Trompovsky, s/n, Cidade Universitária, 21949-900 Rio de Janeiro - RJ, Brasil
Daniel Vidal Pérez*
Empresa Brasileira de Pesquisa Agropecuária - Embrapa Solos, R. Jardim Botânico, 1024, 22460-000 Rio de Janeiro - RJ, Brasil
Recebido em 29/7/08; aceito em 25/2/09; publicado na web em 25/6/09
Lettuce is worldwide known as the most important vegetable. In this context, most farmers are searching new techniques for best quality products including hydropony. However, nitrate is of great concern, since it has a negative impact on human metabolism. The main objective of the present work was to evaluate the nitrate content of lettuce produced by conventional and hydroponic systems. The determination was conducted by ion chromatography and a new method of extraction was tested using microwave oven digestion. The results indicated that nitrate level produced in the conventional system was lower than in the hydroponic system.
Keywords: ion chromatography; microwave extraction; hydropony.
INTRODUCTION
Nitrate accumulation in plants is still a major concern worldwide, since it is known to be a threat to human health, mainly for infants.1-3 The conversion of nitrate to nitrite is implicated in the occurrence of methemoglobinemia, a disease that consists of a disturb in the oxygen transport system of the blood.4 Besides, nitrites are involved in the synthesis of nitrosamines that can cause gastric cancer.5
Different procedures and extractants have been used to extract nitrate from plant tissue. However, the extraction with water seems to be the more reasonable method of measuring its accumulation in vegetable crops since most of the nitrate occurs in the free form in the vacuoles.6,7 Notwithstanding, the temperature of extraction could be a factor of recovery variations.8 In that context, microwave extrac-tion could be a useful tool, as it does not involve the risk of sample contamination neither the mechanical or volatile loss of the analyte. Besides, it significantly reduces the time of sample preparation and hazardous waste.9,10
In Brazil, there is no official methodology to determine nitrate in food and the only legislation concerning its content was established for manufactured food (Portaria ANVISA nº 34, de 13/01/1998) at 250 mg kg-1.11 Besides, most of the methods tested in Brazil were very time and reagent consuming.12
This work aims to establish a suitable extraction and analytical determination of nitrate for plant tissues. A second objective of this work was to determine the nitrate levels in lettuces, one of the most consumed vegetables in Brazil, grown under both open-field and hydroponic conditions.
EXPERIMENTAL
Plant growth
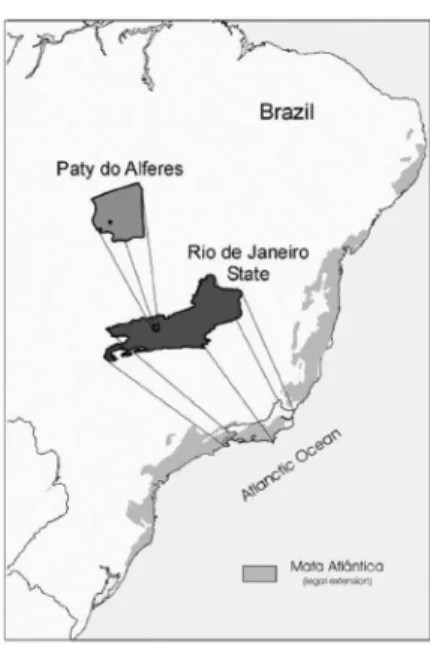
The experiment was conducted in Paty do Alferes County, in the mountains of Rio de Janeiro State, Brazil (Figure 1), a representa-tive area of intensive horticulture production. The Köppen climate
classification is Cw with average annual temperature of 18 °C and an annual average precipitation of about 1750 mm.
Lettuce seeds (Lactuca sativa L. “Regina”) were sown in cubes of phenolic foam of 6 cm3. After the germination of 800 seedlings, 500 of them were transferred to the soil, while the others 300 were transferred to tubes especially prepared for hydroponic cultivation.
In the nearby area of the greenhouse, 40 m2 was selected for the lettuce soil cultivation. Some characteristics of the top layer (0-20 cm) of the soil (Alfisol) used in this study were: pH = 6.6, Ca = 6.3 cmolc kg-1, Mg = 1.8 cmolc kg-1, K = 172 mg kg-1, P = 152 mg kg-1. Organic amendments and mineral fertilizers were applied based on soil analysis. It was used 10 g of a mixture composed of KCl and nitrocalcium (1:2) per plant in the cultivation plus 10 Mg ha-1 of composted manure. Two months later, another 10 g of the mixture KCl and nitrocalcium was applied.
Novaeset al.
1648 Quim. Nova
The technique used in the hydroponic system consisted of placing the lettuce seedlings in holes opened in PVC pipes, in which 2/3 of the roots of the plants are submerged in a laminar flow of nutrient solution, in a continuous way.
The composition of the nutrient solution was pH 6.8, Ca 86 mg L-1, Mg 40 mg L-1, K 158 mg L-1, P 26 mg L-1 and N 110 mg L-1. The salt accumulation was controlled indirectly, by measuring the specific conductivity of the nutrient solution, and had its higher acceptable limit established as 2.5 dm-1. The risk of salinity in the plants incre-ases when higher levels are used and this could lead to a complete loss of the production.
Daily average global radiation outside the greenhouse was 72 MJ m-2 and inside 40 MJ m-2; temperature average was 20 ºC; relative humidity was 50%, and plant density was 13 plants m-2.
During the day, the nutrient solution was supplied for 15 min in in-tervals also of 15 min. At night, it was supplied for 15 min at each 2 h.
Leaf sample preparation
All the water used throughout this study had a resistivity of 18 MΩ cm-1 and was obtained from a Millipore ultrapure water system after being double distilled. All plasticware was soaked in 10% HCl, and rinsed with ultrapure water before usage.
All leaf samples used in this study were briefly washed with distilled water, and dried in a forced-air oven at 65 °C for 48 h. The dried leaves were grounded in a Willey mill to pass a 1 mm sieve and they were stored in polyethylene bottles inside a vacuum type dissecator for further analysis.
At last, three homogenized groups were formed. One group con-tained 30 samples of lettuces (composite sampling) collected from the hydroponic cultivation without the substitution of the nutrient solution by water. The other group had the same number of plants and was obtained from the hydroponic cultivation with the substitution of the nutrient solution by water 12 h before harvesting. The last group also contained the same number of plants but was obtained from the soil cultivation.
Microwave experimental design
Presently, one of the procedures most used for the extraction of nitrate, in the chemical analysis of plants, consists in the use water at room temperature, under agitation, during 30 min. This proceeding, completely describe by Walinga and co-workers,13 is quite simple and practical when applied to few samples. However, to apply it in the routine of a laboratory with a large number of samples, the amount of magnetic agitators, space and time of extraction turn out to be relevant limitations. Thus, in order to supply and alternative method to the Walinga’s one, a new procedure was developed for extraction with water using the microwave oven.
Aiming to minimize the time and cost involved in the development of the new extraction procedures, the option was to make a factorial planning at two levels, a superior level, represented by (+) and an inferior level, represented by (-).
This type of planning, used when few influent variables exist in the system, allows obtaining information about the influence of each analyzed variable and its interactions. The number of experiences to be executed is established by n=2k, where k represents the number of variables of the system. For three variables (power, time and volume of extraction), eight different experiences were, thus, obtained.
A decisive factor in the building of the factorial planning is the choice of the variables and their levels that actually influence the system. The Digester DGT 100 Plus (Provecto Analítica), used for the water extraction has minimum power of 10 W and maximum
of 1000 W, with increments of 10 W. Then, an inferior level of po-wer (X1)was established where X1 equals 50 W as it is quite near to the equipment minimum power, and a superior level ten times greater. For the time of extraction variable (X2), the inferior level was established as being the minimum time allowed by the equi-pment program (1 min) and the superior level, five times greater. The volume of extraction (X3) had its levels established based on the volume of the vessel of extraction. Besides, it took into account safe recommendations adopted in the case where high temperature and pressure are to be used (up to 300 oC and 120 atm). Thus, the inferior level of 2 mL was chosen, since it was enough to cover the mass of sample to be extracted (100 mg), and the superior level was established as tree times it. Table 1 shows the planning and experiment matrix.
With the objective to verify the linearity of the system, besides the eight experiments established in the experiment matrix present on Table 1, an experiment was made at the central point, that is, at the point where the level of each variable is established as being the average of the superior (+) and inferior (–) levels of each variable.
This experience, which conditions are denominated nominal, was represented by (0,0,0) and realized also in eight replications. The experimental conditions were: power = 250 W; time = 3 min; volume = 4 mL.
The application of a factorial planning supposes that the ex-perimental errors are independent and constant in all region of the experiment. Thus, the nominal experiment (0,0,0) was used to obtain an estimate of the variance of the system.
After the analytical determinations, the effect of each variable and its interactions was analyzed through graphic and statistic calcu-lations. The conditions of extraction that showed results more close to the values found in the conventional method of extraction13 were chosen for the new method.
For the execution of the factorial planning experiments above described, the lettuce cultivated in open-field was chosen with three replicates.
Nitrate extraction
The procedures for the extraction were always done as follows: weight to the decimal of milligram, about 0.1 g of sample (eight re-plications) and transfer to digestion flasks of the microwave digester (DGT100 Plus, Provecto Analítica); add ultrapure water, at variable volumes, according to the experiment to be made (Table 1); adjust the power and time of extraction in the microwave digester, according to the experiment to be made (Table 1), and proceed the extraction; proceed the vacuum filtering in cellulose ester membrane of 0.45 µm pore washing with 5 portions of 3 mL of water; transfer to 50 mL graduated tubes and add water up to the 50 mL calibration mark.
Nitrate determination
Ion chromatography was employed since it has developed into a rapid and sensitive technique.14 Thus, an ion chromatography system (DX-100, Dionex) was used and the quantification was obtained by conductivity measurements. The operating parameters were: analytical column AS12A (4 mm) with guard column AG12A (4 mm); as eluent, a solution with 2.7 mmol L-1 Na
2CO3 and 0.3 mmol L-1 NaHCO
3; 1.5 mL min
-1 eluent flow rate; chemical suppression; sample loop volume of 10 µL.
Determination of nitrate in lettuce by ion chromatography 1649
Vol. 32, No. 6
achieve 5, 10, 15, 20 and 25 mg L-1 nitrate. The standards were prepared in triplicates and analyzed in the same chromatographic conditions.
The detection limit of a method is defined as the smallest amount of analyte that can be detected for a given level of confidence.15 The calculation of the limit of detection can be done in several ways. In this work, whereas the sign of the blank solution was almost immeasurable, we chose to calculate the detection limit from the standard deviation obtained for the lower level of concentration of the analytical curve, according to the equation:
where: LD = limit of detection; X1 = lower level of concentration of the analytical curve (0.5 mg L-1); y
m = average of all answer values obtained for X1; Sy1j = standard deviation of the response values.
Statistical analysis
An analysis of variance was used in order to test significance (P < 0.05) of treatment effects and Tukey’s test (P < 0.05) was used to compare the means. All statistical analyses were performed using Statistical Analysis System.16
RESULTS AND DISCUSSION
Effect of time, power and volume of extractant for the use of microwave extraction
In order to analyze and evaluate the effect of each of the selected factors for this study the graphic representation was used. That is the simplest form of representing results in the experimental space.
It can be observed in Figure 2 that, practically, there is no diffe-rence in the answer values. The highest value was obtained within the conditions of experiment 4 of the factorial planning (Table 1) and, the lowest was obtained in the nominal conditions (0,0,0). This suggested that the best conditions for nitrate extraction did not depend on the studied factors. However, it must be observed that the factor related to water volume showed consistent variations. As to say, independent of time and power, when the volume of extractant increased, there was a diminishing in the content of extracted nitrate.
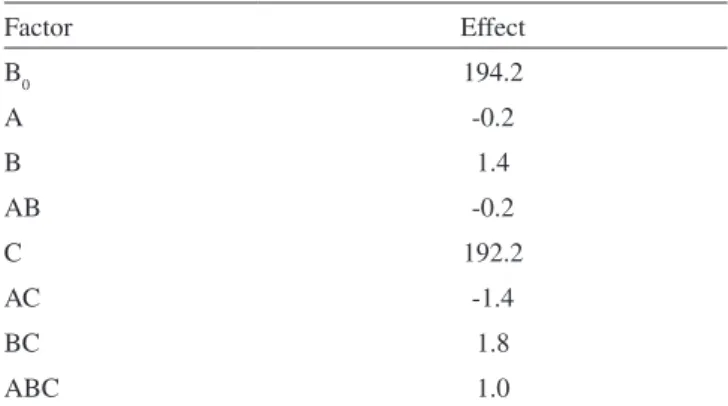
Another way to evaluate the effects of each variable and its interactions is through statistic calculation. In this work, the Yates method15 was used to calculate the effects and the results are presen-ted on Table 2. It can be observed that the volume of extraction was
the most significant factor, which confirms the observation obtained through the graphic evaluation of the factorial planning. However, considering the range of volumes used in these experiments (Table 1), the analysis of variance showed no significant differences in relation to the nitrate extraction with water in the microwave oven.
Microwave extraction versus conventional extraction
For this assay, the conventional methodology for extraction of anions13 was compared to the experiment made in nominal conditions (0,0,0) of the factorial planning. The results were, respectively, 22.6 ± 1.0 g kg-1 and 22.7 ± 0.5 g kg-1 nitrate in fresh matter and they do not differ significantly at 95% level of significance.
Limit of detection
In this work, the calculation of the limit of detection (LD) was made as of the deviation of the standard response values, obtained for the inferior concentration level of the analytical curve (0.5 mg L-1). In this sense, the detection limit obtained was 0.071 mg L-1 of nitrate, a satisfactory value.
Substitution of nutrition solution by water
Table 3 showed the results (three replicates and three injections per replicate) of average concentrations of nitrate in hydroponic lettuce samples, harvested in the sixth week of cultivation. One treatment referred to samples collected without substitution of nu-tritious solution per water and the other to samples collected 12 h
Table 1. Matrix of the factorial experiment using three variables and two levels
Experiment X1 = Power (w)
X2 = Time (min)
X3 = Volume (mL)
1 50 - 1 - 2
-2 500 + 1 - 2
-3 50 - 5 + 2
-4 500 + 5 + 2
-5 50 - 1 - 6 +
6 500 + 1 - 6 +
7 50 - 5 + 6 +
8 500 + 5 + 6 +
+ means superior level and – means inferior level.
Figure 2. Graphic solution of the tested factorial experiment based on the three factors at two levels plus the nominal condition (0,0,0). Results of nitrate (g
kg-1 dry matter) were obtained for soil cultivated lettuce samples
Table 2. Effects calculated by the Yates method for nitrate extraction
Factor Effect
B0 194.2
A -0.2
B 1.4
AB -0.2
C 192.2
AC -1.4
BC 1.8
ABC 1.0
Novaeset al.
1650 Quim. Nova
after the substitution of the nutritive solution per water. Those results were submitted to statistical evaluation by using the Tukey’s test, at 95% level of significance. It revealed that there were no significant differences among them. It is worth to emphasize that there was, also, no significant difference in the contents of the water obtained from the hydroponic cultivated lettuces, with and without substitution of water, and the relation dry/fresh matter of the first was equal to 0.039 an in the second was equal to 0.040.
Soil versus hydroponic cultivation
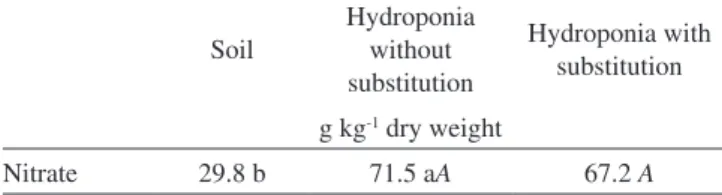
Table 3 also showed the average of nitrate concentration obtained for plants cultivated in soil (three replicates and three injections per replicate). The variance analysis and the Tukey’s test (P<0.05) showed that, in relation to nitrate, the plants cultivated via the hydroponic system presented significantly higher concentrations than those con-ventionally cultivated in soil. These results corroborated the findings of Guadagnin and co-workers.17 They studied three kinds of agricultural systems collecting samples in popular markets, during the years of 2001 and 2003, in Campinas (São Paulo, Brazil). And they also found that the hydroponic system produced the highest levels of nitrate in lettuce. It is worth highlight that there was, also, no significant difference in the content of water obtained in the soil or hydroponic cultivated lettuces in the present work. The relation between dry/fresh matter of the first equal to 0.041 and of the second equal to 0.039.
Despite the fact that the nitrate levels of the hydroponic lettuce is statistically higher than that of the lettuce cultivated in soil, this value was lower than the maximum allowed by European Communities18 for nitrate in vegetables (2500-4500 mg kg-1 NO
3
-in fresh matter).
CONCLUSIONS
The extraction of nitrate with water does not depend on the mi-crowave factors studied, i.e., power, time and volume of extractant. The extraction of nitrate with water does not depend of the extraction method used, that is, without heating or with microwave heating.
The performance parameters and criteria used in the evaluation of the quantification method allowed to statistically guarantee that the ion chromatography is a rapid and efficient option to determine de nitrate in samples of leaf tissue.
Table 3. Contents of nitrate in lettuce cultivated in soil and hydroponia with and without substitution of the nutritive solution per water
Soil
Hydroponia without substitution
Hydroponia with substitution g kg-1 dry weight
Nitrate 29.8 b 71.5 aA 67.2 A
Averages followed by different letters of the same format are sta-tistically different according to Tukey’s test (P < 0.05).
The accumulation of nitrate in hydroponic lettuce is significan-tly higher than in the soil conventionally cultivated one. However, considering the conditions of the present work, it does not represent a risk to human health.
The substitution of the nutrition solution per water, 12 h prior to harvest, did not cause significant changes in the contents of nitrate in the hydroponic cultivated lettuce.
ACKNOWLEDGEMENTS
The authors wish to express their gratitude to CNPq and FAPERJ for the grants and to Mr. H. Watanabe and family for the support in developing the cultivation in their farm.
REFERENCES
1. World Health Organization; Environmental Health criteria 5 -Nitrates,
nitrites and N-nitrosocompounds, WHO: Geneva, 1977.
2. Sanchez-Echaniz, J.; Benito-Fernandez, J.; Mintegui-Raso, S.; Pediatrics
2006, 107, 1024.
3. Greer, F. R.; Shannon, M.; Krebs, N. F.; Baker Jr., R. D.; Pediatrics
2005, 116, 784.
4. Hardisson, A., Gonzáles Padrón, A.; Frías, I.; Reguera, J. I.; J. Food
Comp. Anal.1996, 9,13.
5. Walters, C. L. In Nitrates and nitrites in food and water; Hill,M. J., ed.; Ellis Horwood: Chichester, 1991, cap. 3.
6. Warner, R. L.; Kleinhofs, A.; Physiol. Plant. 1992, 85, 245.
7. Chen, B.-M.; Wang, Z.-H.; Li, S.-X.; Wang, G.-X.; Song, H.-X.; Wang, X.-N.; Plant Sci.2004, 167, 635.
8. Grunau, J. A.; Swiader, J. M.; Commun. Soil Sci. Plant Anal.1986, 17, 321.
9. Jassie, L. B.; Kingston, H. M. In Introduction to microwave sample
preparation; Kingston, H. M.; Jassie,L. B., eds.; American Chemical
Society: Washington, 1988, cap. 1.
10. McMullen, S. E.; Casanova, J. A.; Gross, L. K.; Schenck, F. J.; J. AOAC Int.2005, 88, 1793.
11. http://e-legis.anvisa.gov.br/leisref/public/showAct.php?id=67&word=, accessed July 2008.
12. Mantovani, J. R.; Cruz, M. C. P. da; Ferreira, M. E.; Barbosa, J. C.; Pesq.
Agropec. Bras. 2005, 40, 53.
13. Walinga, I.; van der Lee, J. J.; Houba, V. J. B.; van Vark, W.; Novozam-13. Walinga, I.; van der Lee, J. J.; Houba, V. J. B.; van Vark, W.; Novozam-sky, I.; Plant analysis manual, Kluwer: Dordrecht, 1995.
14. Masson, P., Hilbert, G.; Plenet, D.; J. Chromatogr.,A1996, 752, 298. 15. Massart, D. L.; Vandegiste, B. G. M.; Buydens, L. M. C.; Jong, S. de;
Lewi, P. J.; Smeyers-Verbecke, J.; Handbook of Chemometrics and
Qualimetrics: Part A, Elsevier: Amsterdam, 1997.
16. SAS; SAS System for Windows, v.9.1.3 Service Pack 3, SAS Institute Inc.: Cary, 2003.
17. Guadagnin, S. G.; Rath, S.; Reyes, F. G. R.; Food Addit. Contam.2005,
22, 1203.