Article
J. Braz. Chem. Soc., Vol. 22, No. 7, 1246-1252, 2011. Printed in Brazil - ©2011 Sociedade Brasileira de Química 0103 - 5053 $6.00+0.00
A
*e-mail: [email protected]
Determination of Etimicin in Rat Plasma using 9-Fluorenylmethyl Chloroformate
Precolumn Derivatization by HPLC with Fluorescence Detection
Xiaojuan Chang and Zhengping Yu*
Key Laboratory of Electromagnetic Radiation Protection, Department of Occupational Health, Faculty of Preventive Medicine, Third Military Medical University, Chongqing 400038, People´s Republic of China
Um método novo e sensível foi desenvolvido para a determinação de etimicina (ETM) utilizando pré-coluna de derivatização (PCD) com 9-luorenilmetilcloroformiato (FMOC-Cl) por separação de fase reversa e subsequente detecção por luorescência. As condições PCD foram todas otimizadas para o menor limite de detecção. A separação cromatográica foi efetuada em uma coluna Agilent XDB-C8 a 25 oC, velocidade de luxo de 1,0 mL min-1 e fase móvel acetonitrila/água
(87:13, v/v). O derivativo etimicina-FMOC-Cl foi monitorado por detecção de luorescência a
λexcitação 265 nm e λemissão 315 nm. Neomicina, um composto de estrutura similar ao ETM foi usado como padrão interno. A avaliação estatística do método foi examinada, mostrando-se preciso e exato com um intervalo de linearidade de 0,038-9,69 µg mL-1 (r > 0,9994). Os estudos de precisão
intra- e inter-dia mostraram boa reprodutividade com desvio padrão médio (R.S.D.) menor que 5%, e recuperação de 97,80-100,09 % (n = 3). O limite de detecção (LOD) e o limite inferior de quantiicação (LLOQ) em plasma foram 0,01 e 0,02 µg mL-1, respectivamente. Um volume de
50 µL de plasma foi suiciente para detecção de etimicina. O método estabelecido fornece um método bionalítico coniável para a farmacocinética de etimicina em plasma de rato.
A new and sensitive method was developed for the determination of the etimicin (ETM) using precolumn derivatization (PCD) with 9-luorenylmethyl chloroformate (FMOC-Cl) by a reversed phase separation and subsequent luorescence detection. The PCD conditions were fully optimized towards the lowest limit of detection. The chromatographic separation was carried out on an Agilent XDB-C8 column at 25 oC using a constant low rate of 1.0 mL min-1 and mobile phase of acetonitrile/water
(87:13, v/v). The etimicin-FMOC-Cl derivative was monitored by luorescent detection at
λexcitation 265 nm and λemission 315 nm. Neomycin (NMC), a similar base structure compound with ETM, was used as an internal standard. The statistical evaluation of the method was examined and the method was found to be precise and accurate with a linearity range of 0.038-9.69 µg mL-1
(r > 0.9994). The intra- and inter-day precision studies showed good reproducibility with relative standard deviation (R.S.D.) less than 5%, and the relative recovery was 97.80-100.09 % (n = 3). The limit of detection (LOD) and lower limit of quantiication (LLOQ) in plasma were 0.01 and 0.02 µg mL-1, respectively. A volume of 50 µL of plasma was suficient for the determination of
etimicin. The established method provides a reliable bioanalytical method to carry out etimicin pharmacokinetics in rat plasma.
Keywords: high-performance liquid chromatography, 9-luorenylmethyl chloroformate,
derivatization, etimicin, pharmacokinetic
Introduction
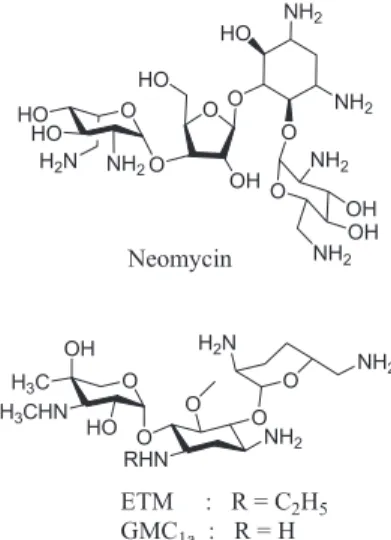
Etimicin (ETM) is mainly used as the sulfate and the fourth-generation aminoglycoside antibiotics, which is all water soluble aminoglycoside derived from gentamycin C1a
(Figure 1).1 It is widely used in human and veterinary
medicine against both Gram-positive and Gram-negative
bacterial infections, including resistant strains to other aminoglycosides.2-5 ETM has maintained and strengthened
the advantages of former aminoglycoside antibiotics and reduced its toxicity. The oto- and nephro-toxicity of ETM are substantially lower than those of other aminoglycisides antibiotics, such as netilmicin.3,4 Otherwise, ETM also
be seen, like many other aminoglycosides, ETM lacks a suitable chromophore for UV or luorimetric detection. But a wide variety of methods for the bioanalysis of aminoglycoside antibiotics in biological samples has been investigated over the years, including resonance Rayleigh scattering spectra,6 microbiological assay,7
immunoassays,8,9 capillary electrophoresis,10,11 thin
layer chromatography,12 gas-liquid chromatography,13
and high-performance liquid chromatography (HPLC) with detection of evaporative light scattering,14,15 pulsed
electrochemical16-19 and mass spectrometry,20-22
high-performance liquid chromatography with precolumn23-31
and post-column derivatization32 methods. ETM has a
structure of aminoglycoside and the methods mentioned above should also be applicable for it. Among these methods, microbiological assay is not able to distinguish between the main components and the impurities in the drug. Reversed-phase liquid chromatography with pre-column derivatization with o-phthalaldehyde (OPA)25 and with 1-luoro-2,4-dinitrobenzene,28 in which derivatized
etimicin was used as internal standard, has been described. However, no liquid chromatograph method has been described to analyze etimicin sulfate as a drug substance and to study the research on the pharmacokinetics. The lower limit of quantiication (LLOQ) of vertilmicin was 0.5 µg mL-1 for the determination in rat serum and not
referred to LLOQ of ETM. Evaporative light-scattering detection (ELSD)15 is prescribed for the determination of
ETM content, LC-pulsed amperometric detection (PAD)33
is also prescribed in the determination of ETM purity and content. Liquid chromatography with pulsed electrochemical detection34 also determined ETM content, being not able to
determine possible pharmacokinetics in the body, either. Moreover, a volatile mobile phase is required for ELSD
detection, which is low sensitive in detection. Up untill now, the research on the pharmacokinetics of ETM in the body by HPLC with luorescence detection has not been reported yet.
In the present study, a simple, stable, sensitive and validated HPLC method using luorescence detection for the determination of ETM in plasma post-inhalation is proposed. The precolumn derivatization (PCD) was made with 9-luorenylmethyl chloroformate (FMOC-Cl) that reacts with the fourth-generation groups of ETM under mild conditions to form a highly luorescent and stable derivative. The method was also successfully applied for a pharmacokinetic study.
Experimental
Reagents and chemicals
ETM and neomycin (NMC used as an internal standard) were purchased from Sigma Chemical (MO, USA). The 9-luorenylmethyl chloroformate (FMOC-Cl, 98%) was purchased from J&K Chemical Ltd. (Beijing, China). All solvents used in this study were of HPLC grade and purchased from Kermel Company (Tianjin, China). Potassium chloride, potassium hydroxide and boric acid were purchased from Chongqing Chemical Reagent Co. Water was glass-double distilled and further puriied for HPLC with a Millipore SZ-93 system (Shanghai Yarong Biochemical apparatus Co.).
Apparatus
The chromatographic system (Agilent 1100 series HPLC) (Agilent Technologies, CA, USA) consisted of an Agilent G1311A QuatPump fitted with a G1322A Degasser and a column oven. The detector used in the experiment was an Agilent G1321A FLD. The separation was performed on an Agilent XDB-C8 (particle size 5 µm, 150 × 4.6 mm i.d.) column (Agilent Technologies, CA, USA) with a mixture of water- acetonitrile (13:87, v/v) as mobile phase. The mobile phase was iltered through a 0.22 µm pore size membrane ilter before use. The column oven temperature was set at 25 oC and the low rate was
1.0 mL min-1. Fluorescence detection wavelengths were
set at λ
excitation 265 nm and λemission 315 nm. The pH value of
solution was measured using a Mettler Toledo Delta 320 m (Mettler-Toledo, Shanghai, China).
Solutions
The derivatization reagent consisted of 10 mmoL L-1
FMOC-Cl in acetonitrile. Borate buffer solution
(0.2 mmoL L-1) was irstly prepared by dissolving 1.25 g
boric acid and 1.50 g potassium chloride in 100 mL water and then adjusted the pH from 6.5 to 8.5 with 0.2 mmoL L-1
potassium hydroxide solution. Etimicin and neomycin were dissolved respectively in ultrapure water as stock standard solution (1 g L-1) and (0.54 g L-1), respectively. These
solutions were all stored at 4 oC before use.
Sample preparation and precolumn derivatization
A volume of 50 µL of rat plasma was mixed with a 25 µL of internal standard solution (0.216 mg mL-1 NMC)
and 150 µL of acetonitrile. The solution was vortex-mixed for 50 s and centrifuged for 15 min at 12000 × g. An aliquot of 50 µL of the clear supernatant was adjusted to optimal pH by the addition of 50 µL of borate buffer (0.2 mmoL L-1
in water, pH 7.3) and derivatized with 50 µL FMOC-Cl (10.05 µg mL-1 in acetonitrile) and then brief mixing for
10 s on a vortex mixer. The samples were kept at ambient temperature for 35 min. A volume of 20 µL of the reaction mixture was injected into the HPLC system.
Method validation
Assay speciicity
The speciicity of the method was demonstrated by comparing chromatograms of ive independent plasma samples from rats, each as a blank and a spiked sample.
Calibration and calculation procedure
Standard calibration curve was constructed by spiking drug free plasma with a known amount of ETM in the concentration range of 0.038-9.69 µg mL-1. The plasma
standards were also used to determine the intra- and inter-day precision and accuracy of the method. The concentration of ETM was calculated through the ratio between the peak areas of ETM and internal standard. Calibration curve was obtained by plotting the peak area ratios on the abscissa and the respective drug concentrations ratios between ETM and internal standard on the ordinate. The unknown samples concentrations were calculated from the linear regression equation of the peak area ratio against concentrations ratio of the calibration curve.
Precision and accuracy of the assay
The precision was deined as the relative standard deviation (R.S.D.) calculated using quality control samples (n = 5). The accuracy was deined as the relative error (RE) of the mean of QC samples (n = 5) from the theoretical concentrations. In order to evaluate the intra-day precision
and accuracy, ive replicate samples of each concentration of QC samples were analyzed in the same day. The inter-day validation was evaluated on the QC samples of different days. Intra- and inter-day assays were assessed using ive spiked serum samples at each concentrations of 0.15, 3.64 and 7.27 µg mL-1.
Relative recovery and analyte stability
The relative recoveries of ETM and neomycin from plasma were determined in the following text. Five samples for each concentration were processed as described previously. Relative recovery was obtained by comparing the peak area of ETM of the extracted samples with which calculated from the calibration curve.
The stability of ETM in rat plasma was determined at short-term stored in refrigerator (4 oC) for 0-24 h,
long-term storage at –20 oC for 1, 3, 5, 8 and 10 days and
freeze-thaw cycles for two cycles, respectively. To estimate the stability of derivatized solutions, the derivatized ETM and the internal standard solutions were assayed over a period of 24 h.
Application of the method
The female rats were fasted overnight with a free access to water for at least 12 h before the experiment. The average weight of those rats was 164.2 g. The drug was administered to the rats following the clinical administration. The established analytical method was used to investigate the proile of ETM, after intravenous injection of 30 mg kg-1 ETM to ive Wistar rats via the tail
vein. After administration, 0.2 mL of blood was collected at the time intervals of 0, 0.25, 0.5, 0.75, 1, 1.5, 2, 4, 6, 8 and 12 h post-dosing. The plasma was immediately separated by centrifugation at 3000 × g for 10 min and stored at −20 oC
until analyzed. The plasma concentration-time curves of ETM in rats were plotted.
Results and Discussion
Chromatographic separation and speciicity
the FMOC reacts speciically and rapidly with primary and secondary amines, such as ETM (Figure 3). Furthermore, luorometric detection has the advantage of being easily implementable in a routine laboratory.
The selectivity of the method was studied by spiking standard ETM solutions with other aminoglycoside antibiotics (tobramycin, netilmicin, kanamycin and gentamicin). The spiked plasma was treated and analyzed as described previously. No chromatographic interference from these drugs was observed. This indicates that the proposed method is speciic and feasible for the analysis of ETM in plasma for therapeutic drug monitoring.
Optimization of the reactions
ETM react with FMOC-Cl under alkaline conditions to form amino derivatives. In addition, FMOC-Cl undergoes hydrolysis to produce FMOC-OH. These reactions are shown in Figure 3.30 The derivatization and hydrolysis
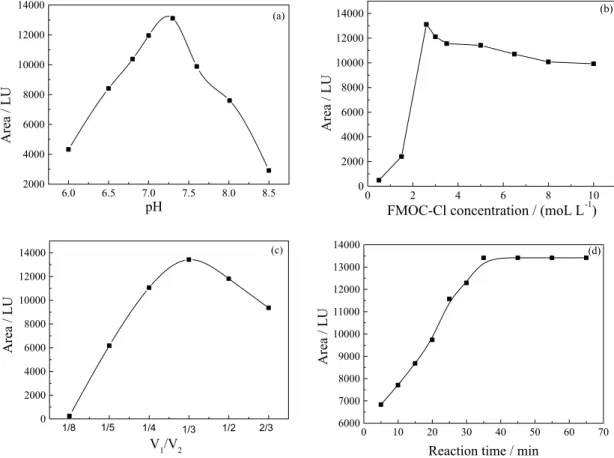
reactions are influenced by factors, such as pH, the FMOC-Cl concentration and volume, addition sequence of reagents, temperature and reaction time. The effect of these parameters was studied by the batch method using HPLC. The results were shown in Figure 4.
The buffer was used to keep the drugs in dissociative form in order to retain their nucleophilic character. The inluence of pH on the ETM absorbable intensity of the peak area (A) was investigated. In this paper, borate buffer solution was selected to control the pH of analytical system. The effect of the buffer pH was investigated in the pH range from 6.5 to 8.5. For pH > 7.5, the hydrolysis of FMOC-Cl is considerably higher than at lower pH values. For pH < 7 the derivatization time for ETM was too long. Thus pH 7.0-7.5 was chosen for derivatization and a borate buffer was used to maintain this constant pH. The suitable amount of buffer solution for determination ETM was 30-100 µL. The optimum content of buffer solution for the determination of ETM was 50 µL.
As the hydrolysis of FMOC-Cl depends on its concentration, measurements were made keeping its initial concentration constant and varying the ETM concentration. The effect of FMOC-Cl concentration was studied over a range of 1.93-38.65 µg mL-1. When dosage of the FMOC-Cl
is lower than 10.05 µg mL-1, the reaction is incomplete,
however, when dosage of the FMOC-Cl is higher more than 19.32 µg mL-1, superluous FMOC-Cl would hydrolyze
and the hydrolyzing product of FMOC-Cl can disturb other peaks. So, the results showed that the optimum concentration amount of FMOC-Cl was 10.05 µg mL-1 for
determination of ETM (Figure 4 b)
It was important to maintain the volume of the FMOC-Cl solution (V1) in reaction mixture. When the total solution
volume (V2) was ixed, the ratio of V1/V2 was varied from 1/8 to 2/3 and the ratio of 1/3 was found to be the optimum.
Adding sequence was investigated. The experiments indicated that the addition sequence of reagents affected the peak area (A), and the order of plasma, ETM, NMC, buffer solution and FMOC-Cl was the best.
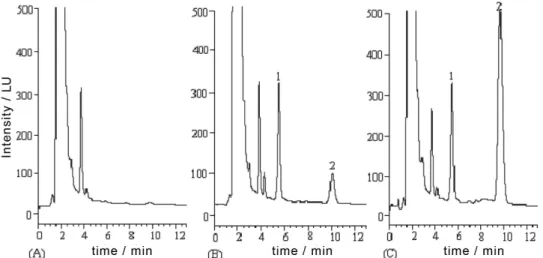
Figure 2. Representative chromatograms of the FMOC-Cl-derivatized products: (A) A blank rat plasma sample, (B) a blank rat plasma sample spiked with ETM (concentration at 0.303 µg mL-1) and the internal standard (concentration at 3.27 µg mL-1) and (C) a rat plasma sample 2.0 h after intravenous
administration of 30 mg kg-1 ETM. Peaks 1 and 2 refer to the FMOC-Cl-derivatized products of the internal standard and ETM, respectively.
The effect of temperature was studied over a range of 15-40 oC, and the results showed that the optimum
temperature was kept at ambient temperature (about 25 oC)
for determination of ETM.
Under the optimum condition, the effect of reaction time on the peak area (A) was investigated. The results showed that the peak area (A) reached a maximum at 35 min after all the reagents added. So in this study, the peak area (A) was recorded after 35 min in order to make ETM, NMC and FMOC-Cl interacted completely.
Sensitivity and linearity
The standard calibration curves were linear over the concentration ranges of 0.038-9.69 µg mL-1. The linear
regression equation was obtained as follows: y = 1.0175 x + 0.0982, r = 0.9994; where y is the peak area ratio of the derived ETM to derived internal standard, x represents concentration ratio of ETM to the internal standard and r is the correlation coeficient. The data indicate good linearity of the proposed method. The limit of detection (LOD) was investigated when the peak height was three times more than the background noise. The lower limit of quantiication (LLOQ) was deined as the lowest concentration on the
calibration curve (S/N = 10).35 The detection limit of ETM
was 0.01 µg mL-1 and LLOQ of ETM was 0.02 µg mL-1 for
the determination of ETM in rat plasma.
Precision, accuracy, recovery and stability
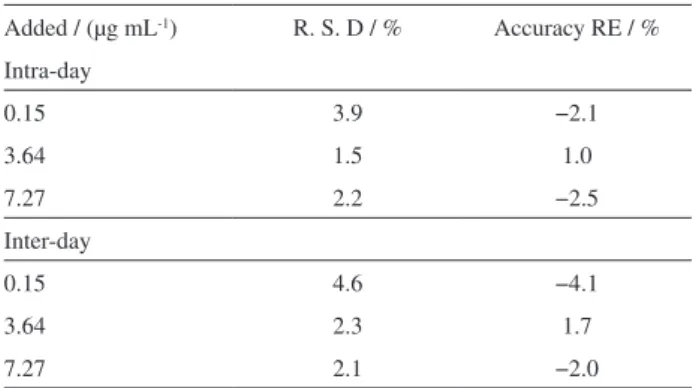
Table 1 summarizes the intra- and inter-day precision and accuracy for ETM from QC samples. In this assay, the intra-batch and inter-batch precisions were less than 5.0% for the drug at the three concentrations tested. These data suggested that the method were accurate and reproducible for the determination of ETM in rat plasma. The relative recoveries of ETM, at concentrations of 0.15, 3.64 and 7.27 µg mL-1 were 97.8 ± 3.8, 100.0 ± 2.5 and 99.8 ± 4.8%,
respectively (Table 2). The relative recovery of the internal standard was determined at the concentration used in the assay procedure and was found 95.6 ± 4.6%. The plasma samples were assayed under three different conditions to assess the stability of ETM in plasma samples. All stabilities were assayed at three concentration levels (low, medium, high). In short-term stability test, samples were stored in refrigerator (4 oC) for 0-24 h, the assay was
performed at 0, 2, 4, 8, 12 and 24 h, and the results showed 98.0-102.1% of initial content of ETM was recovered.
Conclusion
In conclusion, the current method appeared to be precise, rapid and sensitive for the determination of ETM in rat plasma. In this method, the reaction of the drug with FMOC-Cl is rapid and stable derivative is produced, the procedure is easy to perform. Besides, our method involves small sample volume (50 µL), short time of analysis (13 min) and a simple sample extraction and clean-up as compared to the previously published methods. Further studies are ongoing in our laboratory to characterize the transporters involved and their role in absorption of ETM.
Acknowledgments
The authors are grateful to the support of the Key Laboratory of Electromagnetic Radiation Protection, Third Military Medical University.
References
1. Xi, L. L.; Wu, G. F.; Zhu, Y.; J. Chromatogr. A 2006, 1115, 202.
2. Adams, E.; Pueling, D.; Rafiee, M.; Hoogmartens, J.;
J. Chromatogr. A 1998, 812, 151.
3. Liao,Y. A.; Dai, S. H.; Chin. J. Antibiotics 1995, 20, 198. Table 3. Pharmacokinetic characteristics of ETM in the plasma of healthy rats (n = 5), that were administered a intravenous injection dose of 30 mg kg-1
ETM pharmacokinetic parameter values (mean ± S.D.)a
AUC0–∞ / (µg h mL-1) 54.41 ± 8.05
CLtot / (mL h-1) 0.55 ± 0.08
Vd / L 2.89 ± 0.45
K10 / h-1 0.19 ± 0.03
t1/2 / h 6.87 ± 1.48
aEach value represents the mean ± S.D. of ive experiments.
Table 2. Therelative recovery of ETM from plasma (n= 3)
Sample Concentration / (µg mL
-1)
Recovery / % Added Found (mean ± S.D.)
LQC 0.15 0.146 ± 0.01 97.8
MQC 3.64 3.64 ± 0.04 100.0
HQC 7.27 7.25 ± 0.01 99.8
Figure 5. The average plasma concentration-time proile of the ETM after intravenous administration of 30 mg kg-1 to ive Wistar rats.
Long-term stability was studied by assaying samples after 1, 3, 5, 8 and 10 days of storage (−20 oC), 97.7-103.6%
of initial content of ETM was recovered. The stability of freeze–thaw cycles was done over two cycles at −20 oC,
95.2-105.9% of initial content of ETM was detected. The previous stability tests demonstrated that those analytes were stable under these conditions.
Application of the analytical method in pharmacokinetic studies
This validated method was applied in monitoring the plasma concentration of ETM in rats that were administered an intravenous injection dose of 30 mg kg-1. The main
pharmacokinetic parameters of ETM, calculated by non-compartmental analysis, were as follow: the elimination half-life (T1/2) was 1.87 ± 0.28 h, elimination rate constant (K) was 0.19 ± 0.03 h-1, the area under the curve (AUC
0–∞) was 54.41 ± 8.32 µg h mL-1, the volume of distribution
(Vd) was 2.89 ± 0.45 L, the initial plasma concentration
(C0) was 10.38 ± 1.64 µg mL-1 and total clearance (CL tot)
was 0.55 mL h-1. Therefore, this method had adequate
sensitivity for the determination of ETM in rat plasma. The pharmacokinetic parameters derived from these data are presented in Table 3. The mean (± S.D.) plasma concentration–time proile of ETM in rats (n = 5) is shown in Figure 5. By monitoring the plasma concentration of ETM, it was found that it decreased gradually, and ETM was primarily metabolized via original shape and almost completely inished in 12 h.
Table 1. Intra- and inter-day accuracy and precision of ETM determination at three concentration levels (n = 5)
Added / (µg mL-1) R. S. D / % Accuracy RE / %
Intra-day
0.15 3.9 −2.1
3.64 1.5 1.0
7.27 2.2 −2.5
Inter-day
0.15 4.6 −4.1
3.64 2.3 1.7
4. Šoltés, L.; Biomed. Chromatogr. 1999, 13, 3.
5. Shawar, R. M.; MacLeod, D. L.; Garber, R. L.; Burns, J. L.; Stapp, J. R.; Clausen, C. R.; Tanaka, S. K.; Antimicrob. Agents Chemother. 1999, 43, 2877.
6. Yi, A. R.; Liu, Z. F.; Liu, S. P; Hu, X. L.; J. Lumin. 2009, 24, 23. 7. Sabath, L. D.; Casey, J. I.; Ruch, P. A.; Stumpf, L. L.; Finland,
M.; J. Lab. Clin. Med. 1971, 78, 457.
8. Andrews, J. M.; Wise, R.; J. Antimicrob. Chemther. 1984, 14,
509.
9. Bromn, S. A.; Newkirk, D. R.; Hualer, R. P.; Smith, G. G.; Sugimoto, K. J.; Assoc. Off. Anal. Chem. 1990, 73, 479. 10. Flurer, C. L.; Wolnik, K. A.; J. Chromatogr. A 1994, 663, 259.
11. Calcara, M.; Enea, V.; Pricoco, A.; Miano, F.; J. Pharm. Biomed. Anal. 2005, 38, 344.
12. Bhogte, C. P; Patravale, V. B.; Devarajan, P. V.; J. Chromatogr. B: Anal. Technol. Biomed. Life Sci. 1997, 694, 443.
13. Mayhew, J.; Gorbach, S.; J. Chromatogr. 1978, 151, 133. 14. Vogel, R.; Drillipo, K.; Reif, V.; J. Pharm. Biomed. Anal. 2001,
24, 405.
15. State Pharmacopoeia Committee.; The Chinese Pharmacopeia,
Chemical Industry Publishing House: Bei Jing, 2005, vol. 2, p. 740.
16. Kaine, L. A.; Wolnik, K. A.; J. Chromatogr. 1994, 674, 255. 17. Adams, E.; Liu, L.; Dierick, E.; Guyomard, S.; Nabet, P.; Rico,
S.; Louis, P.; Roets, E.; Hoogmartens, J.; J. Pharm. Biomed. Anal. 1998, 17, 757.
18. Mclaughlin, L. G.; Henion, J. D.; J. Chromatogr. 1992, 591, 195. 19. Pastore, P.; Gallina, A.; Magno, F.; Analyst 2000, 125, 1955.
20. McLaughlin, L. G.; Henion, J. D.; Kijak, P.; J. Biol. Mass Spectrom. 1994, 23, 417.
21. Hu, P.; Chess, E. K.; Brynjelsen, S.; Jakubowski, G.; Melchert, J.; Hammond, A.; J. Am. Soc. Mass Spectrom. 2000, 11, 200.
22. Lofler, D.; Ternes, T. A.; J. Chromatogr. A 2003, 1000, 583. 23. Shriram, M.; Pathak, A.; Kumar, R.; Musmade, P.; Udupa, N.;
Talanta 2008, 76, 338.
24. Mashat, M.; Chrystyn, H.; Clark, B. J.; Assi, K. H.; J. Chromatogr. B: Anal. Technol. Biomed. Life Sci. 2008, 869, 59.
25. Shi, H. Q.; Wang. J.; Chin. J. Pharm. 2003, 34, 290.
26. Kim, B. H.; Kim, Y. K.; Ok, L. H.; J. Chromatogr. B: Anal. Technol. Biomed. Life Sci. 2001, 752, 173.
27. Kim,B. H.; Lee, C.; Lee, H. J.; Ok, J. H.; Biomed. Chromatogr.
2003, 17, 396.
28. Fishermen, N.; Soback, S.; Clin. Chem. 2000, 46, 837. 29. Zhou, M. J; Wei, G. L; Liu, Y. P; Sun, Y. M; Xiao, S. H; Lu,
L.; Liu, C. X; Zhong, D. F; J. Chromatogr. B: Anal. Technol. Biomed. Life Sci. 2003, 798, 43.
30. Liu, Z.; Sha, Y.; Huang, T.; Yang, B.; Duan, G. L.; J. Chromatogr. B: Anal. Technol. Biomed. Life Sci. 2005, 828, 2.
31. Peng, W.; Jackson, G. G.; Chiou, W. L.; Antimicrob. Agents Chemother. 1977, 12, 707.
32. Suhren, G.; Knappstein, K.; Analyst 1998, 123, 2797. 33. Xi, L. L.; Wu, G. F.; Zhu, Y.; J. Chromatogr. A 2006, 1115, 202.
34. Wang, J.; Wang, D. D.; Ni, K. Y.; Hu, X. J.; J. Liq. Chromatogr. Relat. Technol. 2007, 30, 1001.
35. Yuan, J. B.; Nie, L. H.; Zeng, D. Y.; Luo, X. B.; Tang, F.; Ding, L.; Liu, Q.; Guo, M. L.; Yao, S. Z.; Talanta 2007, 73, 644.