Article
J. Braz. Chem. Soc., Vol. 23, No. 3, 531-537, 2012. Printed in Brazil - ©2012 Sociedade Brasileira de Química 0103 - 5053 $6.00+0.00
A
*e-mail: [email protected]
Self-Assembled Films from Chitosan and Poly(Vinyl Sulfonic Acid) on Nafion
®for
Direct Methanol Fuel Cell
Leonardo Vinhola,a Tiago Facci,b Luis G. Dias,b Dayse C. de Azevedo,b
Galina Borissevitcha and Fritz Huguenin*,b
aFaculdades COC, Rua Abraão Issa Halack No. 980, 14096-160 Ribeirão Preto-SP, Brazil
bDepartamento de Química, Faculdade de Filosofia, Ciências e Letras de Ribeirão Preto, Universidade de São Paulo, 14040-901 Ribeirão Preto-SP, Brazil
Filmes de quitosana/poli(ácido vinilsulfônico) (PVS) foram depositados sobre membranas de Nafion® a partir do método camada por camada (LbL), visando o seu uso em células a combustível de metanol direto (DMFC). Métodos computacionais e espectros de infravermelho com transformada de Fourier (FTIR) sugerem a formação de um par iônico entre o grupo sulfônico do PVS e o grupo amino protonado da quitosana, o qual promove o crescimento dos filmes LbL sobre a membrana de Nafion®, assim como impede parcialmente a passagem de metanol. Experimentos de cronopotenciometria e varredura linear de potencial foram realizados a fim de se investigar a passagem de metanol através das membranas de Nafion® e quitosana/PVS/Nafion® em uma célula a diafragma. Os valores de resistência iônica associada ao transporte de prótons nas membranas de Nafion® e quitosana/PVS/Nafion® são próximos, de acordo com as medidas de impedância elétrica devido à pequena espessura do filme LbL. Assim, espera-se um melhor desempenho da DMFC, uma vez que a resistência do filme automontado é insignificante comparada ao resultado associado à passagem de metanol através das membranas.
Chitosan/poly(vinyl sulfonic acid) (PVS) films have been prepared on Nafion® membranes by the layer-by-layer (LbL) method for use in direct methanol fuel cell (DMFC). Computational methods and Fourier transform infrared (FTIR) spectra suggest that an ionic pair is formed between the sulfonic group of PVS and the protonated amine group of chitosan, thereby promoting the growth of LbL films on the Nafion® membrane as well as partial blocking of methanol. Chronopotentiometry and potential linear scanning experiments have been carried out for investigation of methanol crossover through the Nafion® and chitosan/PVS/Nafion® membranes in a diaphragm diffusion cell. On the basis of electrical impedance measurements, the values of proton resistance of the Nafion® and chitosan/PVS/Nafion® membranes are close due to the small thickness of the LbL film. Thus, it is expected an improved DMFC performance once the additional resistance of the self-assembled film is negligible compared to the result associated with the decrease in the crossover effect.
Keywords: chitosan, direct methanol fuel cell, proton exchange membrane, crossover effect,
methanol permeability
Introduction
Direct methanol fuel cells (DMFCs) are the most promising portable, stationary power sources with application in several fields. In these cells, methanol and air are continually injected into the anode and cathode compartments, respectively, thus providing energy with high efficiency. Methanol has been largely employed as
fuel once it is abundant and inexpensive. Even though DMFCs produce carbon dioxide, which is released into the atmosphere, their high efficiency guarantees low pollution as compared to other power sources.1-3
reduce this crossover effect. Nafion® is the membrane that
is normally employed as PEM for DMFCs due to its high chemical stability and proton conductivity.4 However,
novel materials have also been prepared and tested as PEM for DMFCs once Nafion® gives rise to large methanol
crossover.5-7
Chitosan is the deacetylated form of chitin, a polysaccharide present in the shells of crabs and in the exoskeleton of shrimps, and can be used as a PEM for DMFCs.8-10 The cross-linked chitosan membranes in H
2SO4
exhibit low permeability to methanol as well as low electronic conductivity. Moreover, these membranes have high thermal and chemical stabilities, do not release environmental contaminants upon overheating up to 200 °C and their discharge into the environment is not polluting. However, the proton conductivity of chitosan is lower than that of Nafion®,8 hindering its utilization in DMFCs.
In this work, self-assembled films from chitosan and poly(vinyl sulfonic acid) (PVS) were deposited onto Nafion® membranes by the layer-by-layer (LbL) method.
This technique allows for control of the thickness of the deposited thin films, thereby avoiding significant enhancement in the resistance of the chitosan/PVS/Nafion®
membrane and maintaining a low ohmic drop in the DMFC.11-14 PVS was chosen because its sulfonic groups
can interact with the protonated amine groups of chitosan, thus promoting decreased methanol permeation due to the less connected hydrophilic channels in the resulting LbL film. This may be exploited as an approach for hindering the crossover effect since it should reduce cell depolarization and cathode poisoning.15-18
Experimental
LbL films were assembled onto Nafion® membranes.
The LbL films were obtained via ionic attraction of oppositely charged materials, by alternate immersion of the Nafion® membrane into the chitosan and PVS dispersions
(HCl solution, pH 2, 1.6 g L−1) for 1 min. After each
immersion, the membrane was rinsed in HCl solution (pH 2) for 30 s. In this work, it is denoted each alternate immersion of Nafion® membrane in the chitosan and PVS
dispersions as “bilayer”. Thus, a 30-bilayer LbL film of chitosan/PVS was deposited on the Nafion® membrane,
which means that this procedure for LbL film growth on the membrane was repeated 30 times. Chitosan, PVS and Nafion® NRE-212 were purchased from Galena Química e
Farmacêutica Ltda (Campinas-SP, Brazil), Aldrich and DuPont, respectively.
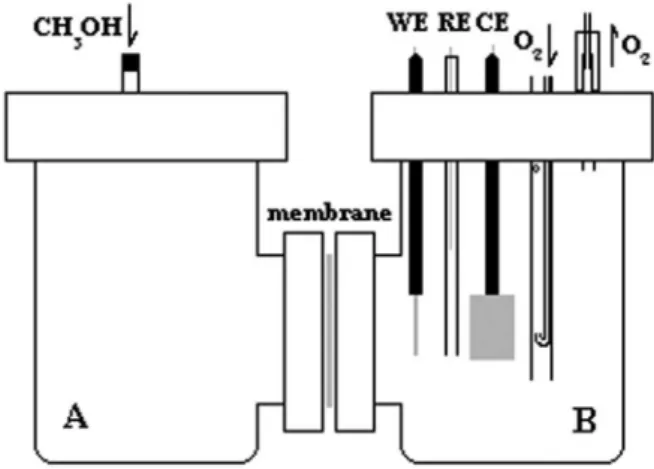
A diaphragm diffusion cell (Figure 1) with two compartments (A and B) containing 30 mL 0.5 mol L-1
H2SO4 was used in the electrochemical experiments carried
out with an Autolab PGSTAT30 potentiostat/galvanostat.19,20
A platinum wire was employed as working electrode (WE), the reversible hydrogen electrode was used as reference electrode (RE) and a platinum sheet was utilized as counter electrode (CE). The three electrodes were placed in compartment B of the cell. Methanol was added to compartment A, resulting in a 0.2 mol L-1 CH
3OH solution.
The membranes were positioned between compartments A and B. The diaphragm diffusion cells were designated cell-1 and cell-2 when Nafion® or chitosan/PVS/Nafion®
membranes were employed, respectively.
Measurements of electrical impedance spectroscopy were performed between 100 and 1 kHz at 25 °C. The membranes were placed in 0.5 mol L-1 H
2SO4 for 24 h,
dried with filter paper and positioned in a sandwich-type gold/membrane/gold cell. The geometrical area of the gold electrodes was 0.5 cm2. A dc potential of 0.0 V
was applied between the electrodes, accomplished with 5 mV of superimposed ac amplitude. Scanning electron microscopy (SEM) surface images were acquired on a digital Zeiss DSM 960 microscope. The thickness of the Nafion® and chitosan/PVS/Nafion® membranes was ca.
50 and 52 mm, respectively. Fourier transform infrared (FTIR) spectroscopic measurements were conducted at a resolution of 2 cm-1 using a BOMEN MB-102 spectrometer.
The FTIR samples were deposited on a Si plate (for LbL film) and mixed with KBr pellet (for chitosan and PVS).
Geometry optimization calculations were carried out at the PBE0 level by means of the Pople 6-31G* basis set. In addition, some single-point calculations were performed at the PBE-D level with the TZV(2d,2p) basis set. All calculations were accomplished using ORCA v2.6rev35. The equilibrium geometry was visualized by the Molekel 5.3 software.
Results and Discussion
Computational methods were used herein for better evaluation of the growth of LbL films and their influence on the decrease of the crossover effect. Insight into the interaction between the chitosan and the PVS can be attempted by studying the complex formed between protonated (2S,3S,4R,5R,6S)-5-amino- 3,6-dimethoxytetrahydro-2H-pyran-2,4-diol and deprotonated ethenesulfonic acid. The complex is stabilized by the coulombic interaction between the protonated ammonium and the sulfonic groups (Figure 2a). Interestingly, a methanol molecule binds to the complex on the sulfonic group. Such interaction stabilizes the alcohol molecule on the site, with an approximate energy of −14 kcal mol-1. This suggests that methanol hops between neighbor sulfonic sites, thus providing a mean for the slow transport of polar solute molecules in LbL films as compared to Nafion® membranes (Figure 2b).
Figure 3 shows the cross-section SEM images of the 30-bilayer chitosan/PVS LbL films deposited onto Nafion® at
two magnifications (× 1 K and × 10 K for Figures 3a and 3b, respectively). From the SEM image of the upper figure, it can be seen that the 30-bilayer chitosan/PVS LbL film covers the
Nafion® surface, which is necessary for the reduction of the
methanol crossover through the membrane. The edge of the cut membrane can be observed in the bottom part, thereby enabling estimation of the thickness (ca. 1 µm) of the LbL film detached from Nafion®.
Figure 4 displays the FTIR spectra for (a) chitosan, (b) PVS and (c) 30-bilayer chitosan/PVS LbL film. The bands at 1632 and 1520 cm-1 are attributed to the
C=O stretching and N-H bending of the amide groups, respectively.21 The bands at 1380, 1153 and 1089 cm-1
are associated with the –CH2 bending, the C−O–C
asymmetric stretching and the C−O stretching of chitosan, respectively.22 The band at 1191 cm-1 is ascribed to the
S=O=S symmetric vibration of the sulfonic group for PVS. In Figure 4c, the lower intensities of the bands associated with the amide groups, as compared to that assigned to the C−O stretching of chitosan, can be related to the interaction between the –NH3+ and –SO3– groups
in the chitosan/PVS LbL film.10 Moreover, the band at
1191 cm-1 disappears, and a band appears at 891 cm-1 in
Figure 4c, which is associated with the interaction between the –NH3+ and –SO3– groups, in accord with the theoretical
calculation for the model complex shown above (see details in Supplementary Information, SI). The band broadening Figure 2. Structural representation of the protonated (2S,3S,4R,5R,6S
)-5-amino-3,6-dimethoxytetrahydro-2H-pyran-2,4-diol and deprotonated ethenesulfonic acid complex in the (a) absence and (b) presence of methanol. Atoms appear as colored spheres: H, C, S, O and N as white, gray, yellow, red and blue spheres, respectively. See online file for color recognition.
Figure 3. Scanning electron micrographs of the chitosan/PVS/Nafion®
membrane at (a) × 1 K (scale bar = 20 µm) and (b) × 10 K (scale bar = 2 µm)
detected between 1140 and 1240 cm-1 probably corresponds
to the interaction of the non-complexed sulfonic group with the protonated amine group. On the basis of these spectra and computational data, it can be said that the interaction between the –NH3+ and –SO3– groups must be
responsible for the growth of chitosan/PVS LbL films.
Figure 5 depicts the Nyquist diagram for the Nafion® and
chitosan/PVS/Nafion® membranes. The resistance of the
membranes was determined from the intersection of the impedance data with the real axis in the Nyquist diagrams
for high frequencies, which is associated with the proton conductivity (2.5 × 10⁻² and 2.3 × 10⁻² S cm-1 for Nafion® and
chitosan/PVS/Nafion®, respectively). Although proton
conductivity is normally lower for chitosan as compared to Nafion®,8,10 the thin LbL film of chitosan/PVS deposited
onto the Nafion® membrane film hardly contributes to
enhancing the resistance corresponding to proton transport.
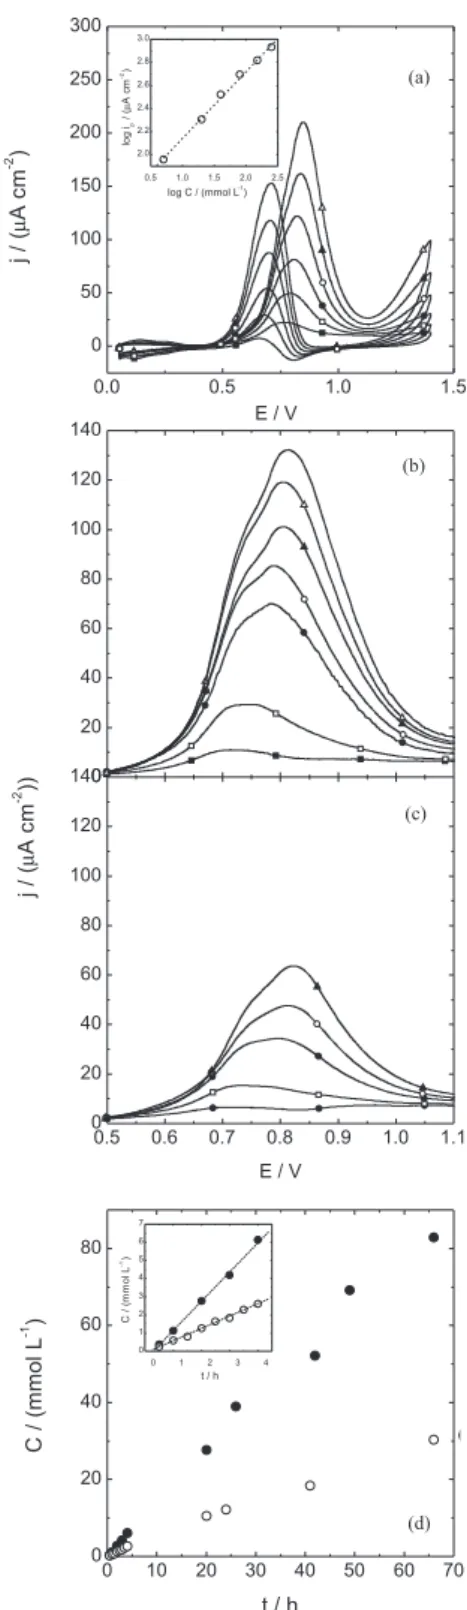
Figure 6a shows the cyclic voltammetry experiments for the Pt electrode in the presence of several different methanol concentrations, in 0.5 mol L-1 H
2SO4. Current
values were normalized by the area of exposed platinum (0.246 cm2), which was calculated from the coulometric
charge of hydrogen desorption. A surface charge density of 210 mC cm-2 was assumed.23 The logarithm of the anodic
peak current (between 0.75 and 0.85 V) (associated with the methanol electrooxidation) was plotted as a function of the logarithm of methanol concentration (inset of Figure 6a), which was used as a calibration curve. Figures 6b and 6c depict the plots of cyclic voltammetry between 0.5 and 1.1 V during the positive scan for the Pt electrode in compartment B of cell-1 and cell-2, respectively, as a function of time after methanol addition in compartment A. The increase in the anodic current as a function of time is related to the amount of methanol that crossed the Figure 4. FTIR spectrum of (a) chitosan, (b) PVS and (c) chitosan/PVS
LbL film.
Figure 5. Nyquist diagram for () Nafion® and () chitosan/PVS/
Nafion® and chitosan/PVS/Nafion® membranes toward
compartment B, which is higher for cell-1 as compared to cell-2.
The methanol concentration in compartment B was determined (Figure 6d) on the basis of the data shown in Figures 6b and 6c and of the calibration curve. The methanol concentration changed from 0 to 82 mmol L-1
and from 0 to 30 mmol L-1 after 66 h of methanol addition
to compartment A of cell-1 and cell-2, respectively. These data indicate the lower permeability of methanol through the chitosan/PVS/Nafion® membrane as compared to the Nafion®
membrane. The methanol permeability was determined by using the data shown in Figure 6d for time values smaller than 5 h (inset of Figure 6d) and the equation19,20
, (1)
where k is the slope of the methanol concentration curve for compartment B as a function of time, VB is the volume of
compartment B, L and S are the thickness and the area of the membrane, respectively, and CAo is the initial methanol
concentration in compartment A. The permeability values were 1.75 × 10⁻⁶ and 0.78 × 10⁻⁶ cm2 s-1 for the Nafion® and
chitosan/PVS/Nafion® membranes, respectively.
In order to demonstrate the influence of the crossover effect on DMFCs, molecular oxygen was bubbled in compartment B, and then chronopotentiometric measurements were conducted. Figure 7 corresponds to the chronopotentiometric curves associated with the oxygen reduction reaction on the Pt electrode in compartment B (with 0.5 mol L-1 H
2SO4 saturated with molecular oxygen)
of cell-1 and cell-2. A current of 37.5 mA cm-2 was
applied for 1800 s at 0 and 75 h after addition of methanol (0.5 mol L-1) to compartment A. The potential changed
from 0.80 to 0.63 V and to 0.68 V for cell-1 and cell-2,
Figure 6. (a) Cyclic voltammograms curves for a platinum electrode in an aqueous solution of 0.5 mol L-1 H
2SO4 containing several different
methanol concentrations: () 5, () 20, () 40, () 80 mmol L-1,
() 150 and () 250 mmol L-1, scan rate = 20 mV s-1. The inset Figure
shows the logarithm of the current as a function of the logarithm of methanol concentration. (b) Cyclic voltammograms for the platinum electrode at () 1, () 4, () 20, () 26, () 42, () 49 and () 66 h
after addition of methanol to compartment A of cell-1. (c) Cyclic voltammograms for the platinum electrode at () 1, () 4, () 20, () 41 and () 66 h after addition of methanol to compartment A of cell-2. (d) Methanol concentration in compartment B as a function of time for () cell-1 and () cell-2. The inset figure shows the data of Figure 6d between 0 and 4 h.
respectively. These overpotential changes as a function of time are due to the methanol crossover through the membrane, which depolarizes the electrode via methanol electrooxidation. Thus, the low methanol permeability of the chitosan/PVS/Nafion® membrane as compared to the
Nafion® membrane ensures a lower cathode depolarization
in DMFCs.
According to the computational data, methanol permeation in the LbL film preferentially occurs between the sulfonic groups. Although these groups significantly contribute to the methanol crossover, they also allow for proton transport. The overall effect is that the LbL film diminishes the crossover effect with a small decrease in conductivity. Considering that this relation between methanol permeability and proton conductivity is an important factor for DMFC performance, the preparation of chitosan/PVS LbL films deposited onto Nafion® can
be an alternative for these power sources. However, other properties must be investigated and specific studies must be conducted to establish this application.
Conclusions
The manipulation of polymeric materials at the nanometer scale by means of self-assembled methods can improve DMFC performance. Here, thin layer-by-layer films formed between chitosan and PVS were deposited onto Nafion®, thereby decreasing the methanol crossover in
the diaphragm diffusion cell. The presence of the sulfonic group in PVS allowed for the growth of the LbL film through interaction of the former group with the protonated amine group of chitosan, as evidenced by the FTIR data and computational method adopted herein. The polymeric chains of chitosan contribute to hindering the methanol crossover. Moreover, the bond energy between the sulfonic group and the methanol molecule is high enough for partial hindrance of the methanol crossover to take place. A small difference in resistance is observed upon comparison between the Nafion® and chitosan/PVS/Nafion® membranes due to
the small thickness of the LbL film as compared to that of the Nafion® membrane. This indicates that the reduction
in the crossover effect compensates the slightly increased resistance, corroborating the possibility of using this LbL film for achievement of better DMFC performance. However, other studies are still required for better evaluation of these LbL films for application in DMFCs.
Supplementary Information
Cartesian coordinates of the ionic pair and of the methanol plus ionic pair, results from single-point calculations and
references on the computational methodology are available free of charge at http://jbcs.sbq.org.br as PDF file.
Acknowledgments
We are grateful to Fundação de Amparo à Pesquisa do Estado de São Paulo (FAPESP, 2009/14181-1), Conselho Nacional de Desenvolvimento Científico e Tecnológico (CNPq) and Coordenação de Aperfeiçoamento de Pessoal de Nível Superior (NanoBiotec-Brasil, CAPES) for financial support.
References
1. Iwasita, T.; J. Braz. Chem. Soc. 2002, 13, 401.
2. Li, W.; Manthiram, A.; Guiver, M. D.; Liu, B.; Electrochem.
Commun. 2010, 12, 607.
3. Hartnig, C.; Manke, I.; Schloesser, J.; Krüger, P.; Kuhn, R.; Riesemeier, H.; Wippermann, K.; Banhart, J.; Electrochem. Commun. 2009, 11, 1559.
4. Ahmad, H.; Kamarudin, S. K.; Hasran, U. A.; Daud, W. R. W.;
Int. J. Hydrogen Energy 2010, 35, 2160.
5. Luo, H.; Vaivars, G.; Mathe, M.; J. Power Sources 2010, 195, 5197.
6. Heinzel, A.; Barragán, V. M.; J. Power Sources 1999, 84, 70. 7. Crespilho, F. N.; Huguenin, F.; Zucolotto, V.; Olivi, P.; Nart, F.
C.; Oliveira, O. N.; Electrochem. Commun. 2006, 8, 348. 8. Mukoma, P.; Jooste, B. R.; Vosloo, H. C. M.; J. Power Sources
2004, 136, 16.
9. Cogo, L. C.; Batisti, M. V.; Pereira-da-Silva, M. A.; Oliveira, O. N.; Nart, F. C.; Huguenin, F.; J. Power Sources 2006, 158, 160.
10. Wu, H.; Zheng, B.; Zheng, X.; Wang, J.; Yuan, W.; Jiang, Z.;
J. Power Sources 2007, 173, 842.
11. Facci, T.; Parreira, R. L. T.; Pereira-da-Silva, M. A.; Oliveira, O. N.; Huguenin, F.; J. Nanosci. Nanotechnol. 2009, 9, 6620. 12. Huguenin, F.; Nart, F. C.; Gonzalez, E. R.; Oliveira, O. N.;
J. Phys. Chem. B 2004, 108, 18919.
13. Deligöz, H.; Yilmaztürk, S.; Yilmazoğlu, M.; Damyan, H.;
J. Membr. Sci. 2010, 351, 131.
14. Xiang, Y.; Zhang, J.; Liu, Y.; Guo, Z.; Lu, S.; J. Membr. Sci.
2011, 367, 325.
15. Deligöz, H.; Yilmaztürk, S.; Karaca, T.; Özdemir, H.; Koç, S. N.; Öksüzömer, F.; Durmuş, A.; Gürkaynak, M. A.; J. Membr. Sci. 2009, 326, 643.
16. Lin, H.; Zhao, C.; Ma, W.; Li, H.; Na, H.; Int. J. Hydrogen
Energy 2009, 34, 9795.
17. Xiang, Y.; Yang, M.; Zhang, J.; Lan, F.; Lu, S.; J. Membr. Sci.
2011, 368, 241.
19. Mukoma, P.; Jooste, B. R.; Vosloo, H. C. M.; J. Membr. Sci.
2004, 243, 293.
20. Cussler, E. L.; Diffusion: Mass Transfer in Fluid Systems; Cambridge University Press: New York, USA, 1997.
21. Duan, W.; Chen, C.; Jiang, L.; Li, G. H.; Carbohydr. Polym.
2008, 73, 582.
20. Kanti, P.; Srigowri, K.; Madhuri, J.; Smitha, B.; Sridhar, S.;
Sep. Purif. Technol. 2004, 97, 12020.
21. Duan, W.; Chen, C.; Jiang, L.; Li, G. H.; Carbohydr. Polym.
2008, 73, 582.
22. Kanti, P.; Srigowri, K.; Madhuri, J.; Smitha, B.; Sridhar, S.;
Sep. Purif. Technol. 2004, 40, 259.
23. Gasteiger, H. A.; Markovic, N.; Ross, P. N.; Cairns, E. J.;
J. Phys. Chem. 1993, 97, 12020.
Submitted: August 30, 2011
Published online: January 31, 2012