One of the main objectives of the research program at ETE is devoted to the study of confinement properties in a low aspect ratio tokamak plasma configuration, and to attain this purpose the determination of plasma parameters of the edge region plays an essential role. A Fast Neutral Lithium Beam (FNLB) diagnostics was developed to perform the measurement of the density profile and its fluctuations at the edge of the plasma in ETE. The first light signals were collected after the filling of ETE chamber with He gas (10−4 Torr), where
the optimization of this diagnostics was done, to adjust the better point for focalization of the beam and for the optical detection system setup. An extensive study of the variation of the intensity of the light signal with the variation of the gas pressure was carried out. This calibration will be used during shots in ETE to measure the rapidly varying pressure of the pulsed discharge by FNLB technique, a requirement imposed by the use of puff valves for injection of the gas. This paper will also describe the several phases of the development of this diagnostics, discuss the problems occurred and the adopted solutions and show the first measurements of the probing of the edge plasma of ETE with FNLB.
1
Introduction
Plasma boundary study in tokamaks became an important issue recently due to the consensus that many phenomena related to the plasma core are correlated with the conditions of the plasma edge [1-3]. However, this region is characteri-zed by steep gradients of the plasma parameters [4] and by high contamination due to plasma-wall interaction [5], being difficult to be diagnosed. Hence, to conveniently probe the edge plasma, the chosen diagnostics system should fulfill the requirements of allowing high spatial and temporal resolu-tion during measurements, no contaminaresolu-tion of the plasma and low disturbance on the discharge. These characteris-tics, that are inherent to the Fast Neutral Lithium Beam Pro-bes (FNLBP), disseminated the use of this diagnostics to the edge density measurement purposes in some tokamaks and helical systems with various device sizes [6-11] around the world.
A 60keV mono-energetic beam of neutral Li atoms was used to probe the top edge region of the JET plasma. There, the radiation emitted from a 17cm long section of the beam path is sampled employing an array of 50 optical fibers and fast CCD cameras. Plasma background radiation is separa-ted from the resonance beam emission line by a low reso-lution spectrometer. Recently, a 30keV lithium beam probe system was used to measure the edge density and its fluctu-ation in discharges of the LHD device. For the photon de-tection from the Li atoms, a thermoelectric cooled CCD ca-mera is used, and a 1nm band-pass filter is installed between the camera lens and the CCD chip. In this experiment, time resolution, i.e., exposure time of CCD is 10-100ms.
Inno-vative two-dimensional neutral lithium beam probe was de-signed and installed on the CHS device [1]. In this case the injected beam line is mechanically tilted to cover the edge region of the plasma two-dimensionally. Light emis-sion from the 10-20keV injected beam is collected by an eight-channel detector system using optical band-pass filters and avalanche photodiodes. High energy Li beam (60keV-100keV) was used to probe the plasma of the ASDEX toka-mak. Interference filter and photomultiplier were used for the collection of light emitted from the lithium resonance line. At TEXTOR, thermal Li and He beams and fast neu-tral lithium beam probed the edge plasma region. Both, interference filter photomultiplier and/or ininterference filter -CCD camera combinations, were used to monitoring the line emission intensity along the injected beam. Separation of Li beam induced line emission from the plasma background ra-diation is made via beam modulation.
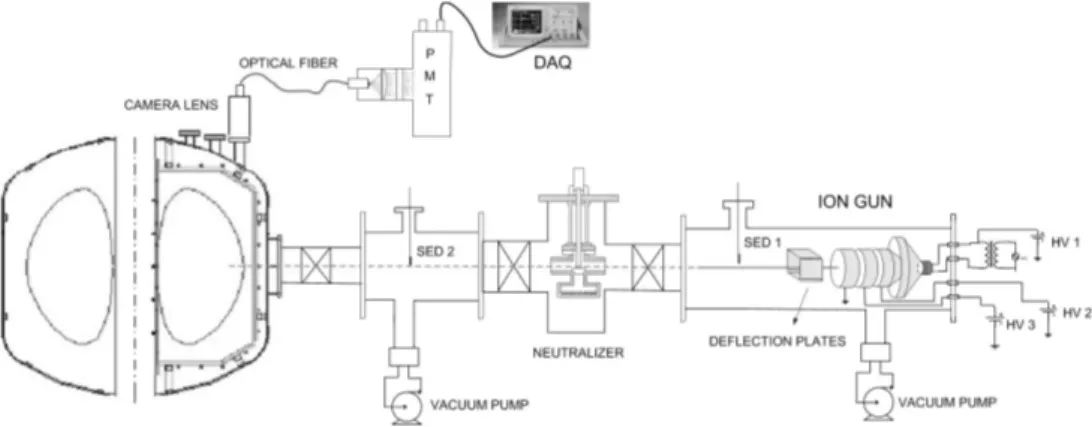
Figure 1. Detailed view of the FNLB probing the edge plasma of the ETE tokamak.
In a comparison to other FNLB devices previously ci-ted, main advantages in favor of the FNLB device installed in ETE are the good spatial resolution, of less than 1cm, due to the relatively low energy of the acceleration voltage of the injected beam, and excellent time resolution during measurements, of the order of1µs, due to the use of photo-multiplier tube. When high energy beams are used, as is the case in JET, ASDEX, LHD, the plasma can be probed more deeply but with the disadvantage of worst spatial resolution. For the case of a 60keV acceleration voltage for example, spatial resolution is of the order of 3cm. On the other hand, modulation of the beam itself limits the achievable time re-solution, that is not better than 2-3ms, as it happens at LHD, CHS, TEXTOR. CCD cameras allow excellent spatial reso-lution in comparison to optical fiber setup (specially fiber bundle), but due to their limited frequency of data acquisi-tion, typically 100 times higher than photomultiplier tubes, time resolution becomes compromised, excluding here their elevate cost.
This paper describes details of the design of the FNLB device installed on ETE tokamak, the calibration process and the first measurements on the edge plasma.
2
Experimental Setup
The experimental setup of the FNLB diagnostics may be divided into 3 main parts: the ion gun, the neutralization chamber and the optical detection system.
Li ions are emitted through the heating of β -eucryptite compound (Li2O.Al2O3.2SiO2) to temperature
over 1100oC in a self heated molybdenum crucible of 0.6mm diameter and 2mm depth. This crucible is housed in a Pierce gun, being submitted to a potencial of 15kV. Th-rough the application of adequate potentials to tree electros-tatic cylindrical lenses, the beam is accelerated and focused. The 3 high voltage DC power supplies being used for this purpose are connected to the cylindrical lenses through spe-cial resistors in order to limit the current delivered in the case of sparks. The heating of the crucible is made via AC voltage, where a 20kV insulation transformer is used to in-sulate the high voltage region from the electric distribution system. Small corrections on the trajectory of the beam may
be done by polarizing the deflection plates situated straight in front of the cylindrical lenses, as it can be shown in Fig. 1. The neutralization system, situated at a distance of 70cm from the gun, is composed of a neutralizer cell that accom-modates small pieces of metallic sodium, a 12cm pass th-rough tube and a pneumatic valve that seals the neutralizer cell. When heated to temperature above220oCthe sodium is vaporized, filling the pass through tube when the valve is opened. Through charge exchange, the Li beam is neutrali-zed. In order to avoid the migration of sodium to the ETE chamber and to the ion gun, two collimators with apertu-res of 2.5cm diameter are placed at the entrance tube and at the end of the tube of the neutralizer chamber. The neutra-lizer housing is also separated from the ion gun and from the tokamak window by two pneumatic gate valves, that are opened for a few seconds just when the discharge is to be initiated, as it occurs also with the pneumatic valve. Diffe-rential pumping is guaranteed by two strategically located turbomolecular pumps.
The optical detection system is composed of an adjusta-ble camera lens focused onto the tip of a 7m fiber bundle (4 rows of 22 fibers x 3 rows of 21 fibers,φ=5mm), connec-ted to a plano-convex lens, interference filter (F W HM = 10nm) and to a photomultiplier tube. The output signal, presently acquired in a digital oscilloscope, will be captured by the data acquisition system of ETE [16], based on VME bus.
3
Beam Characterization
In order to be possible the characterization of the beam, a set of current detectors were disposed in the FNLB vacuum chamber.
The monitoring of the ion current density was perfor-med with the aid of tree secondary electron detectors (SED1,
SED2 and SED3). These SED’s were positioned
respecti-vely at the end of the ion gun tube, at the neutralizer region and at the end of the flight tube of the vacuum chamber (near the entrance window of the tokamak), playing distinct roles. The maximum ion current that could be extracted from the gun was monitored by SED1. Through the variation of the
caused by space charge effects.
Figure 2. Variation of the ion current detected at the region of the neutralizer against the Focusing potential V3.
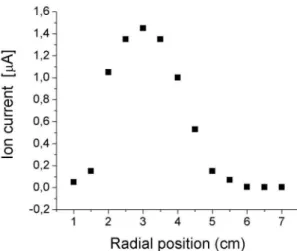
Figure 3. Typical ion beam profile measured at the neutralizer chamber.
At the entrance window of the tokamak, the ion current density detected by SED3is of30µA/cm2. This is
approxi-mately the value of the ion current density of the beam that will probe the edge plasma in the tokamak.
One of the most important characteristics of FNLB diagnos-tics systems is related with the rate of the neutralization of the Li ions, being it strongly dependent on the energy of the beam.
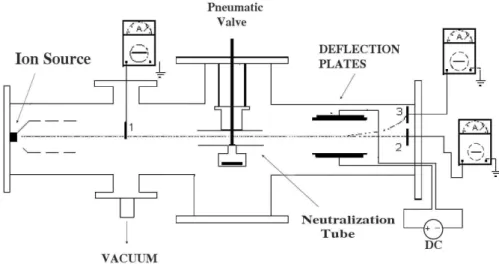
The neutralization efficiency measurement for the 15KeV lithium beam in ETE was performed in two stages. As it is shown in the experimental scheme of Fig. 4, a strong electric field (200V/cm) produced by the polarization of de-flection plates, totally deviates the ion beam to the secon-dary electron detector 3 (SED 3). When the neutralizer is on, the rate of the ion current detected by SED 3 decreases, accordingly to the increase on the temperature of the neu-tralizer cell. In fact, the currentID detected by SED 3 is equal to : ID =Ib++γIb+. HereIb+ is the beam ion cur-rent andγis the secondary electron emission coefficient. In the same way, the current detected in SED 2, after the neu-tralization, is equal to: ID = γIb0, whereI
0
b is the beam neutral equivalent current. The rate of the currents detected by SED 3 and SED 2 is proportional to the neutralization ef-ficiency. However, the value ofγmust be known in order to be possible to achieve the neutralization efficiency. The se-cond part of the experiment is devoted to the measurement of the value ofγ for the beam energy of 15KeV. Now, a Faraday cup (F.C.) situated about 120cm from the neutrali-zer, being composed of an outer cylinder connected to the ground, a collector plate and an inner cylinder serving as a polarized grid, measures the ion currentIb+ and equivalent neutral beam currentI0
b passing through the 40mm diameter entrance aperture. When the neutralizer is off and the grid of the F.C. is biased at a negative voltage sufficient to sup-press secondary electrons, the detected currentID is equal toIb+. On the other hand, when the grid is biased by a po-sitive voltage, the detector registers the current of secondary electrons released from the collector ofγI+
b as well as the ion currentI+
b .
The value ofγ = 2was determined by comparing the beam ion current detected by the F.C. for both positive and negative polarization of the grid.
Figure 4. Experimental apparatus used to measure the neutralization efficiency.
100 150 200 250 300 350
0 20 40 60 80
100 Neutralization efficiency x sodium temperature
neutralization efficiency (%)
temperature [0C]
Figure 5. Neutralization efficiency versus sodium temperature for ion beam of 15keV.
5
The influence of stray magnetic
fi-eld
In the routine operation of ETE a stray magnetic field in the poloidal and toroidal directions of about 10Gauss and 4Gauss were measured in the region of the neutralizer, res-pectively.
The resultant ion Larmor radius is equal to 120m for the magnetic field of10Gauss, according to equation 1.
rL= mv⊥
qB =
1.15×10−26
×1.66×106
1.6×10−19
×10×10−4 ≈
120m (1)
It implies a horizontal deviation of6oon the trajectory of the beam until it reaches the optical detection window. Similar calculation leads to an ion Larmor radius of 300m for the spurious toroidal magnetic field case, that causes the deviation of the beam in the vertical direction of2.4o. These deviations were observed by the change on the intensity of
the light detected by the photomultiplier output signal, as can be seen in Figs. 6 and 7 below.
-20 -10 0 10 20 30
-400 -350 -300 -250 -200 -150 -100 -50 0
ignition of the toroidal capacitor bank
photomultiplier output voltage (mV)
time (ms)
Figure 6. Variation on the amount of light detected by the photo-multiplier tube after the formation of the toroidal magnetic field.
-20 -10 0 10 20 30
-200 -180 -160 -140 -120 -100 -80 -60 -40 -20 0
ignition of the poloidal capacitor bank
photomultiplier output voltage (mV)
time (ms)
100Gauss. An external shielding consisting of a 1mm thick cy-linder ofµ-metal caused a fourfold decrease to the measured field in the shielded region.
Based on this test, the ion source chamber, the flight tubes and the neutralizer chamber were involved by a 1mm thick cylinder of µ-metal. This led to a reduced vertical and horizontal deflections on the beam trajectory to1.5o
and1o
, respectively, with reduction of the variation of the output signal of the photomultiplier. These deviations are small enough not to interfere on the measurement process performed by this diagnostics.
6
Calibration process
First light signals were collected after the filling of ETE cham-ber with He gas and consequent interaction of the lithium atoms with neutral particles. A sweep around the lithium resonance line (6708A) was performed in order to verify the distribution of the in-˚ tensities of wavelengths detected by the optical detection system. In Fig. 8 it is possible to observe that the wavelength distribution is centered at6708A, in which wavelength the maximum intensity˚ of the signal occurs, as it was expected.
6695 6700 6705 6710 6715 6720 6725 1
2 3 4 5 6 7 8
[Å]
photomultiplier output voltage [mV]
wavelength
Figure 8 - Sweep around 6708 ˚A resonance line for Li beam injec-ted in He gas at4×10−4Torr.
1E-5 1E-4 1E-3 3E-3
pressure (Torr)
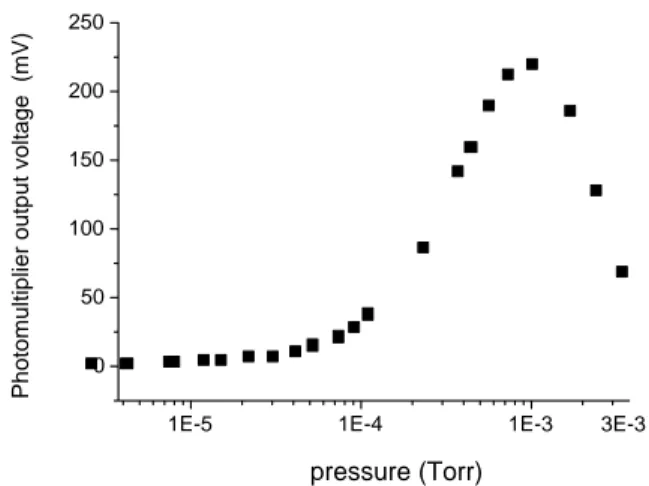
Figure 9. Intensity of the Li resonance line for injection of the beam in hydrogen gas at different pressures.
The second step performed in the calibration process was done by varying the pressure inside the chamber and verifying the variation of the intensity of the output signal of the photomultiplier. The range of variation of the intensity of the light signal collected in response to the variation of the gas pressure begins at4×10−6Torr, reaching pressures
as high as3×10−3Torr. As may be seen in Fig. 9, the
maxi-mum intensity of the signal occurred forp= 1×10⁻³Torr.
The excess of collisions of lithium atoms with neutral par-ticles existing for higher values of the pressure causes the attenuation of the beam, with consequent reduction of the intensity of the emission of light. Notice that pressure of operation in ETE is in the range of10−5
to10−4
Torr. This fact promotes the FNLB as an excellent pressure meter for ETE discharges, since it makes it possible to measure the fast varying pressure in ETE chamber when puff valves are used for the injection of gas. In fact, several measurements with FNLB were performed by injecting gas through puff valves into ETE chamber. A typical signal showing the exact instant of the fast input of gas into the chamber and the con-sequent reduction of the pressure due to the vacuum pum-ping may be seen in Fig. 10.
-1 0 1 2 3 4
-8 -7 -6 -5 -4 -3 -2 -1 0
0.4
1.0
2.0
3.0
pressure (x 10
-5 Torr)
photomultiplier output voltage (mV)
time (s)
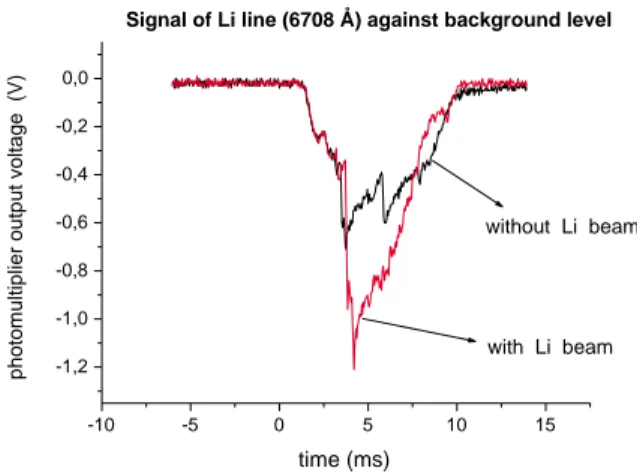
-10 -5 0 5 10 15 -1,2 -1,0 -0,8 -0,6 -0,4 -0,2 0,0
Signal of Li line (6708 Å) against background level
with Li beam without Li beam
photomultiplier output voltage (V)
time (ms)
Figure 11. Intensity of Li resonance line radiation against back-ground level.
0 1 2 3 4 5 6 7 8
-0,5 0,0 0,5 1,0 1,5 2,0 2,5 3,0 n e (x 10 12 particles/cm 3 ) time (ms) n e
Figure 12. Temporal evolution of the plasma density for R= 48cm.
7
Measurements at the plasma
The intense background radiation emitted from the plasma, mainly due to Hαemission, is just partially cut off by the optical detection system, being this noise level several times higher than the emitted line radiation (6708A) of interest. In˚ order, to measure the correct plasma density we must per-form two sequential shots, while maintaining plasma condi-tions. The first one is normally made without the application of the beam, just to allow the measurement of the noise le-vel. The difference on the intensity of both signals (with and without the application of the beam) is proportional to the electron density of the plasma under the following con-ditions: plasma temperatureTe <100eV and low attenua-tion of the Li beam. These condiattenua-tions have been observed at the outer window position (R = 48cm) and for the present status of development of ETE [17] (the energy delivered by
the capacitor banks represents approximately 14of the total energy expected for the initial stage of operation of ETE). In this radial position, the temperature measured by Thomson Scattering diagnostics remained always below 30eV [18]. The principle of density determination used for this situa-tion was based on the comparison of the photon flux profi-les emitted from the lithium atoms due to interaction with plasma electronsNvpand due to the interaction with hydro-gen gasNvg under same discharge conditions [19]. Here, the electron density is deduced from the relation described in equation 2 [6].
ne= Nνp Nνg
Qg Qp
ng (2)
where: Qg is the cross section for interaction of lithium atoms with molecular gas, Qp is the effective cross sec-tion for collision of lithium atoms with the electrons of the plasma andngis the number density of the gas.
In the first instance the density of a glow discharge using He gas at2×10−4Torr was measured. In this case the
con-tinuous intensity of the signal collected when lithium beam was injected into the discharge was 90%higher than the signal measured without the injection of the beam. From known cross section data [15] and calculation of the gas number density ng, the obtained plasma density was of
2×10¹¹particles/cm3.
The time evolution of the plasma density for typical ETE discharges was also obtained forR= 48cm, using the same method described above. The graph of Fig. 11 shows the intensity of the signal collected by the photomultiplier when the beam is injected into the plasma against the background level. The resultant density profile is shown in Fig. 12.
8
Conclusion
Several phases of the development of the FNLB diagnos-tics were overcame. First light signals were collected af-ter the filling of ETE chamber with He gas at 10−4Torr,
being possible the optimization of the diagnostics and the adjustment of the optical detection system setup. The me-asurement of the fast varying pressure during injection of gas in ETE chamber by puff valves was obtained. A 15keV lithium beam of 2cm diameter with equivalent current of 30mA/cm2,80%neutralized, is being used to probe the edge
plasma of the ETE tokamak. Even though we realize that some important modifications must be done to improve the measurements, the first results showed to be very satisfac-tory. The main modification to be implemented is the incre-ase of the channels for optical detection, which will allow the measurement of the density for other radial positions. The interference filter being used of 10nm pass-band will also be substituted by a 3nm pass-band one. This will allow a higher signal to noise ratio during measurements.
In summary, a neutral lithium beam probe system for measurement of the time evolution of the plasma density in ETE has been developed. The measurement of the temporal evolution of the density of the plasma edge with FNLB, of the order of1012
[4] W. M. Stacey, Fusion Technology 36, 38 (1999).
[5] E. Hintz, Transactions of Fusion Technology 25, 333 (1994).
[6] H. Iguchi, K. Kadota, K. Takasugi, T. Shoji, M. Hosokawa, M. Fujiwara, and H. Ikegami, Rev. Sci. Instrum. 56, 1050 (1985).
[7] A. Komori, O. Mitarai, K. Yamagiwa, C. Honda, K. Kadota, and J. Fujita, Nucl. Fusion 28, 1460 (1988).
[8] D. M. Thomas, Rev. Sci. Instrum. 66, 806 (1995).
[9] T. Morisaki, Plasma Phys. Controlled Fusion 37, 787 (1995).
[10] T. Morisak, A. Komori, O. Motojima and LHD Experimental Group, Rev. Sci. Instrum. 74, 1865 (2003).
[15] K. Kadota, K. Tsuchida, Y. Kawasumi, and J. Fujita, Plasma Physics 20, 1011 (1978).
[16] R. M. Oliveira, L. F. W. Barbosa, J. G. Ferreira, and C. S. Shibata, Fusion Engineering and Design 60, 403 (2002).
[17] L. A. Berni, E. Del Bosco, R. M. Oliveira, and M. P. Alonso, Braz. J. Phys. 34, 1572 (2004).
[18] L. A. Berni, M. Ueda, E. Del Bosco, J. G. Ferreira, R. M. Oli-veira, and W. A. Vilela, Rev. Sci. Instrum. 74, 1200 (2003).