Article
A Contribution to the Chemical Characterization of Rivers in the Rio Negro Basin, Brazil
Ivo L. Küchlera*, Norbert Miekeleyb and Bruce R. Forsbergc
a
Analytical Chemistry Department, Fluminense Federal University, 24020-150, Niterói – RJ, Brazil
b
Chemistry Department, Pontifical Catholic University, 22453-900, Rio de Janeiro – RJ, Brazil
c
Ecology Department, National Institute for Amazonian Research, 69011-970 - Manaus – AM, Brazil
Amostras de água foram coletadas no Rio Amazonas, no Rio Negro (Brasil) e em 17 afluentes do Rio Negro, na Amazônia Central. As análises consistiram em medidas de pH, condutividade, carbono orgânico (DOC) e espectrometria de massas com fonte de ICP. Através da análise multivariada as variáveis foram classificadas em três fatores, correspondentes a 94% da variância. O gráfico de escores de fatores mostrou que a maioria das amostras da Bacia do Rio Negro formam um grupo homogêneo. Testes de ultrafiltração confirmaram que o Rio Negro apresenta compostos orgânicos de massa molecular mais alta que o Rio Solimões, e que alguns metais encontram-se associados com estes compostos. Observou-se também que, nas águas da maioria dos rios da Bacia do Rio Negro, os elementos pesados das Terras Raras estão enriquecidos em relação aos elementos leves, enquanto o contrário ocorre no material particulado.
Water samples were collected in Middle Amazonia from the Amazon River, Rio Negro and 17 tributaries of Rio Negro. The analyses consisted of pH, conductivity, and dissolved organic (DOC) measurements, as well as plasma source mass spectrometry (ICP-MS). Factor analysis revealed three factors, which explained 94% of the total variance. A plot of factor scores presented a cluster containing mostly samples from the Rio Negro Basin. Ultrafiltration tests confirmed that organics from the Rio Negro have higher molecular mass than in the Amazon, and that some metals are associated with these compounds. Heavy rare-earth elements (REE) are enriched relative to light REE in the dissolved fraction of most rivers of the Negro Basin; the opposite occurred in suspended matter.
Keywords: Amazonia, Rio Negro (Brazil), blackwater rivers, multivariate analysis, rare-earth elements
Introduction
The Amazon, the world’s largest river in terms of water-shed, discharge and number of tributaries, receives the name of Solimões, from the Peruvian border to the mouth of the Rio Negro, and from there to the Atlantic Ocean it is called the Amazon. Among the hundreds of tributaries of the Ama-zon, Rio Negro is considered the most important, because of its discharge. Rio Negro rises as Rio Guainía in the Tunai Slope in Colombia, forms part of the boundary between Colombia and Venezuela and, after flowing for about 1700 km, it flows into the Amazon at Manaus, Brazil. The Negro Basin mostly encompasses an intensely weathered area of Precambrian Shield and extends itself 1100 km in the east-west direction and 600 km in the north-south direction; the basin area, with 715,000 km2, is one of the largest in the
world. The chief Negro tributaries are the Uaupés, which rises in central Colombia, and the Branco, which starts at
the Brazil-Guyana border. Water level at Manaus usually varies about 7 m from low to high tide, but a maximum difference of 16 m is possible. The rainy season is not the same for the whole basin: for example, at Manaus the pe-riod goes from January to April, with maximum atmospheric precipitation in March; at Barcelos, about 500 km in the northwest direction, the rainy period goes from April to June, with maximum precipitation in May. The largest pre-cipitation averages found in the Amazonian region are within the Negro Basin, in Taraquá (3652 mm year-1) and
Iaureté (3506 mm year-1)1.
Some characteristics of the Rio Negro are: bed stability, with low erosion; extremely weathered podzolic soil; de-pleted aquatic fauna and flora; low concentration of dis-solved salts and absence of suspended matter; low pH; and an intense color, ranging from dark brown to black, due to high concentrations of humic compounds. The low sedi-ment load permits the high concentrations of humic acid
and fulvic acid in solution, as humic compounds would adsorb on particles, if present. Amazonian rivers with simi-lar characteristics are called blackwater rivers2,3 . On the
other hand, rivers like the Amazon are called whitewater rivers. Their characteristics are: noticeable bed mobility; high sediment, salt and organic matter load; favorable con-ditions for aquatic fauna and flora; and water color rang-ing from colorless to light yellow.
Since the fifties, Amazonian rivers have been the ob-ject of many chemical and geochemical studies (for ex-ample, Sioli4, Stallard and Edmond5 and Ertel et al.6). As
a consequence of the limited infrastructure available and the large distances involved, most studies were restricted to the main stem of the Amazon, and a large number were based on samples collected only at Manaus or near the river mouth. Studies on blackwater rivers have been rare, and generally limited to a small number of chemical com-pounds2,6,7. Following previous work on the association
of metals and humic compounds of the Negro and Solimões rivers near Manaus8, this work reports on the
concentration of minor and trace elements in the Negro Basin and makes a comparison with the Solimões. Data evaluation was done by means of cluster and factor
analysis. Results of ultrafiltration and other tests are also presented and discussed.
Experimental
Sampling and pretreatment
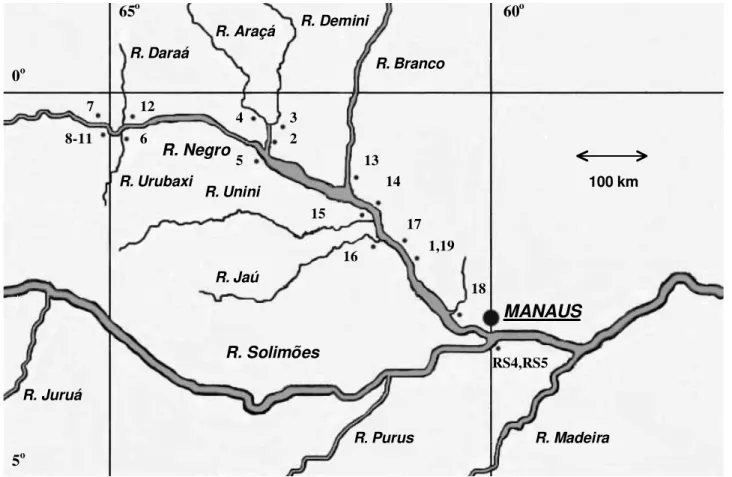
Twenty-five samples were collected during the sum-mers of 1995 and 1997: samples IN1, IP1, RN4, RN5, RS4 and RS5 on February 1995, samples 1-12 on Febru-ary 1997 and samples 13-19 on March 1997. Most samples came from the Rio Negro or its tributaries, be-tween Manaus and Santa Isabel do Rio Negro (Figure 1); two samples (IN1 and IP1) were from igarapés, or small shallow rivers, and two samples (RS4 and RS5) were col-lected in the Solimões, near Manaus. Samples were manu-ally collected beneath the surface in 1-Liter acid-washed9
polyethylene flasks, rinsed with the water being collected. Field measurements of conductivity and pH followed established procedures10. Samples were filtered (< 0.45
µm) on site, using an all-plastic Millipore filter holder, and stored under refrigeration in acid-washed polyethyl-ene bottles, until further analyses.
MANAUS
R.Madeira
R.Branco
R. Solimões R. Negro
R. Araçá R. Demini
R.Unini
R.Jaú
60o 65o
0o
5o
RS4,RS5 1,19
17 14 13
R.Daraá
R.Urubaxi
R.Juruá
R. Purus 16
15 5
8-11
7 12
2 3 4
18 6
100 km
Elemental analysis
Total and inorganic carbon in water samples were de-termined with a Dohrmann DC-190 Carbon Analyzer; dis-solved organic carbon (DOC) was obtained by difference. Other elements were determined by inductively coupled plasma mass spectrometry (ICP-MS) using an ELAN 5000 equipment (Perkin-Elmer-Sciex). The sample introduction system was a Meinhard nebulizer connected to a cyclonic spray chamber. Platinum sampler and skimmer were used for better detection limits. Plasma and mass spectrometer operating conditions were optimized daily for the same purpose and for minimizing oxide interferences (e.g.,
138Ba16O+, 140Ce16O+). Typically, sensitivity of the
in-strument for Rh was at least 7.106 cps mg L-1 and oxides were below 2%. Updating of the response factors was achieved with a 50 µg L-1 multielemental solution con-taining 58 elements, prepared from Perkin-Elmer Standards N930-0232, N930-0233 and N930-0235. Uncertainty of the results was typically ± 10%. REE were determined in the quantitative mode; all other elements in the semiquantitative mode (TotalQuant). Calibration for quantitative REE determination was made by analytical curves (0.5 to 5 µg L-1) prepared from the multielemental
solution standard N930-0232. In all cases, correlation co-efficients greater than 0.999 were obtained. Isobaric inter-ferences (Nd, Sm) were corrected using the appropriate elemental equations. Table 1 summarizes some relevant information concerning measuring parameters and quan-tification levels for REE.
V0 is the initial volume and VC is the retentate volume) were employed to minimize concentration polarization8.
Data treatment
The cluster analysis and factor analysis routines of the STATISTICA 5.1 program (StatSoft Inc.) were employed for data reduction and sample classification, following established procedures11. Variables with more than two
cases under the detection limit, or more than two missing values, were discarded. For the remaining 36 variables, missing values were replaced by the variable average. Before cluster analysis, variables were standardized by means of Z-scores; then squared Euclidean distances were calculated. As for factor analysis, the raw data matrix was introduced in principal component analysis, without any rotation.
Results and Discussion
Most rivers have high organic carbon (DOC) concen-trations, Rio Araçá presenting a maximum of 20.6 mg L-1
and Rio Branco a minimum of 2.7 mg L-1 (Table 2). DOC
concentrations in Rio Solimões (7.7-8.6 mg L-1) are near
the mean value found in the Negro Basin (11.4 mg L-1).
The pH in the Negro Basin (3.89-6.07) is lower than in Rio Solimões (6.93-6.99); the minimum value of 3.89 was found at Rio Tea. Conductivity ranges from 8.8 to 28.6 µS cm-1 in
the Negro Basin were lower than the values observed in Rio Solimões (68.8-93.3 µS cm-1). For many sites in the
Negro Basin, the hydrogen ion concentration alone can explain most of these low conductivities. There is a sig-nificant direct correlation at 99.9% confidence level be-tween conductivity and DOC (r = 0.859) and a converse correlation between DOC and pH (r = -0.755) in the Negro Basin. Sediment load (> 0.45 µm) is extremely low in the Negro Basin, the mean value was found to be 47 mg L-1
for the samples taken in 1997.
The results of cluster analysis are presented as a dendogram, where the similarity of two variables is con-versely proportional to the linkage distance (Figure 2). This graph reveals three clusters: cluster I includes vari-ables conductivity, Cl, K, U, pH, as well as alkaline-earth metals; cluster II includes Rb, Th, Ti, Y, Zr and rare-earth elements; and cluster III contains As, DOC, Na, Si, V, Zn and transition metals, like Fe and Mn. Eight variables, representative of a definite chemical group, were selected for factor analysis. This analysis showed the occurrence of three factors with eigenvalues greater than one, account-ing for 94% of the total variance. The main contribution (43.1% of variance) comes from variables included in
Table 1. Operational parameters in ICP mass spectrometry of
rare-earth elements. (Numbers beside isotopes are background equivalent concentrations (BEC), expressed in ng L-1).
Mass Spectrometer: ELAN 5000A (Perkin Elmer-Sciex) RF Power: 1050 W
Argon Flow Rates (L. min-1): Nebulizer - 0.950; Plasma -15.00;
Auxiliary - 1.00.
Internal Standards: 115In, 205Tl
Isotopes measured: 115In, 139La (5.9), 140Ce (9.4), 141Pr (5.8), 146Nd (7.8), 152Sm (4.9), 153Eu (4.0), 157Gd (4.0), 159Tb (1.6), 163Dy (6.7), 165Ho (1.7), 166Er (6.4), 169Tm (2.5), 172Yb (5.9), 175Lu (2.4), 205Tl.
Measuring Parameters: Scanning mode: normal resolution and peak hopping; Dwell time: 100 ms; sweeps/reading: 1; readings/ replicate: 1; number of replicates: 3
Flat membrane ultrafiltration
Factor I: Ca, conductivity and Mg (Table 3). Factor II (27.8% of variance) is composed of Ti, Ce and Th, and Factor III (22.7% of variance) of Cr and Ni. This grouping is similar to that found in cluster analysis. On a graph of factor scores (Figure 3), most samples of the Negro Basin join a homogeneous group, with moderate scores on fac-tors I and II; this group is supposedly composed only of blackwater samples. On the same graph, samples from Rio Solimões (RS4 and RS5) are located apart from the previ-ous group, because they score high on factor I; on the other hand, samples 3, 7 and 13 score high on factor II. It seems clear from factor analysis that not every river inside the Negro Basin is a ‘pure’ blackwater one. Rio Branco (sample 13), for example, presents intermediate values between a blackwater and a whitewater river for most ele-ments (Table 4). This characteristic of Rio Branco can be attributed to its steep course, before arriving at the Amazo-nian plane. Table 5 shows mean values for the elemental analysis of blackwater samples, i.e. samples from the Ne-gro Basin, except samples 3, 7 and 13. As a rule, concen-trations of Al, Co and Ni are higher, and of alkaline and alkaline-earth metals and Si are lower in blackwater rivers than in whitewater ones.
Results of sequential ultrafiltration tests of three blackwater (IN1, IP1 and RN4) and one whitewater sample (RS4) are presented in Table 6. Masses retained in the fractions >100 kDa, 10-100 kDa and 1-10 kDa were summed and shown as mass >1 kDa, in comparison to the
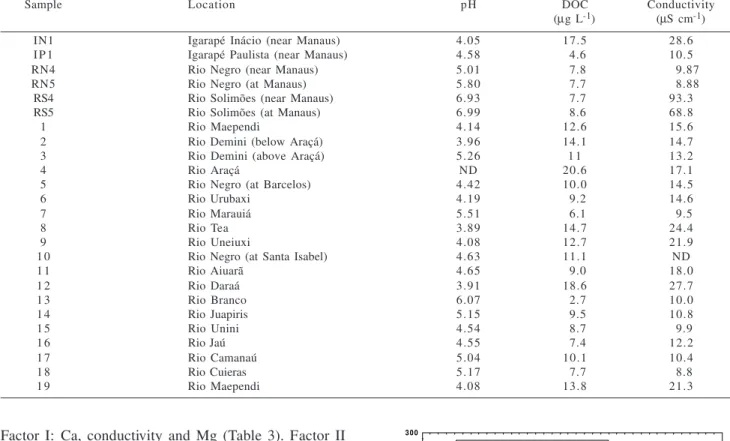
Table 2. Preliminary analytical results. (ND: not determined).
Sample Location pH DOC Conductivity
(µg L-1) (µS cm-1)
IN1 Igarapé Inácio (near Manaus) 4.05 17.5 28.6
I P 1 Igarapé Paulista (near Manaus) 4.58 04.6 10.5
RN4 Rio Negro (near Manaus) 5.01 07.8 009.87
RN5 Rio Negro (at Manaus) 5.80 07.7 008.88
RS4 Rio Solimões (near Manaus) 6.93 07.7 93.3
RS5 Rio Solimões (at Manaus) 6.99 08.6 68.8
1 Rio Maependi 4.14 12.6 15.6
2 Rio Demini (below Araçá) 3.96 14.1 14.7
3 Rio Demini (above Araçá) 5.26 1 1 13.2
4 Rio Araçá ND 20.6 17.1
5 Rio Negro (at Barcelos) 4.42 10.0 14.5
6 Rio Urubaxi 4.19 09.2 14.6
7 Rio Marauiá 5.51 06.1 09.5
8 Rio Tea 3.89 14.7 24.4
9 Rio Uneiuxi 4.08 12.7 21.9
1 0 Rio Negro (at Santa Isabel) 4.63 11.1 ND
1 1 Rio Aiuarã 4.65 09.0 18.0
1 2 Rio Daraá 3.91 18.6 27.7
1 3 Rio Branco 6.07 02.7 10.0
1 4 Rio Juapiris 5.15 09.5 10.8
1 5 Rio Unini 4.54 08.7 09.9
1 6 Rio Jaú 4.55 07.4 12.2
1 7 Rio Camanaú 5.04 10.1 10.4
1 8 Rio Cuieras 5.17 07.7 08.8
1 9 Rio Maependi 4.08 13.8 21.3
Figure 2. Tree diagram for 36 variables, according to cluster
analy-sis. (Amalgation rule: Ward’s method; distance measure: squared Eu-clidean; variable standardization: Z-scores)
Figure 3. Factor scores on factors I and II. (Extraction method:
Principal components; rotation: Varimax raw; 25 cases; variables: Ca, Ce, conductivity, Cr, Mg, Ni, Th and Ti)
Linkage Distance
0 5 0 1 0 0 1 5 0 2 0 0 2 5 0 3 0 0
pH Ba U K Cl Cond. Ca Sr Mg Dy Gd Nd Pr Ce La Y
Sm Er Rb Th Zr Ti Co Fe Mn DOC Al Cu Ni Cr Zn Sc Si As V Na
Factor 1
Factor 2
I P 1
R S 4 R S 5
3
4 7
1 2 1 3
1 5 1 8
-2 -1 0 1 2 3 4
Table 3: Factor loadings of variables (Extraction method: Principal components; rotation: Varimax raw; 25 cases)
Variable Factor 1 Factor 2 Factor 3
Mg -0.979 0.056 0.047
Ca -0.986 -0.104 0.090
Conductivity -0.931 -0.251 0.091
T i 0.064 0.928 -0.118
Ce 0.121 0.935 -0.043
T h 0.094 0.930 0.033
Cr 0.097 0.014 -0.984
Ni 0.072 0.073 -0.982
Table 4: Elemental water analysis of samples RS4 and RS5 (Rio Solimões),
RN5 (Rio Negro) and 13 (Rio Branco) (Concentrations in mg L-1; ND:
not determined).
RS4 RS5 RN5 1 3
Na ND 3.2 x 10³ 4.8 x 10² 1.09 x 10³ Mg 1.14 x 10³ 9.1 x 10² 142 4.1 x 10²
Al 2 4 5 5 111 121
Si 1.55 x 10³ 1.43 x 10³ 1.08 x 10³ 4.0 x 10³
K 6.6 x 10² 5.8 x 10² 3.0 x 10² 7.6 x 10²
Ca 9.3 x 10³ 7.1 x 10³ 4.2 x 10² 7.0 x 10²
T i 0.96 0.91 0.48 8.0
V 1.0 0.85 0.32 1.1
Cr 0.11 0.21 0.10 8.9
M n 4.4 9.0 10.7 3.4
Fe 135 173 2.2 x 10² 2.5 x 10²
Co 0.04 0.06 0.14 0.59
Ni 0.62 0.54 0.21 4 3
Cu 3.8 3.7 0.42 5.1
Z n 2.4 0.80 2.7 121
Ga 0.04 0.03 0.01 0.07
As 0.95 0.76 0.11 1.8
Rb 1.4 1.3 1.3 3.9
Sr 5 6 4 3 4.8 1 5
Y 0.13 0.17 0.13 0.43
Z r 0.03 0.04 0.05 0.25
Ba 3 0 2 3 8.1 2 4
La 0.10 0.15 0.18 0.49
Ce 0.22 0.33 0.54 1.3
P r 0.03 0.04 0.06 0.14
Nd 0.11 0.17 0.19 0.44
Sm 0.05 0.06 0.04 0.13
Eu 0.02 0.02 0.01 0.02
Gd 0.05 0.06 0.04 0.08
Dy 0.03 0.04 0.03 0.06
E r 0.02 0.02 0.02 0.06
Pb 0.19 0.27 0.16 0.25
T h 0.02 0.04 0.07 0.10
U 0.09 0.09 0.04 0.10
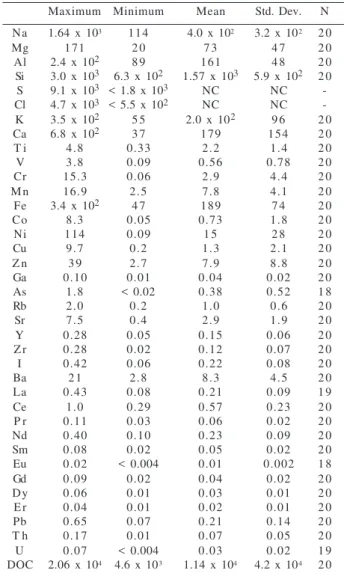
Table 5: Elemental water analysis of blackwater samples.
(Con-centration in mg L-1; NC: not calculated; N: number of averaged
samples)
Maximum Minimum Mean Std. Dev. N
Na 1.64 x 10³ 114 4.0 x 10² 3.2 x 10² 2 0
Mg 171 2 0 7 3 4 7 2 0
Al 2.4 x 10² 8 9 161 4 8 2 0
Si 3.0 x 10³ 6.3 x 10² 1.57 x 10³ 5.9 x 10² 2 0
S 9.1 x 10³ < 1.8 x 10³ NC NC
-Cl 4.7 x 10³ < 5.5 x 10² NC NC
-K 3.5 x 10² 5 5 2.0 x 10² 9 6 2 0
Ca 6.8 x 10² 3 7 179 154 2 0
T i 4.8 0.33 2.2 1.4 2 0
V 3.8 0.09 0.56 0.78 2 0
Cr 15.3 0.06 2.9 4.4 2 0
M n 16.9 2.5 7.8 4.1 2 0
Fe 3.4 x 10² 4 7 189 7 4 2 0
Co 8.3 0.05 0.73 1.8 2 0
Ni 114 0.09 1 5 2 8 2 0
Cu 9.7 0.2 1.3 2.1 2 0
Z n 3 9 2.7 7.9 8.8 2 0
Ga 0.10 0.01 0.04 0.02 2 0
As 1.8 < 0.02 0.38 0.52 1 8
Rb 2.0 0.2 1.0 0.6 2 0
Sr 7.5 0.4 2.9 1.9 2 0
Y 0.28 0.05 0.15 0.06 2 0
Z r 0.28 0.02 0.12 0.07 2 0
I 0.42 0.06 0.22 0.08 2 0
Ba 2 1 2.8 8.3 4.5 2 0
La 0.43 0.08 0.21 0.09 1 9
Ce 1.0 0.29 0.57 0.23 2 0
P r 0.11 0.03 0.06 0.02 2 0
Nd 0.40 0.10 0.23 0.09 2 0
Sm 0.08 0.02 0.05 0.02 2 0
Eu 0.02 < 0.004 0.01 0.002 1 8
Gd 0.09 0.02 0.04 0.02 2 0
Dy 0.06 0.01 0.03 0.01 2 0
E r 0.04 0.01 0.02 0.01 2 0
Pb 0.65 0.07 0.21 0.14 2 0
T h 0.17 0.01 0.07 0.05 2 0
U 0.07 < 0.004 0.03 0.02 1 9
DOC 2.06 x 10⁴ 4.6 x 10³ 1.14 x 10⁴ 4.2 x 10⁴ 2 0
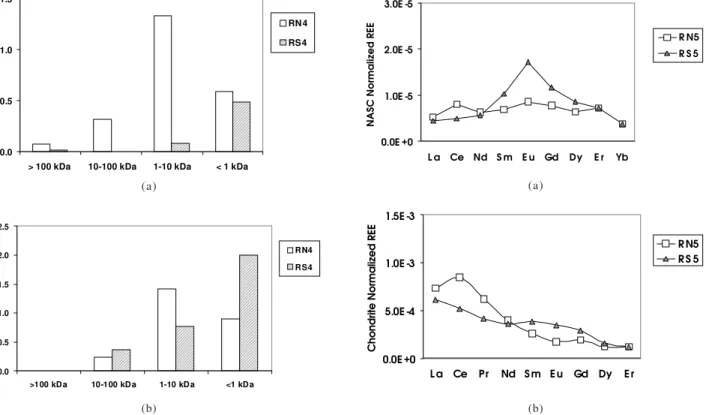
filtered mass (<1 kDa). For example, in blackwater samples there is a higher proportion of organic com-pounds with molecular mass >1 kDa, i.e. humic com-pounds, than in Rio Solimões (Figure 4a). This result agrees with a previous ultrafiltration study of the Rio Negro8. Other metals, such as Al, Ba, Ca, Mg and Mn
(Figure 4b) are partitioned similarly, suggesting an asso-ciation with humic compounds in blackwater samples. For most elements, however, partition is the same in black-water and whiteblack-water samples
Dissolved REE concentrations in blackwater rivers are generally in the range of 0.1-1 mg L-1 for La, Ce and Nd, and below 0.1 µg L-1 for the other REE; concentrations
are even lower in Rio Solimões (Tables 4 and 5). Graphs of REE in solution, normalized to the NASC average shale standard 12, show an almost horizontal line for a typical blackwater sample (RN5), except for the small enrichment of Ce; samples from Rio Solimões (RS5) present a bell-shaped curve (Figure 5). However, if samples from Solimões are normalized against a chondrite standard 13, a typical horizontal line is found (Figure 6). These patterns indicate that the composition of blackwaters is similar to shales, while that of whitewaters is more alike to chondrites. Simi-lar results are obtained with graphs of suspended matter.
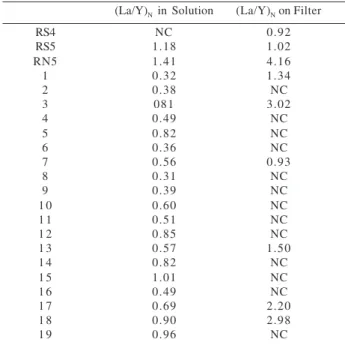
The ratio of the NASC normalized concentrations of La to Yb, (La/Yb)N , has been used as a measure of enrich-ment of light to heavy REE 14. Samples RS4 and RS5 from
(a)
(b)
Figure 4. Mass distribution of manganese (a) and DOC (b) in samples
RN4 (Rio Negro) and RS4 (Rio Solimões), after ultrafiltration. (Volume ratios ≅ 3)
(a)
Figure 5. Rare-earth Elements in samples RN5 (Rio Negro)
and RS5 (Rio Solimões) normalized against a) NASC and b) Chondrite.
(b)
Table 6 : Analytical results from the ultrafiltration of three blackwater samples (IN1, IP1, and RN4) and a whitewater sample (RS4). (Mass
of elements in mg)
IN1 I P 1 RN4 RS4
> 1 kDa < 1 kDa > 1 kDa < 1 kDa > 1 kDa < 1 kDa > 1 kDa < 1 kDa
Mg 4.9 1.2 3.3 2.0 18.2 7.0 2 5 208
Al 48.3 4.2 15.3 3.0 25.6 2.7 1.6 3.1
Si 5 124 1 7 160 4 187 1 0 315
K 1 5 1 7 1 2 1 9 3 1 4 8 8 135
Ca 1 7 7 1 4 1 2 5 0 2 4 294 1662
T i 0.20 0.01 0.06 0.03 0.03 0.07 0.05 0.09
V 0.03 0.00 0.01 0.01 0.03 0.02 0.03 0.14
M n 1.16 0.22 0.39 0.20 1.72 0.59 0.10 0.48
Fe 28.4 3.5 19.5 3.9 34.8 2.4 9.8 5.1
Co 0.02 0.00 0.01 0.01 0.03 0.01 0.00 0.01
Rb 0.05 0.04 0.04 0.05 0.15 0.14 0.02 0.27
Sr 0.12 0.04 0.09 0.06 0.59 0.26 1.78 9.83
Ba 0.94 0.15 0.49 0.23 1.02 1.14 1.30 4.84
Ce 0.16 0.01 0.07 0.01 0.14 0.01 0.03 0.00
Nd 0.06 0.01 0.03 0.01 0.07 0.01 0.02 0.00
Pb 3.1 0.3 2.2 0.5 8.0 1.1 0.93 0.32
DOC 2.9 x 10³ 5 x 10² 4 x 10² 4 x 10² 1.7 x 10³ 9 x 10² 1.1 x 10³ 2.0 x 10³
and in suspended matter, indicating that there is no en-richment (Table 7). On the other hand, an enen-richment of heavy REE in comparison to light REE is observed in the dissolved fraction of most rivers of the Negro Basin, with ratios well below 1.0; the opposite occurs in the sediment. This enrichment happens because heavy REE form stron-ger complexes with humic compounds in solution than do the light REE 13. Rivers of the Negro Basin do not show
the same REE pattern as Rio Solimões; instead, their high REE concentrations suggest a similarity to the diluted riv-ers of low pH described by Goldstein and Jacobsen 14.
The mixing of Rio Negro with Rio Solimões begins at Manaus and extends itself downstream for about 100 km. From the conductivities of samples collected at the mix-ing point (Sample RS5) and upstream (samples RN5 and RS4), and considering conductivity conservative, a
dis-0.0 0.5 1.0 1.5
> 100 kDa 10-100 kDa 1-10 kDa < 1 kDa
RN 4 RS4
0.0 0.5 1.0 1.5 2.0 2.5
>100 kDa 10-100 kDa 1-10 kDa <1 kDa
RN4
RS4
0.0E +0 1.0E -5 2.0E -5 3.0E -5
L a Ce Nd S m E u Gd Dy E r Yb
NASC Normalized REE
R N5 R S 5
0.0E +0 5.0E -4 1.0E -3 1.5E -3
L a Ce Pr Nd S m E u Gd Dy E r
Chondrite Normalized REE
R N5 R S 5
Mn /
µ µ µ µ µ
g
Some properties of blackwater rivers, such as the distri-bution pattern of some elements in ultrafiltration experi-ments and the enrichment of heavy REE in the dissolved fraction seem to be related to the concentration of humic compounds.
Acknowledgements
This study received financial support from the National Research Council of Brazil (CNPq), from FINEP, from FAPERJ and from the National Science Foundation. Thanks are due also to our laboratory technicians M. Dupin and A. J. Pereira (PUC/RJ) for assistance in sample analy-sis and to T. Pimentel (INPA) and the crew of the Amanaí boat, for helping in fieldwork.
References
1. DNPVN. Vias navegáveis interiores do Brasil. Vol. 4 - Estudo Geral: Bacia Amazônica; Dep. Nac. de Portos e Vias Navegáveis; Rio de Janeiro, s.d.
2. Leenheer, J. A.; Santos, U. M. Acta Amazonica 1980, 10, 343.
3. Hedges, J. I.; Cowie, G. L.; Richey, J. E., Quay, P. D.; Benner, R.; Strom, M.; Forsberg, B. R. Limnol. Oceanogr. 1994, 39, 743.
4. Sioli, H. Forsch. Fortsch. 1950, 25, 274.
5. Stallard, R. F.; Edmond, J. M. J. Geophys. Research
1983, 88, 9671.
6. Ertel, J. R.; Hedges, J.; Devol, A. H.; Richey, J. E.; Ribeiro, M. N. G. Limnol. Oceanogr. 1986, 31, 739. 7. Williams, P. M. Nature 1968, 218, 937.
8. Küchler, I. L.; Miekeley, N.; Forsberg, B. Sci. Total Environ. 1994, 156, 207.
9. Moody, J. R.; Lindstrom, R. M. Anal. Chem. 1977, 49, 2264.
10. Eaton, A. D.; Clesceri, L. S.; Greenberg, A. E., Eds. Standard Methods for the Examination of Water and Wastewater, 19th Ed. American Public Health Asso-ciation; Washington, 1995. p. 2-46 and 4-68. 11. Dillon, W. R.; Goldstein, M. Multivariate analysis:
Methods and applications; Wiley; New York, 1984. 12. Elderfield, H.; Upstill-Goddard, R.; Sholkowitz, E.
R. Geochim. et Cosmochim. Acta 1990,54, 971. 13. Evensen, N. M.; Hamilton, P. J.; O’Nions, R. K.
Geochim.Cosmochim. Acta 1978,42,1199.
14. Goldstein, S. J.; Jacobsen, S. Earth Planet. Sci. Lett.
1988, 89, 35.
Received: October 18, 1999
Table 7: NASC normalized ratios of Lanthanum to Ytterbium
(La/Y)N. (NC: not calculated)
(La/Y)N in Solution (La/Y)N onFilter
RS4 NC 0.92
RS5 1.18 1.02
RN5 1.41 4.16
1 0.32 1.34
2 0.38 NC
3 081 3.02
4 0.49 NC
5 0.82 NC
6 0.36 NC
7 0.56 0.93
8 0.31 NC
9 0.39 NC
1 0 0.60 NC
1 1 0.51 NC
1 2 0.85 NC
1 3 0.57 1.50
1 4 0.82 NC
1 5 1.01 NC
1 6 0.49 NC
1 7 0.69 2.20
1 8 0.90 2.98
1 9 0.96 NC
charge ratio of 2.4:1 (Solimões to Negro) was calculated. This result is similar to the discharge ratios of 2.7:1 3 and
3.5:1 6, obtained from the literature. Sample RS5 seems to
be a linear combination of samples RN5 and RS4, based on the discharge ratio (see Table 4). For most elements the difference between the calculated and the measured value is less than 20%; greater differences can be attributed, in general, to the measurement uncertainty.
Conclusions
According to factor analysis, most samples of the Rio Negro Basin form a homogeneous blackwater group, with characteristics that differentiate them from the whitewater Rio Solimões; the exceptions, like Rio Branco, present intermediate values between blackwater and whitewater for most variables. This classification does not depend only on variables included in Factor I (Ca, conductivity, etc.), since Factors II and III together explain 50% of the variance.