Quim. Nova, Vol. 38, No. 6, 813-816, 2015
A
rti
g
o
http://dx.doi.org/10.5935/0100-4042.20150087
*e-mail: [email protected]
PHYTOCHEMICAL AND PHYLOGENETIC ANALYSIS OF Spondias (Anacardiaceae)
Cristiane Pereiraa,*, Letícia L. de Oliveirab, Ricardo Gonçalvesc, Ana Claudia F. Amarald, Ricardo M. Kustera and Cassia M. Sakuraguic
aInstituto de Pesquisas de Produtos Naturais, Universidade Federal do Rio de Janeiro, 21941-590 Rio de Janeiro – RJ, Brasil bDepartamento de Genética, Instituto de Biologia, Universidade Federal do Rio de Janeiro, 21941-590 Rio de Janeiro – RJ, Brasil cDepartamento de Botânica, Instituto de Biologia, Universidade Federal do Rio de Janeiro, 21941-590 Rio de Janeiro – RJ, Brasil dInstituto de Tecnologia em Fármacos – Farmanguinhos, Fundação Oswaldo Cruz, 21041-250 Rio de Janeiro – RJ, Brasil
Recebido em 30/03/2015; aceito em 09/04/2015; publicado na web em 21/05/2015
This paper describes the correlation between the phenolic composition and the molecular phylogenetic reconstruction of five Spondias species (Anacardiaceae). Two of these species (S. venulosa and Spondias sp.) occur in rainforest areas and the other three are widely distributed in Brazil (S. dulcis, S.mombin, and S. purpurea). The flavonoid enriched fraction of the S. venulosa leaf extract also underwent a chemical study. The results indicate that the presence of flavonol 3-O-glycosides are a synapomorphic character of the studied American Spondias and the production of rhamnetin 3-O-rutinoside is a synapomorphy of the Atlantic forest species. This is the first report of flavonoids in S. venulosa, an endemic species from the Brazilian Atlantic rainforest.
Keywords: Spondias; flavonol 3-O-glycosides; molecular phylogeny.
INTRODUCTION
Anacardiaceae is a pantropical flowering plant family of 800 spe-cies distributed in 82 genera of which ca. 70 spespe-cies belonging to 15 genera occur in Brazil. Fruits or parts of fruits of many Anacardiaceae species are edible and are important products in the food industry, such as cashew (Anacardium occidentale L.), mango (Mangifera indica L.), cajá (Spondias spp.), umbu (Spondias tuberosa Arruda) and pistachio (Pistacia vera L.).1 The Spondias genus consists of 18 species distributed in tropical and subtropical areas worldwide, with 9 species occurring in the Neotropics.2 In Brazil, this genus is represented by six species that dwell in open and dry areas as well as in the interior of humid forests.3 In addition to the use of Spondias in the food industry, some species have also been used as medicinal plants, such as S. purpurea and S. mombin, which have experimentally demonstrated leishmanicidal, antiviral and anthelmintic effects.4,5
A remarkable feature of Spondias species is the occurrence of flavonoids, which are an important class of secondary metabolites in Anacardiaceae.4 These compounds play a variety of biological roles in plants including defense, UV protection, flower coloring and allelopathy and are also considered important chemotaxonomic markers.6 Furthermore, their antioxidant and chelating properties are responsible for several human health benefits.7 Due to the economic potential of Spondias, a number of studies on their morphological development and phenolic characterization have been published.8-12 However, no phytochemical studies of the leaves have been performed yet. In addition, there are no currently identified synapomorphies for Brazilian Spondias species. Therefore, this work describes a phytochemical study of a flavonoid enriched fraction from the leaves of S. venulosa, an endemic species from the Brazilian Atlantic rainforest and the phenolic profile of five representative Spondias species: S. dulcis, S. mombin, S. purpurea, S. venulosa and Spondias sp. Moreover, we estimate the phylogenetic relationships of these species based on molecular markers to understand the evolution of flavonoid occurrence along these lineages, which also contributes to the understanding of the systematics of the group.
EXPERIMENTAL
General experimental procedures
1H and 13C 1D and 2D nuclear magnetic resonance (NMR) spectroscopy were recorded at 500 MHz (1H) and 125 MHz (13C) on a VNMRSYS- 500 Varian® spectrometer using TMS as an internal standard and DMSO-d6 as a solvent. All ESI mass spectra were ac-quired using a Micromass®/Waters triple-quadrupole spectrometer (ZQ-4000). The instrument was operated in negative ion mode with the following electrospray conditions: capillary voltage 3 kV, cone voltage 40 V, extraction cone 1 kV, tube lens 1 kV, source tempera-ture 150 ºC and desolvation temperatempera-ture 300 ºC. The reversed-phase analytical HPLC method was developed on a Shimadzu LC system using a Waters Symmetry C18 column (5 µm, 4.6 mm x 250 mm) with a diode array detector (SPD-M10Avp). The following linear gradient was employed with a flow rate of 1 mL min-1: Solvent A = 0.1% formic acid in water (v/ v); solvent B = methanol, elution profile = 0- 55 min, 5- 70% B, 55- 58 min, 70- 100% B and 58- 68 min, 100- 5% B. The UV chromatograms were recorded at 254 and 365 nm.Column chromatography procedures were performed on Sephadex LH-20 (PHARMACIA®) and Amberlite XAD-2 (Sigma-Aldrich). For thin layer chromatography (TLC), silica gel 60 F254 plates from Merck (20 x 20 and 0.30 mm thickness) were used. TLC was observed under a UV lamp (254 and 365 nm) and visualized using (NP/PEG) reagent, diphenylboric acid 2-aminoethyl ester/ polyethylene glycol, under 365 nm.
Plant material
Pereira et al.
814 Quim. Nova
Extraction and isolation of flavonoids from Spondias venulosa
Air-dried leaves (300 g) of S. venulosa were ground and extracted with 80% MeOH at room temperature by static maceration over 7 days. After concentration under reduced pressure the extract was then partitioned sequentially in three different solvents, CH2Cl2 (2.0 g), EtOAc (5.0 g) and BuOH (6.3 g). All fractions were analyzed by TLC using BuOH: AcOH: H2O (40:10:50, v/v) as the solvent system, the TLC chromatograms were visualized using NP/PEG reagent and UV light (365 nm). Two grams of the n-BuOH extract, enriched in flavonoids, was applied to a XAD-2 column (id/h = 3 cm/50 cm) and chromatographed in a stepwise gradient with H2O:MeOH (9:1/0:10, v/v). Each combination of solvents was eluted through the column and fractions of 300 mL were collected. Ten fractions were obtained and analyzed by TLC. The fractions eluted with 50% to 80% MeOH were taken together (100 mg) and re-chromatographed on Sephadex LH-20 (id/h = 3 cm/50 cm) with H2O:MeOH (3:7/0:10, v/v) as mobile phase. After these chromatographic procedures the flavonoids: quercetin 3-O- b-D-rutinoside (10 mg) (Figure 1a), rhamnetin 3-O-b-D-rutinoside (6 mg) (Figure 1b) and quercetin 3-O-[a -rhamnopyranosyl-(1-2)-a-rhamnopyranosyl-(1-6)-b-glucopyranoside (3 mg) (Figure 1c) were obtained. All compounds were identified by a combination of spectroscopic methods (1H, 13C NMR, ESI-MS) and compared with data from the literature.11,12
Phytochemical analyses of Spondias
Air-dried leaves (100 g) of five Spondias species (Spondias sp, S. venulosa, S. purpurea, S. dulcis and S. mombin) were submitted to the same extraction procedure as described above for S. venulosa.
After concentration under reduced pressure, methanol extracts were analyzed by HPLC-DAD with co-injection of two flavonoids previ-ously isolated from S. venulosa (Rhamnetin 3-O-rutinoside and quercetin 3-O-rutinoside). Mobile phase (1 mL min-1) based on H
2O: MeOH gradient (0 min = 5%B, 55 min = 70%B, 58 min = 100%B in 73 min) was used with UV detection focused at 254 and 365 nm. DNA extraction, amplification and sequencing
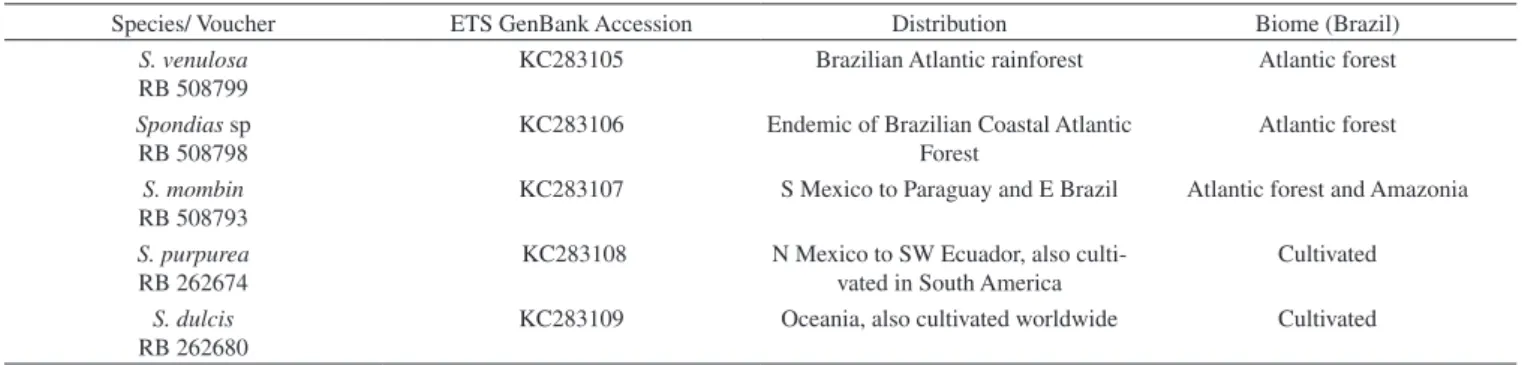
Genomic DNA was extracted from approximately 1.0 g of leaf fragments preserved in silica using the QIAGEN DNeasy Blood & Tissue kit. Amplification of ETS and 18S was performed with the primers listed in Table 2.13,14 PCR products were purified with an ExoSAP-IT kit and were automatically sequenced with the same sets of primers used for PCR reactions. The accession number information is included in Table 1.
Alignment and phylogenetic analysis
Both markers were individually aligned using MUSCLE and manually adjusted in SeaView.15,16 Phylogenetic analyzes were per-formed with the maximum likelihood method using PhyML 3.0 with bootstrap values based on 1000 replicates.17 The best-fit evolutionary
Table 1. Voucher information, GenBank accession numbers and geographic distribution of the samples
Species/ Voucher ETS GenBank Accession Distribution Biome (Brazil)
S. venulosa RB 508799
KC283105 Brazilian Atlantic rainforest Atlantic forest
Spondias sp RB 508798
KC283106 Endemic of Brazilian Coastal Atlantic Forest
Atlantic forest
S. mombin RB 508793
KC283107 S Mexico to Paraguay and E Brazil Atlantic forest and Amazonia
S. purpurea RB 262674
KC283108 N Mexico to SW Ecuador, also culti-vated in South America
Cultivated
S. dulcis RB 262680
KC283109 Oceania, also cultivated worldwide Cultivated
O O
OH OH O
O H O
HO OH
O
OH OH OH
1a: R = H
1b: R = Me
O O
OH
OH
O OH HO
O O
OH OH H O
O
OH OH OH
O O
OH
OH
O OH RO
Figure 1. Flavonoids isolated from S. venulosa – 1a: Rutin (quercetin 3-O-b-D-rutinoside); 1b: rhamnetin 3-O-b- D-rutinoside; 1c: quercetin 3-O-[a -rham-nopyranosyl-(1-2)-a-rhamnopyranosyl-(1-6)-b-glucopyranoside
Table 2. Primer sequences
Primer Sequence (5’-3’)
ETS Bur-ETS1F TTCGGTATCCTGTGTTGCTTAC
Phytochemical and phylogenetic analysis of Spondias (Anacardiaceae) 815 Vol. 38, No. 6
model was estimated using the Akaike information criterion (AIC). As the trees based on the two markers produced similar topologies, the sequences were concatenated and a third tree was used to map the occurrence of flavonoids.
RESULTS AND DISCUSSION
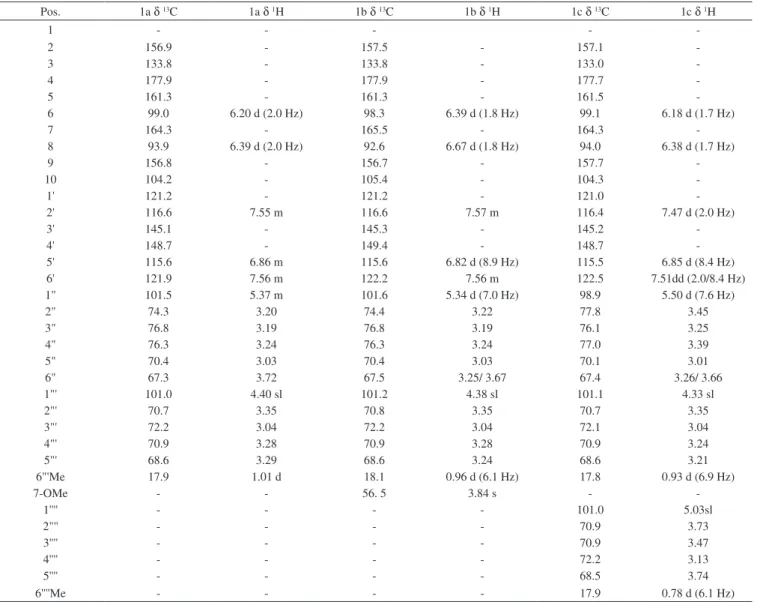
The n-BuOH fraction obtained from Spondias venulosa leaves was fractionated using column chromatography and the isolated compounds 1a (quercetin 3-O-b-D-rutinoside), 1b (rhamnetin 3-O-b -D-rutinoside) and 1c quercetin 3-O-[a-rhamnopyranosyl-(1-2)-a -rhamnopyranosyl-(1-6)-b-glucopyranoside gave positive phenolic reaction with NP/PEG reagent in TLC.18 The molecular formulae for the isolated compounds were established based on negative ESI – MS data [M- H] - at 609.2 (1a), 623.3 (1b) and 755.3 (1c).
The 1H and 13C NMR spectra for both compounds (Figure 1a and 1b) showed slight differences related to the meta - coupled hydrogens H-6 and H-8 of the A-ring, due to the presence of a methoxyl group δH3.84 (s) at the C-7 position, with a long range carbon proton cor-relation (HMBC) for 7-OMe→C-7, for the rhamnetin derivative. The chemical shifts were at δH 6.20 (H, d, J = 2.0 Hz, H-6/ δH 6.40 (H, d, J = 2.0 Hz, H-8) and δH 6.39 (H, d, J = 1.9 Hz, H-6)/ δH 6.67 (H, d, J = 1.9 Hz, H-8), respectively. All other NMR spectra signals are quite similar for both the B ring and the sugar moiety (rutinoside),
with the linkage position at C-3 determined by the HMBC correlation and characteristic chemical shifts (Table 3).11
The molecular formula for quercetin 3-O-[a -rhamnopyranosyl-(1-2)-a-rhamnopyranosyl-(1-6)-b-glucopyranoside(Figure 1c) was established as C33H40O20 based on MS data [M-H]
- at 755.3 and on analyses of the 1H (1 and 2D) and 13C NMR spectra. The 1c flavonoid has also certain signal resemblance within the 1H NMR to compound 1a (Table 3)however it is possible to observe the presence of one extra rhamnosyl moiety attached at C-2’’of the glucopyranoside. That linkage position was determined after HMBC correlation between the rhamanosyl anomeric hydrogen at δH 5.03 (sl) and the C-2’’’ (δC77.8). Furthermore, the observed NOESY correlations between the B-ring hydrogens (H-2’’ and H-5’’) and the methyl rhamnopy-ranoside hydrogens δH 0.78 (3H, d, J = 6.1 Hz) strongly support that statement. All other NMR chemical shifts (Table 3) were similar to the literature data.12
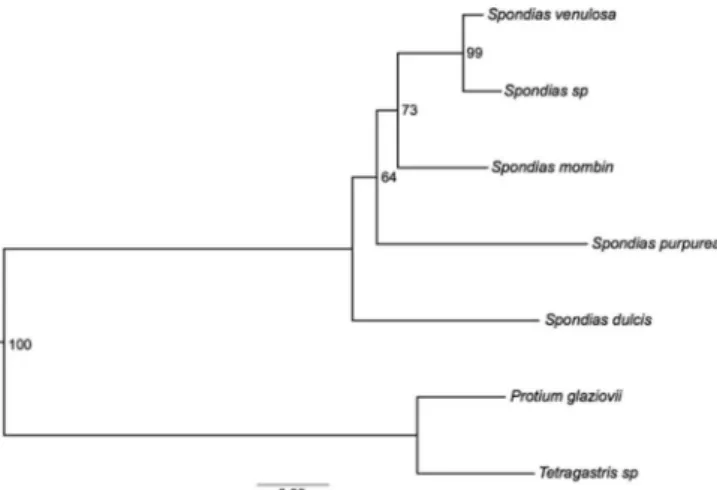
Phylogenetic reconstruction of Spondias was conducted using the GTR model (Figure 2). S. dulcis wasrecovered as the sister group of the other sampled Spondias species, which is in agreement with previous molecular phylogenetic analyzes.1S. mombin and S.
purpurea are mainly found in open habitats, such as cerrados and restingas.3 S. venulosa and Spondias sp. areendemic to the Brazilian Atlantic rainforest and were shown as being the most derived taxa among the sampled species.
Table 3. 1H and 13C NMR spectral data for compounds 1a, 1b and 1c (DMSO-d 6)
Pos. 1a δ13C 1a δ1H 1b δ13C 1b δ1H 1c δ13C 1c δ1H
1 - - - -
-2 156.9 - 157.5 - 157.1
-3 133.8 - 133.8 - 133.0
-4 177.9 - 177.9 - 177.7
-5 161.3 - 161.3 - 161.5
-6 99.0 6.20 d (2.0 Hz) 98.3 6.39 d (1.8 Hz) 99.1 6.18 d (1.7 Hz)
7 164.3 - 165.5 - 164.3
-8 93.9 6.39 d (2.0 Hz) 92.6 6.67 d (1.8 Hz) 94.0 6.38 d (1.7 Hz)
9 156.8 - 156.7 - 157.7
-10 104.2 - 105.4 - 104.3
-1' 121.2 - 121.2 - 121.0
-2' 116.6 7.55 m 116.6 7.57 m 116.4 7.47 d (2.0 Hz)
3' 145.1 - 145.3 - 145.2
-4' 148.7 - 149.4 - 148.7
-5' 115.6 6.86 m 115.6 6.82 d (8.9 Hz) 115.5 6.85 d (8.4 Hz)
6' 121.9 7.56 m 122.2 7.56 m 122.5 7.51dd (2.0/8.4 Hz)
1" 101.5 5.37 m 101.6 5.34 d (7.0 Hz) 98.9 5.50 d (7.6 Hz)
2" 74.3 3.20 74.4 3.22 77.8 3.45
3" 76.8 3.19 76.8 3.19 76.1 3.25
4" 76.3 3.24 76.3 3.24 77.0 3.39
5" 70.4 3.03 70.4 3.03 70.1 3.01
6" 67.3 3.72 67.5 3.25/ 3.67 67.4 3.26/ 3.66
1"' 101.0 4.40 sl 101.2 4.38 sl 101.1 4.33 sl
2"' 70.7 3.35 70.8 3.35 70.7 3.35
3"' 72.2 3.04 72.2 3.04 72.1 3.04
4"' 70.9 3.28 70.9 3.28 70.9 3.24
5"' 68.6 3.29 68.6 3.24 68.6 3.21
6"'Me 17.9 1.01 d 18.1 0.96 d (6.1 Hz) 17.8 0.93 d (6.9 Hz)
7-OMe - - 56. 5 3.84 s -
-1'''' - - - - 101.0 5.03sl
2"'' - - - - 70.9 3.73
3'''' - - - - 70.9 3.47
4'''' - - - - 72.2 3.13
5'''' - - - - 68.5 3.74
Pereira et al.
816 Quim. Nova
All the analyzed species showed a similar phenolic composition with the major presence of flavonol O- glycosides, but without de-tection of the respective aglycones, which is consistent with previous information for S. purpurea peels.4 Quercetin 3-O-rutinoside was the main phenolic constituent in the studied Spondias species, except for S. dulcis. Quercetin 7-O-methoxylated derivative (rhamnetin 3-O-rutinoside) was present in large amounts only in the two species native to the Atlantic forest. The mapping of flavonoid occurrence on the phylogenetic tree is presented in Figure 3, with the thicker branches representing the major occurrence of rutin in the analyzed species. Although all the studied species occur in Brazil, S. dulcis was introduced from Asia and S. purpurea was introduced from the American continent. Thus, major rutin occurrence can be considered a character shared by the American Spondias species studied. These results indicate that major production of flavonol 3-O-glycosides is a synapomorphy of the American Spondias species and that the occurrence of rhamnetin 3-O- rutinoside can be a synapomorphic character of the Atlantic forest species.
This study is the first phytochemical study of leaves of S. venu-losa, anendemic species from the Atlantic rainforest. Flavonol 3-O-glycosides were isolated in S. venulosa and detected in leaves of four additional representative Spondias species. The presence of such flavonoids can be considered a synapomorphic character of the Brazilian Spondias clade. The occurrence of rhamnetin
3-O- rutinoside in combination with phylogenetic data provides evidence for the separation of the two Atlantic forest species in a distinct clade, which is important for further chemosystematic and phylogenetic studies of this genus.
SUPPLEMENTARY MATERIAL
1H, 1D, 2D NMR, 13C, UV and MS spectra of compounds 1a-1c and HPLC/DAD chromatograms are available free of charge at http:// quimicanova.sbq.org.br as a PDF file.
ACKNOWLEDGEMENTS
C. Pereira, L. L. de Oliveira and R. Gonçalves thank CNPq and CAPES for provision of scholarships. The authors thank IBAMA and SISBIO for authorization to collect in the sampling areas and for analytical sector of FIOCRUZ and IPPN for technical support. REFERENCES
1. http://www.kew.org/science/tropamerica/neotropikey/families/Ana-cardiaceae.htm, accessed on August, 2014; Souza, V.C.; Lorenzi, H.; Botânica Sistemática: Guia ilustrado para identificação de Faneróga-mas nativas e exóticas no Brasil, baseado em APGII, 2nd ed., Instituto
Plantarum: Nova Odessa, 2008.
2. Mitchell, J. D.; Daly, D. C.; 46º Congresso Nacional de Botânica, São Paulo, Brasil, 1995; Mitchell, J. D.; Daly, D. C.; Brittonia 1998, 50, 447. 3. http://floradobrasil.jbrj.gov.br/, accessed on August, 2014.
4. Engels, C.; Gräter, D.; Esquivel, P.; Jiménez, V. M.; Gänzle, M. G.; Schieber, A.; Food Res. Int. 2012, 46, 557.
5. Amaral, A. C. F. In Coletânea científica de plantas de uso medicinal; Amaral, A. C. F.; Simões, E. V.; Ferreira, J. L. P., eds.; FIOCRUZ: Rio de Janeiro, 2005; Accioly, M. P.; Bevilaqua, C. M. L.; Rondon, F. C. M.; de Morais, S. M.; Machado, L. K. A.; Almeida, C. A.; de Andrade Jr., H. F.; Cardoso, R. P. A.; Vet. Parasitol. 2012, 187, 79; Corthout, J.; Pieters, L. A.; Claeys, M.; Vanden Berghe, D. A.; Vlietinck, A. J.; Phytochemis-try1991, 30, 1129; Ademola, I. O.; Fagbemi, B. O.; Idowu, S. O.; Trop. Anim. Health Prod. 2005, 37, 223.
6. Buer, C. S.; Imin, N.; Djordjevic, M. A.; J. Integr. Plant Biol. 2010, 52, 98; Crawford, D. J.; Giannasi, D. E.; BioScience1982, 32, 114 7. Heim, K. E.; Tagliaferro, A. R.; Bobilya, D. J.; J. Nutr. Biochem. 2002,
13, 572.
8. Martins, L. P.; Silva, S. M.; Alves, R. E.; Filgueiras, H. A. M. C.; Rev. Bras. Frutic. 2003, 25, 23.
9. Santos, M. B.; Cardoso, R. L.; Fonseca, A. A. O.; Conceição, M. N.; Rev. Bras. Frutic. 2010, 32, 1089.
10. de Souza, F. X.; Spondias agroindustriais e os seus métodos de propa-gação. EMBRAPA-CNPAT 27, 1998.
11. Merina, A. J.; Kesavan, D.; Sulochana, D.; Pharm. Chem. J. 2011, 45, 317.
12. Schwarz, B.; Hofmann, T.; Agric. Food Chem. 2007,55, 1394. 13. Weeks, A.; Daly, D. C.; Simpson, B. B.; Mol. Phylogenet. Evol. 2005,
35, 85.
14. Baldwin, B. G.; Markos. S.; Mol. Phylogenet. Evol. 1998, 10, 449. 15. Edgar,R.C.; Nucleic Acids Res. 2004, 32,1792.
16. Gouy, M.; Guindon, S.; Gascuel, O.; Mol. Biol. Evol. 2010, 27, 221 17. Guindon S.; Dufayard J.F.; Lefort V.; Anisimova M.; Hordijk W.;
Gascuel O.; Syst. Biol. 2010, 59, 307.
18. Wagner, H. In Plant drug analysis. A thin layer chromatography atlas; Wagner, H.; Bladt, S.; eds.; Springer-Verlag: Berlin, 1996, cap. 7.
Figure 2. Phylogenetic reconstructions of five Spondias species with bootstrap values indicated at the nodes